Oleg Rodin / 프로필
- 정보
|
12+ 년도
경험
|
50
제품
|
552
데모 버전
|
|
0
작업
|
0
거래 신호
|
0
구독자
|
여보세요!
저는 이미 15년 동안 상인이자 거래 소프트웨어 개발자였습니다. 여기에서 저는 다른 시장을 거래하는 데 사용할 수 있는 고품질 도구를 제공하는 다른 거래자들과 제 경험을 공유하기 위해 최선을 다합니다.
제 목표는 전 세계의 트레이더가 현재 경험 수준에 관계없이 거래에서 성공할 수 있도록 돕는 것입니다. 그게 내가 여기 있는 이유야.
나의 최고 품질의 지원과 도구를 사용하여 모든 거래자는 쉽게 거래를 더 잘할 수 있습니다.
저는 이미 15년 동안 상인이자 거래 소프트웨어 개발자였습니다. 여기에서 저는 다른 시장을 거래하는 데 사용할 수 있는 고품질 도구를 제공하는 다른 거래자들과 제 경험을 공유하기 위해 최선을 다합니다.
제 목표는 전 세계의 트레이더가 현재 경험 수준에 관계없이 거래에서 성공할 수 있도록 돕는 것입니다. 그게 내가 여기 있는 이유야.
나의 최고 품질의 지원과 도구를 사용하여 모든 거래자는 쉽게 거래를 더 잘할 수 있습니다.
Oleg Rodin
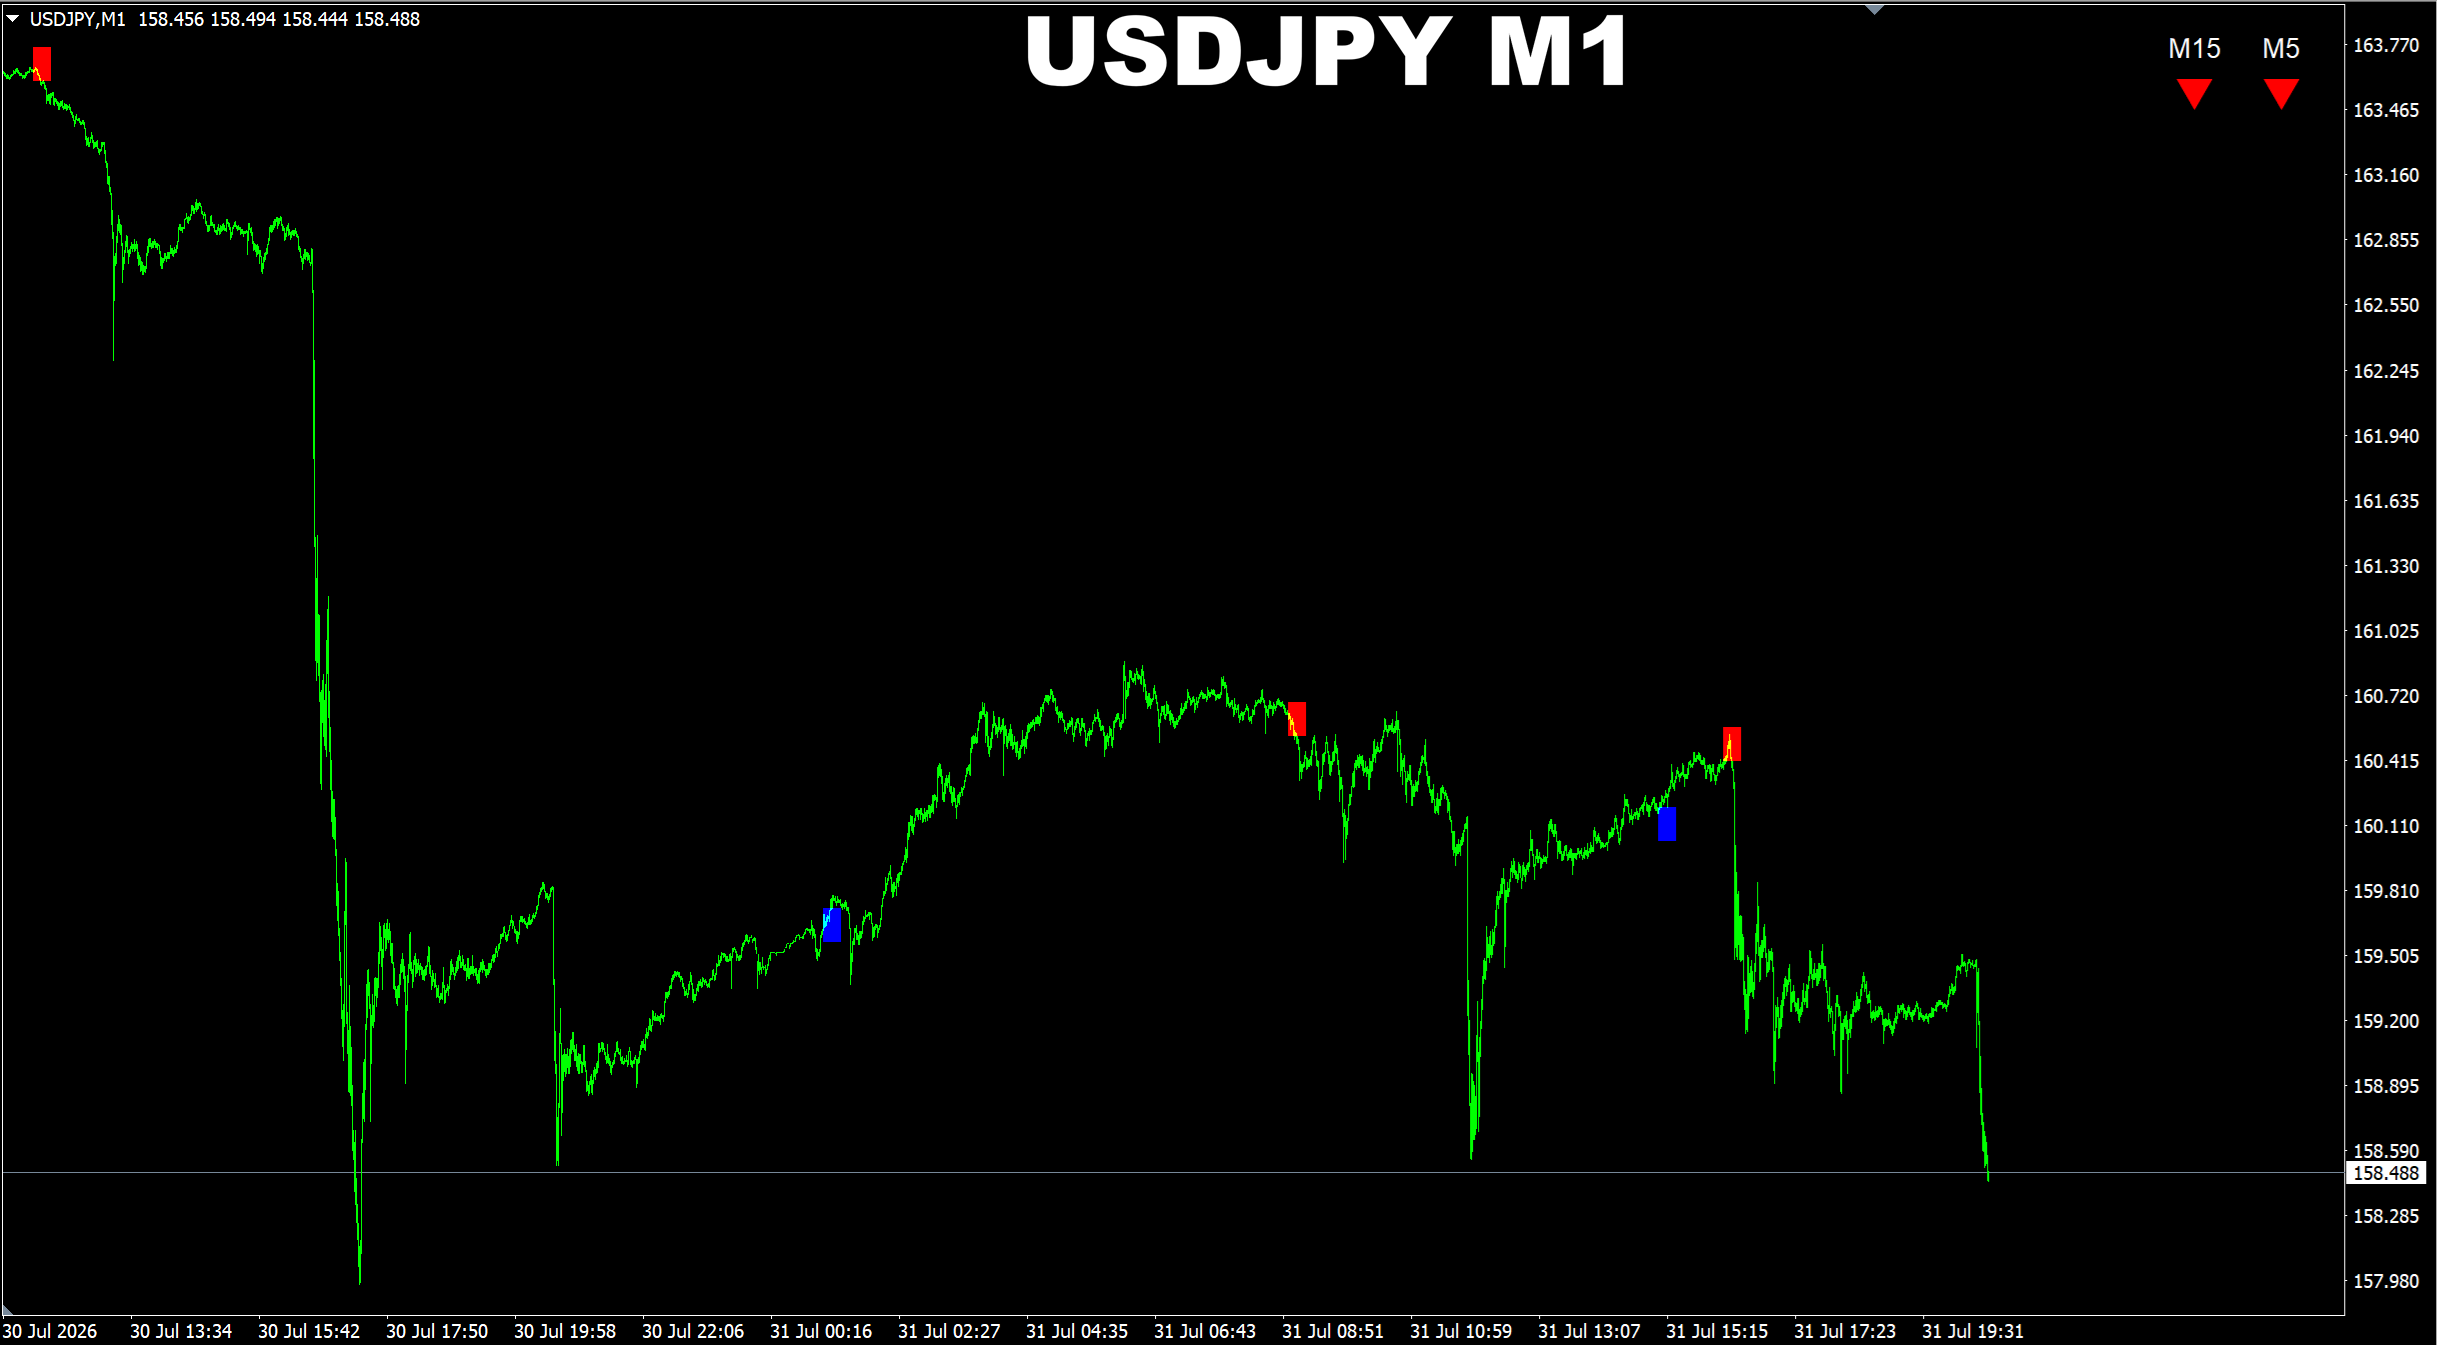
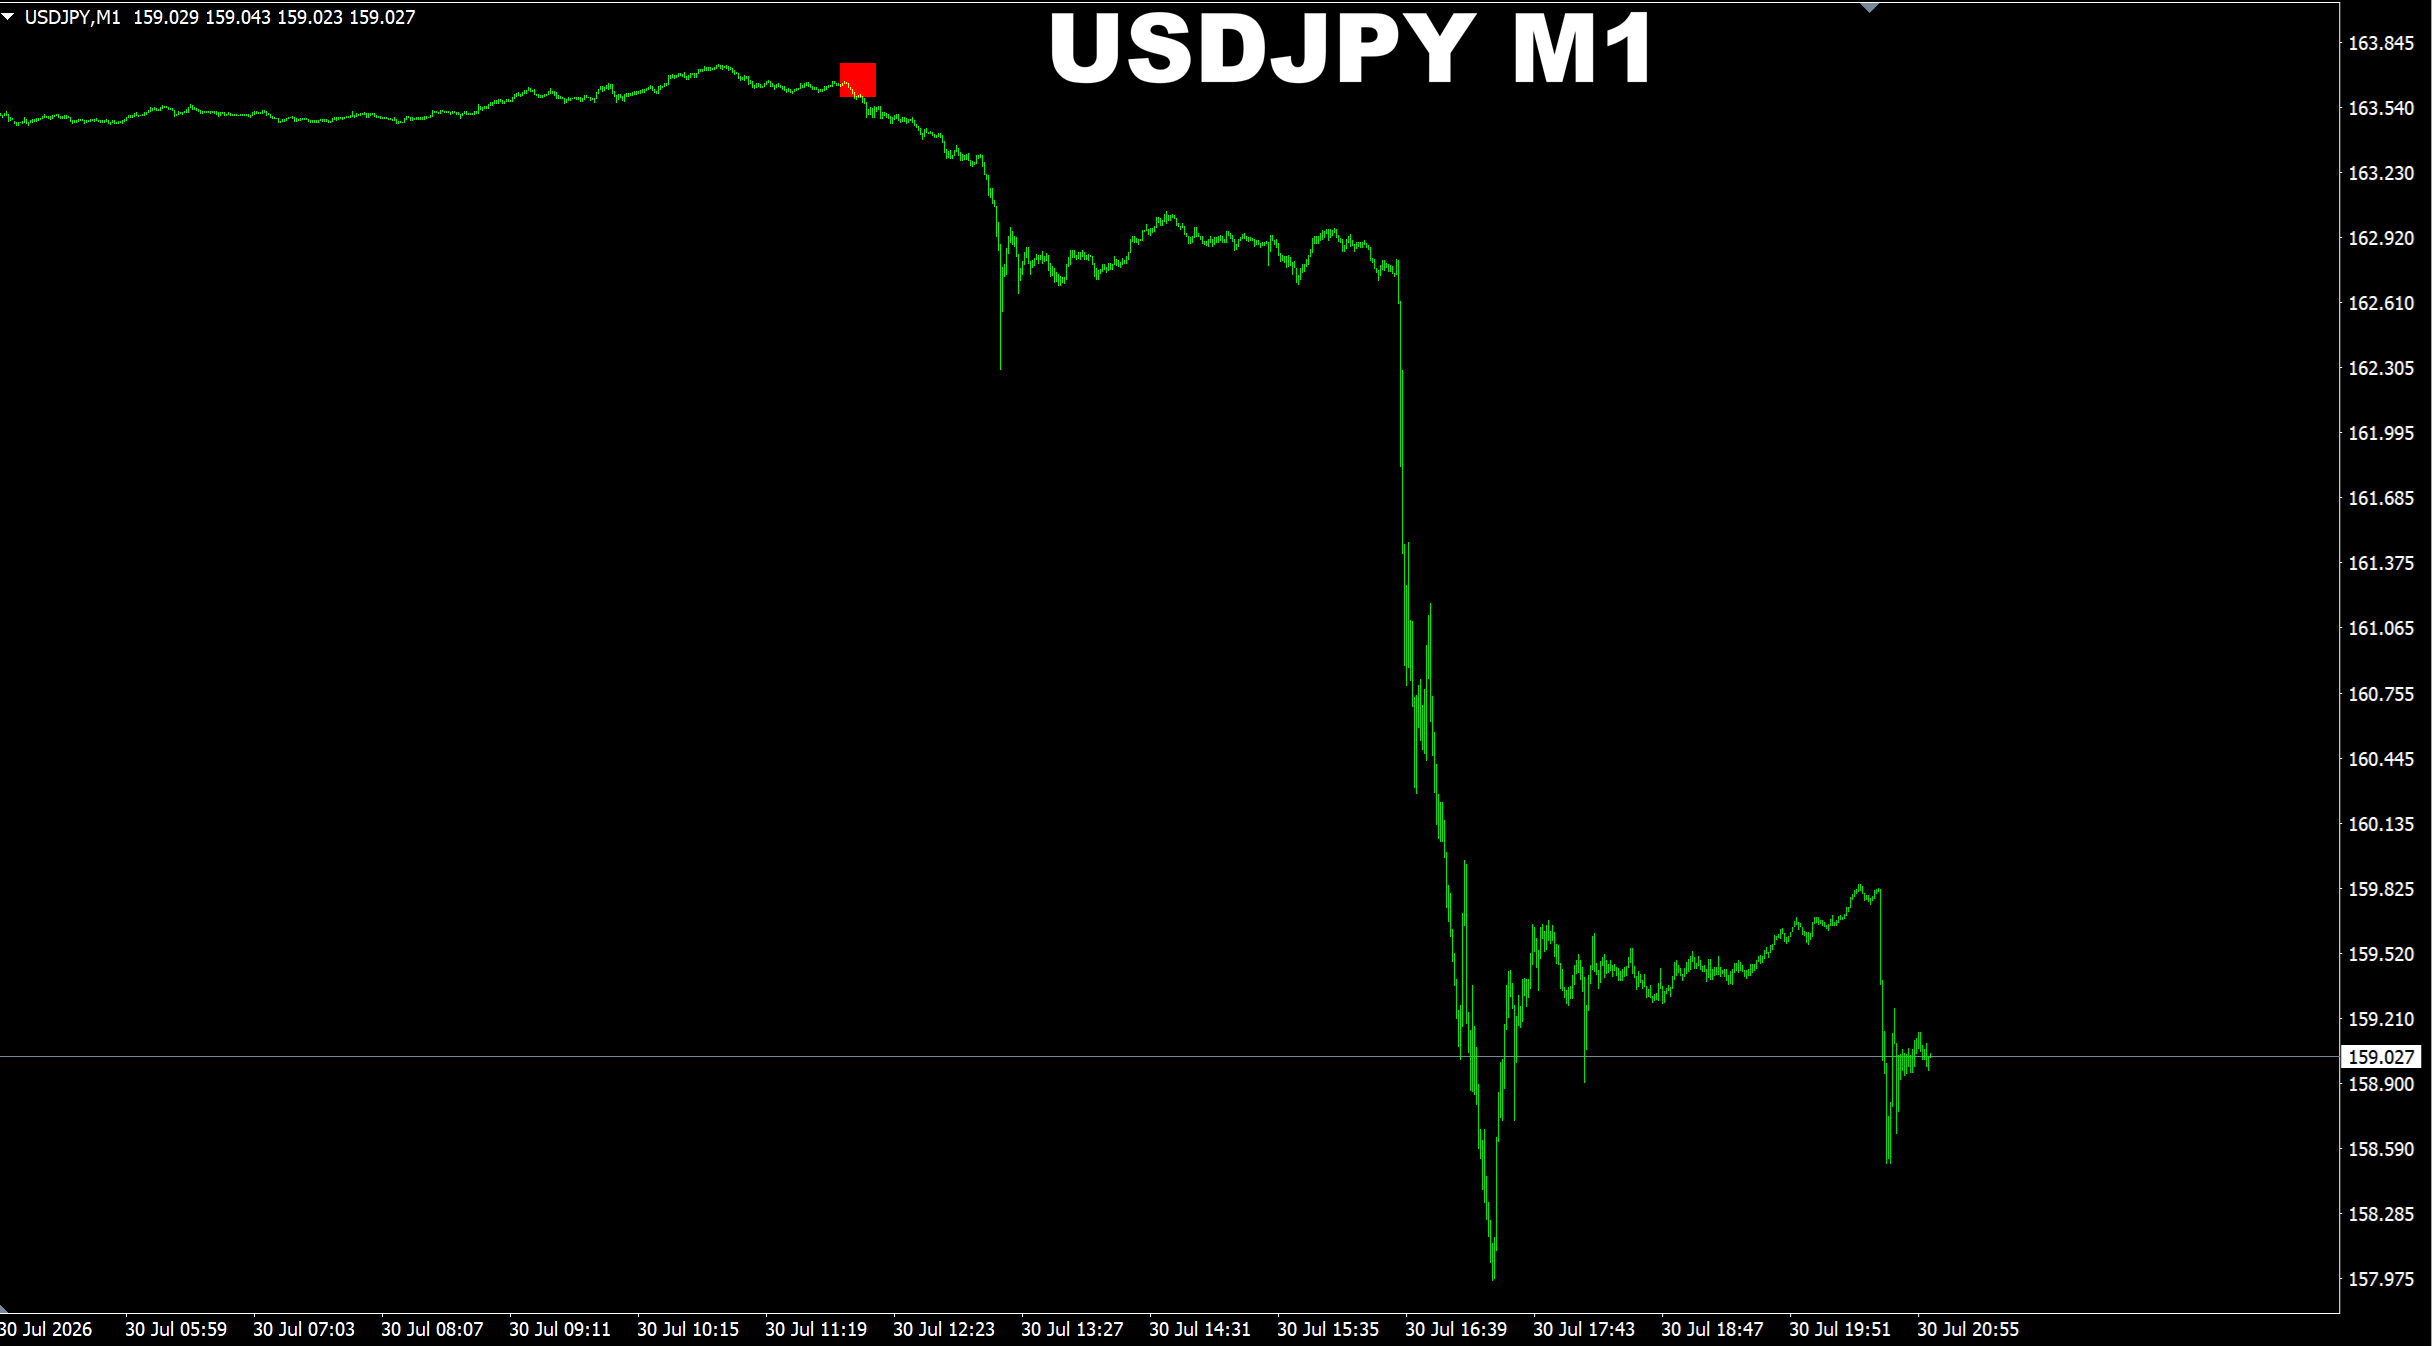
SR Liquidity. USDJPY M1. Default settings + confirmed patterns only option. Recent signals performance.
소셜 네트워크에 공유 ·
3
Oleg Rodin
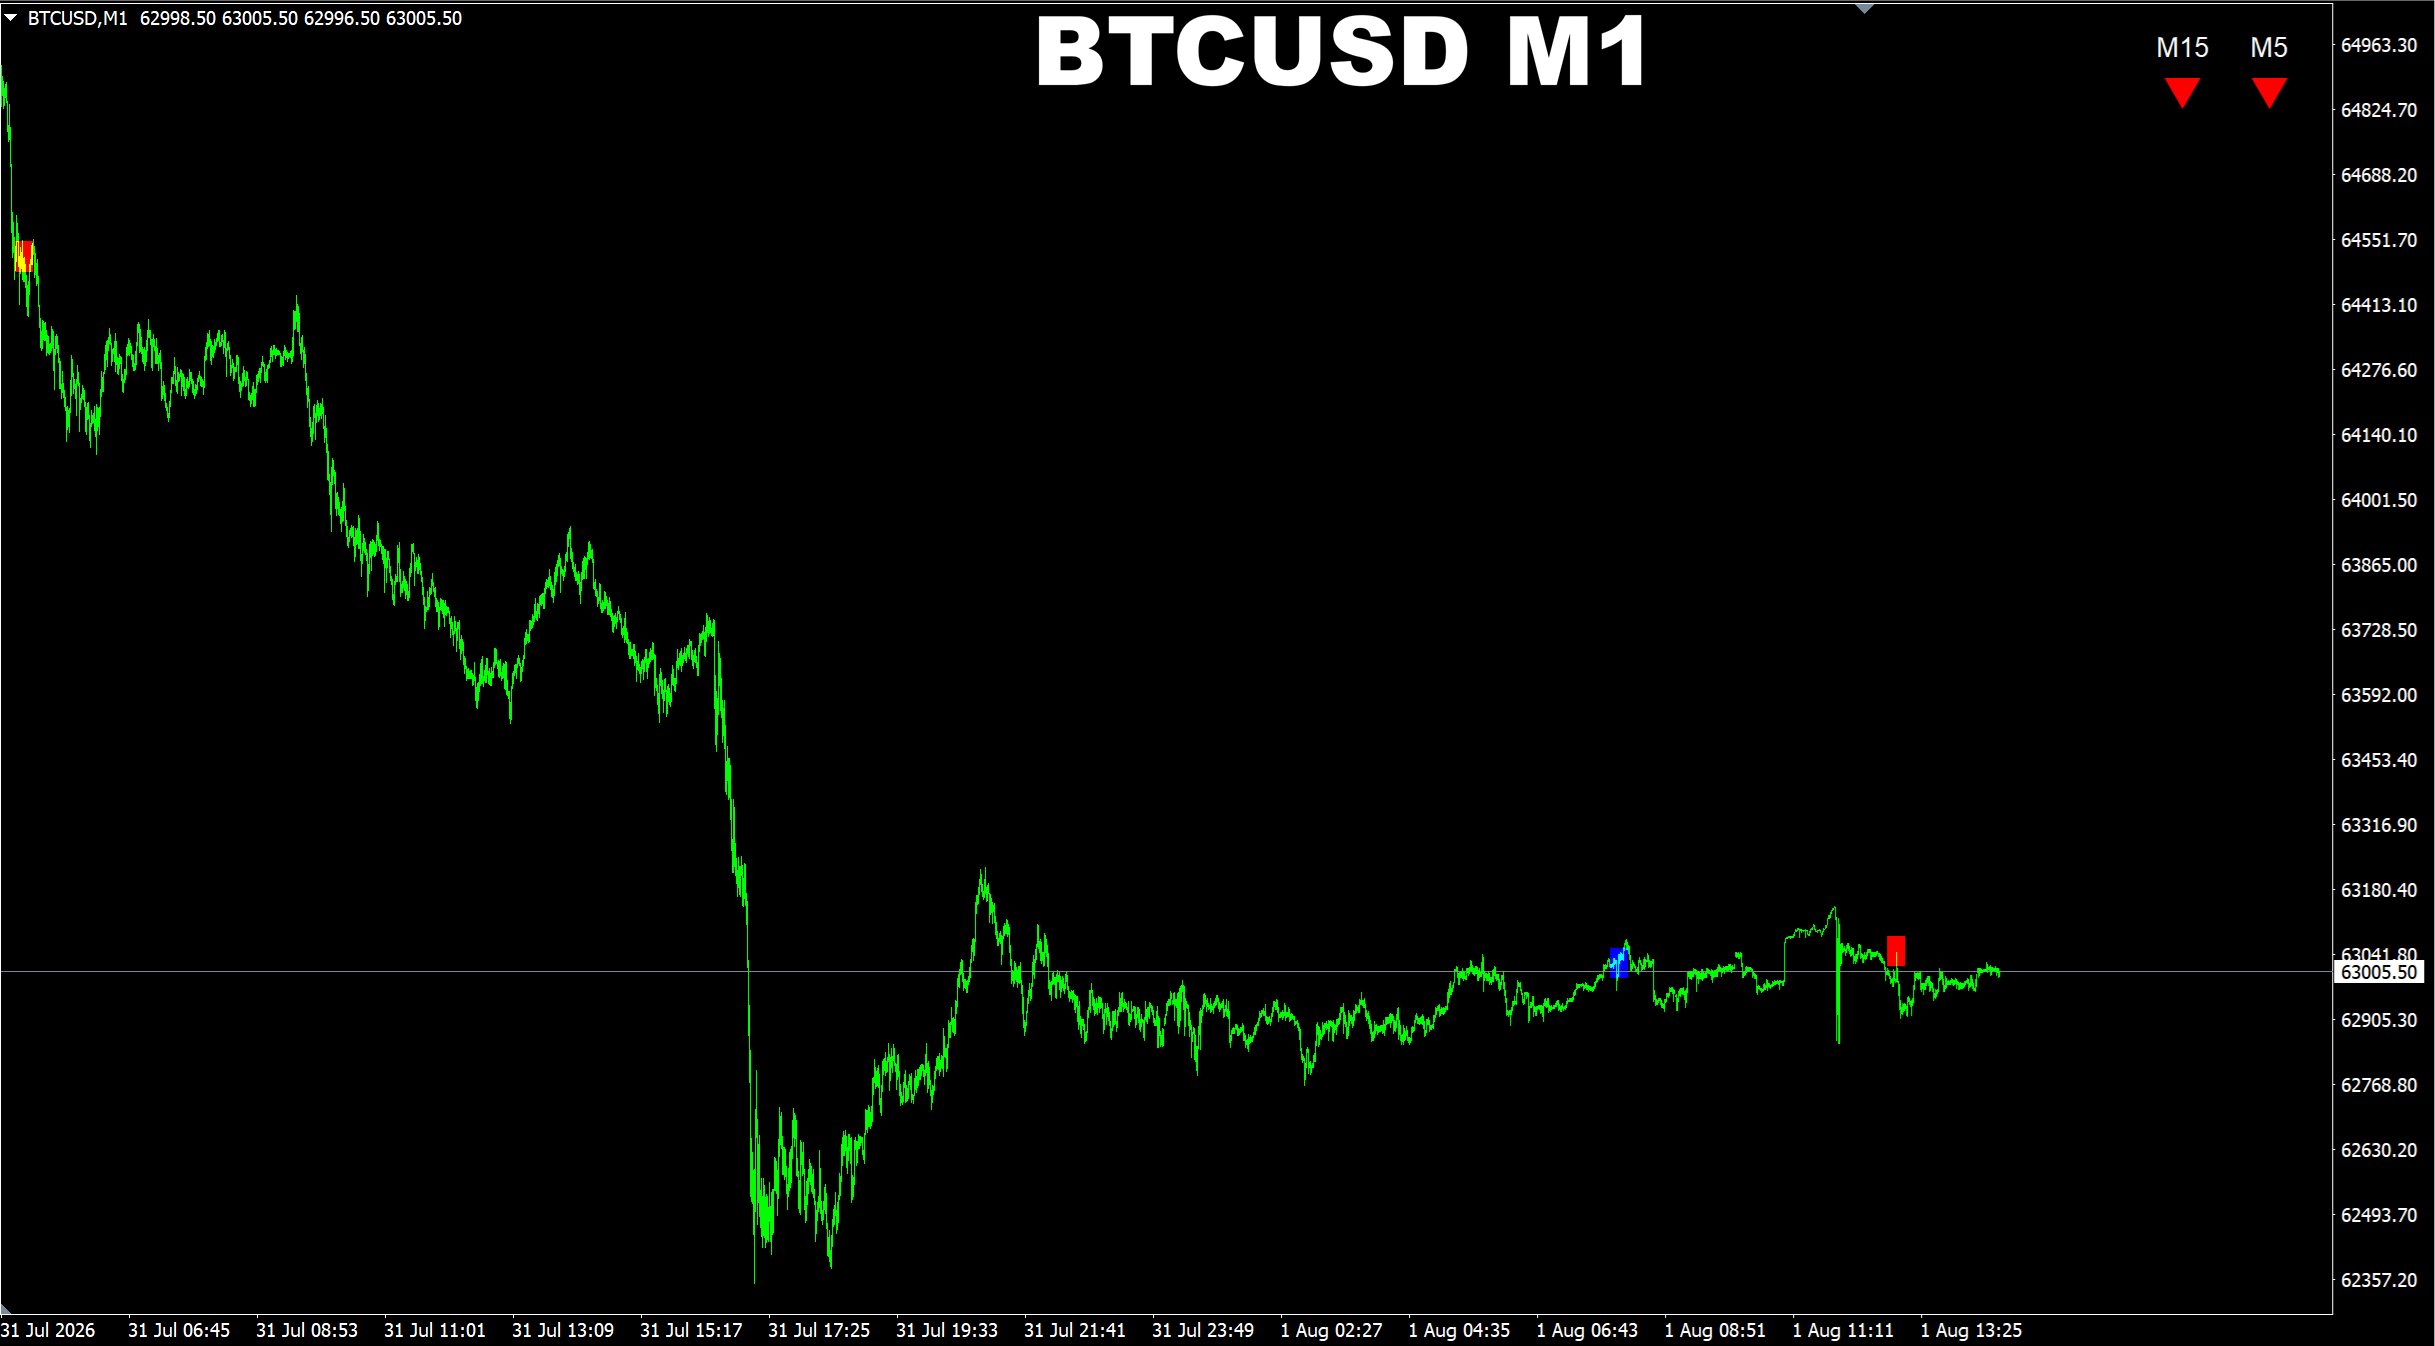
SR Liquidity. BTCUSD M1. Mode5 (less sensitive). Confirmed patterns only. Recent signals performance.
소셜 네트워크에 공유 ·
4
Oleg Rodin
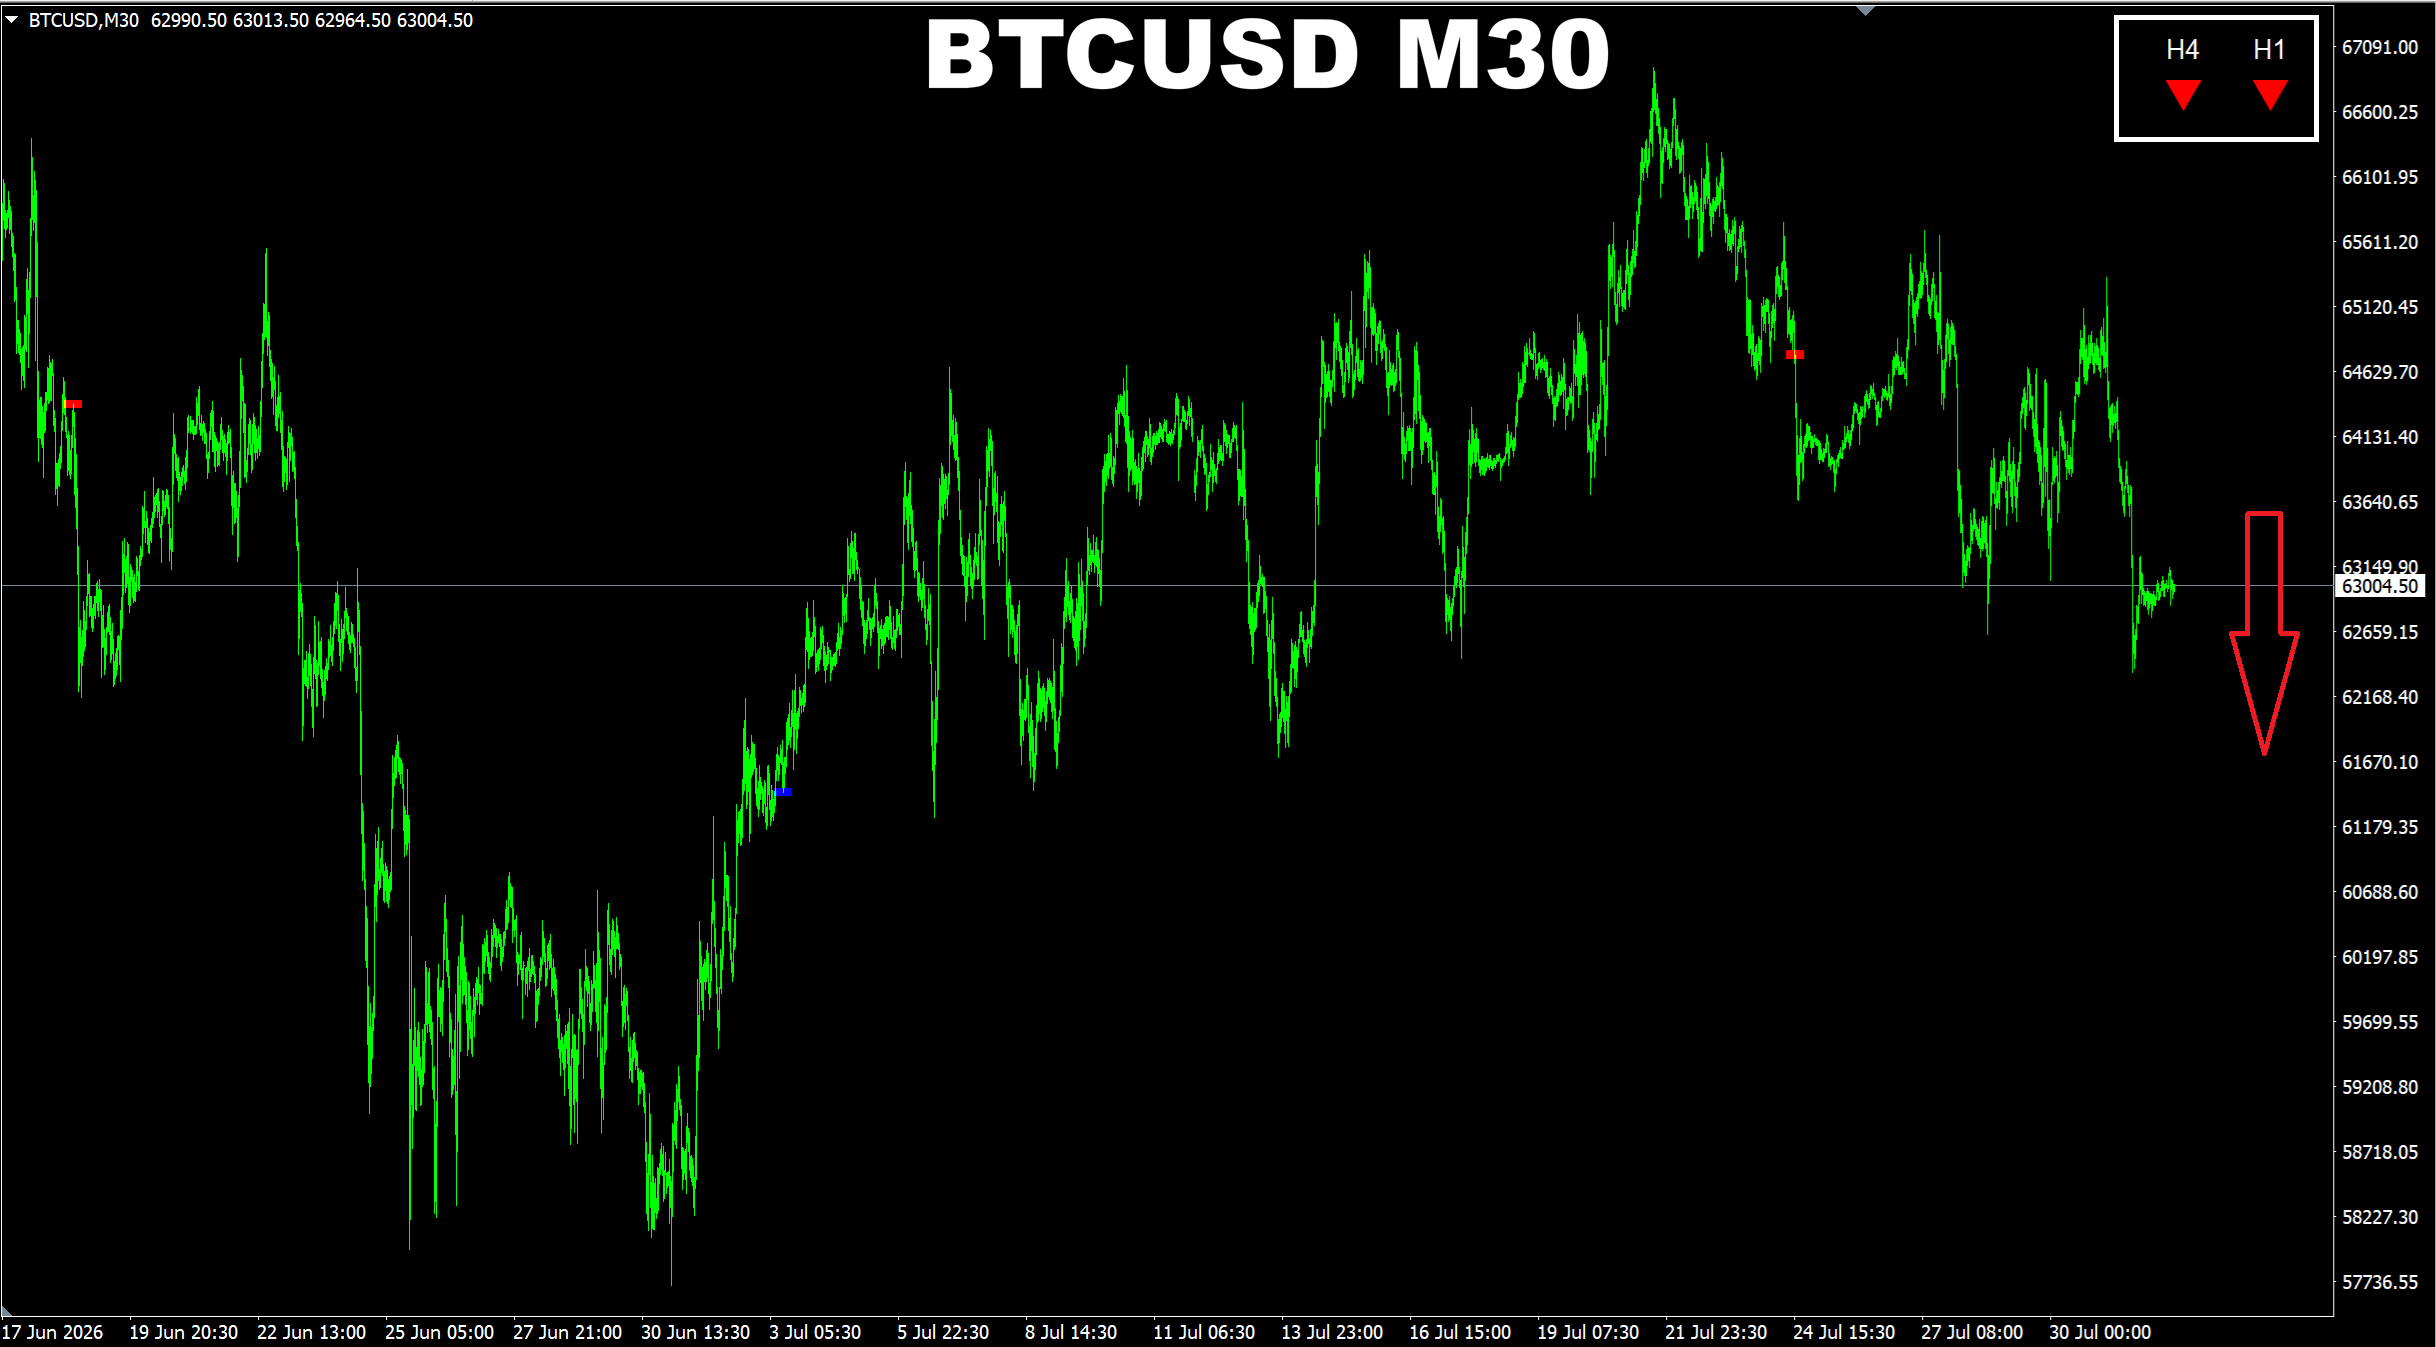
SR Liquidity. BTCUSD M30. Update on current market. The selling pressure will prevail in the medium-term perspective.
소셜 네트워크에 공유 ·
4
Oleg Rodin
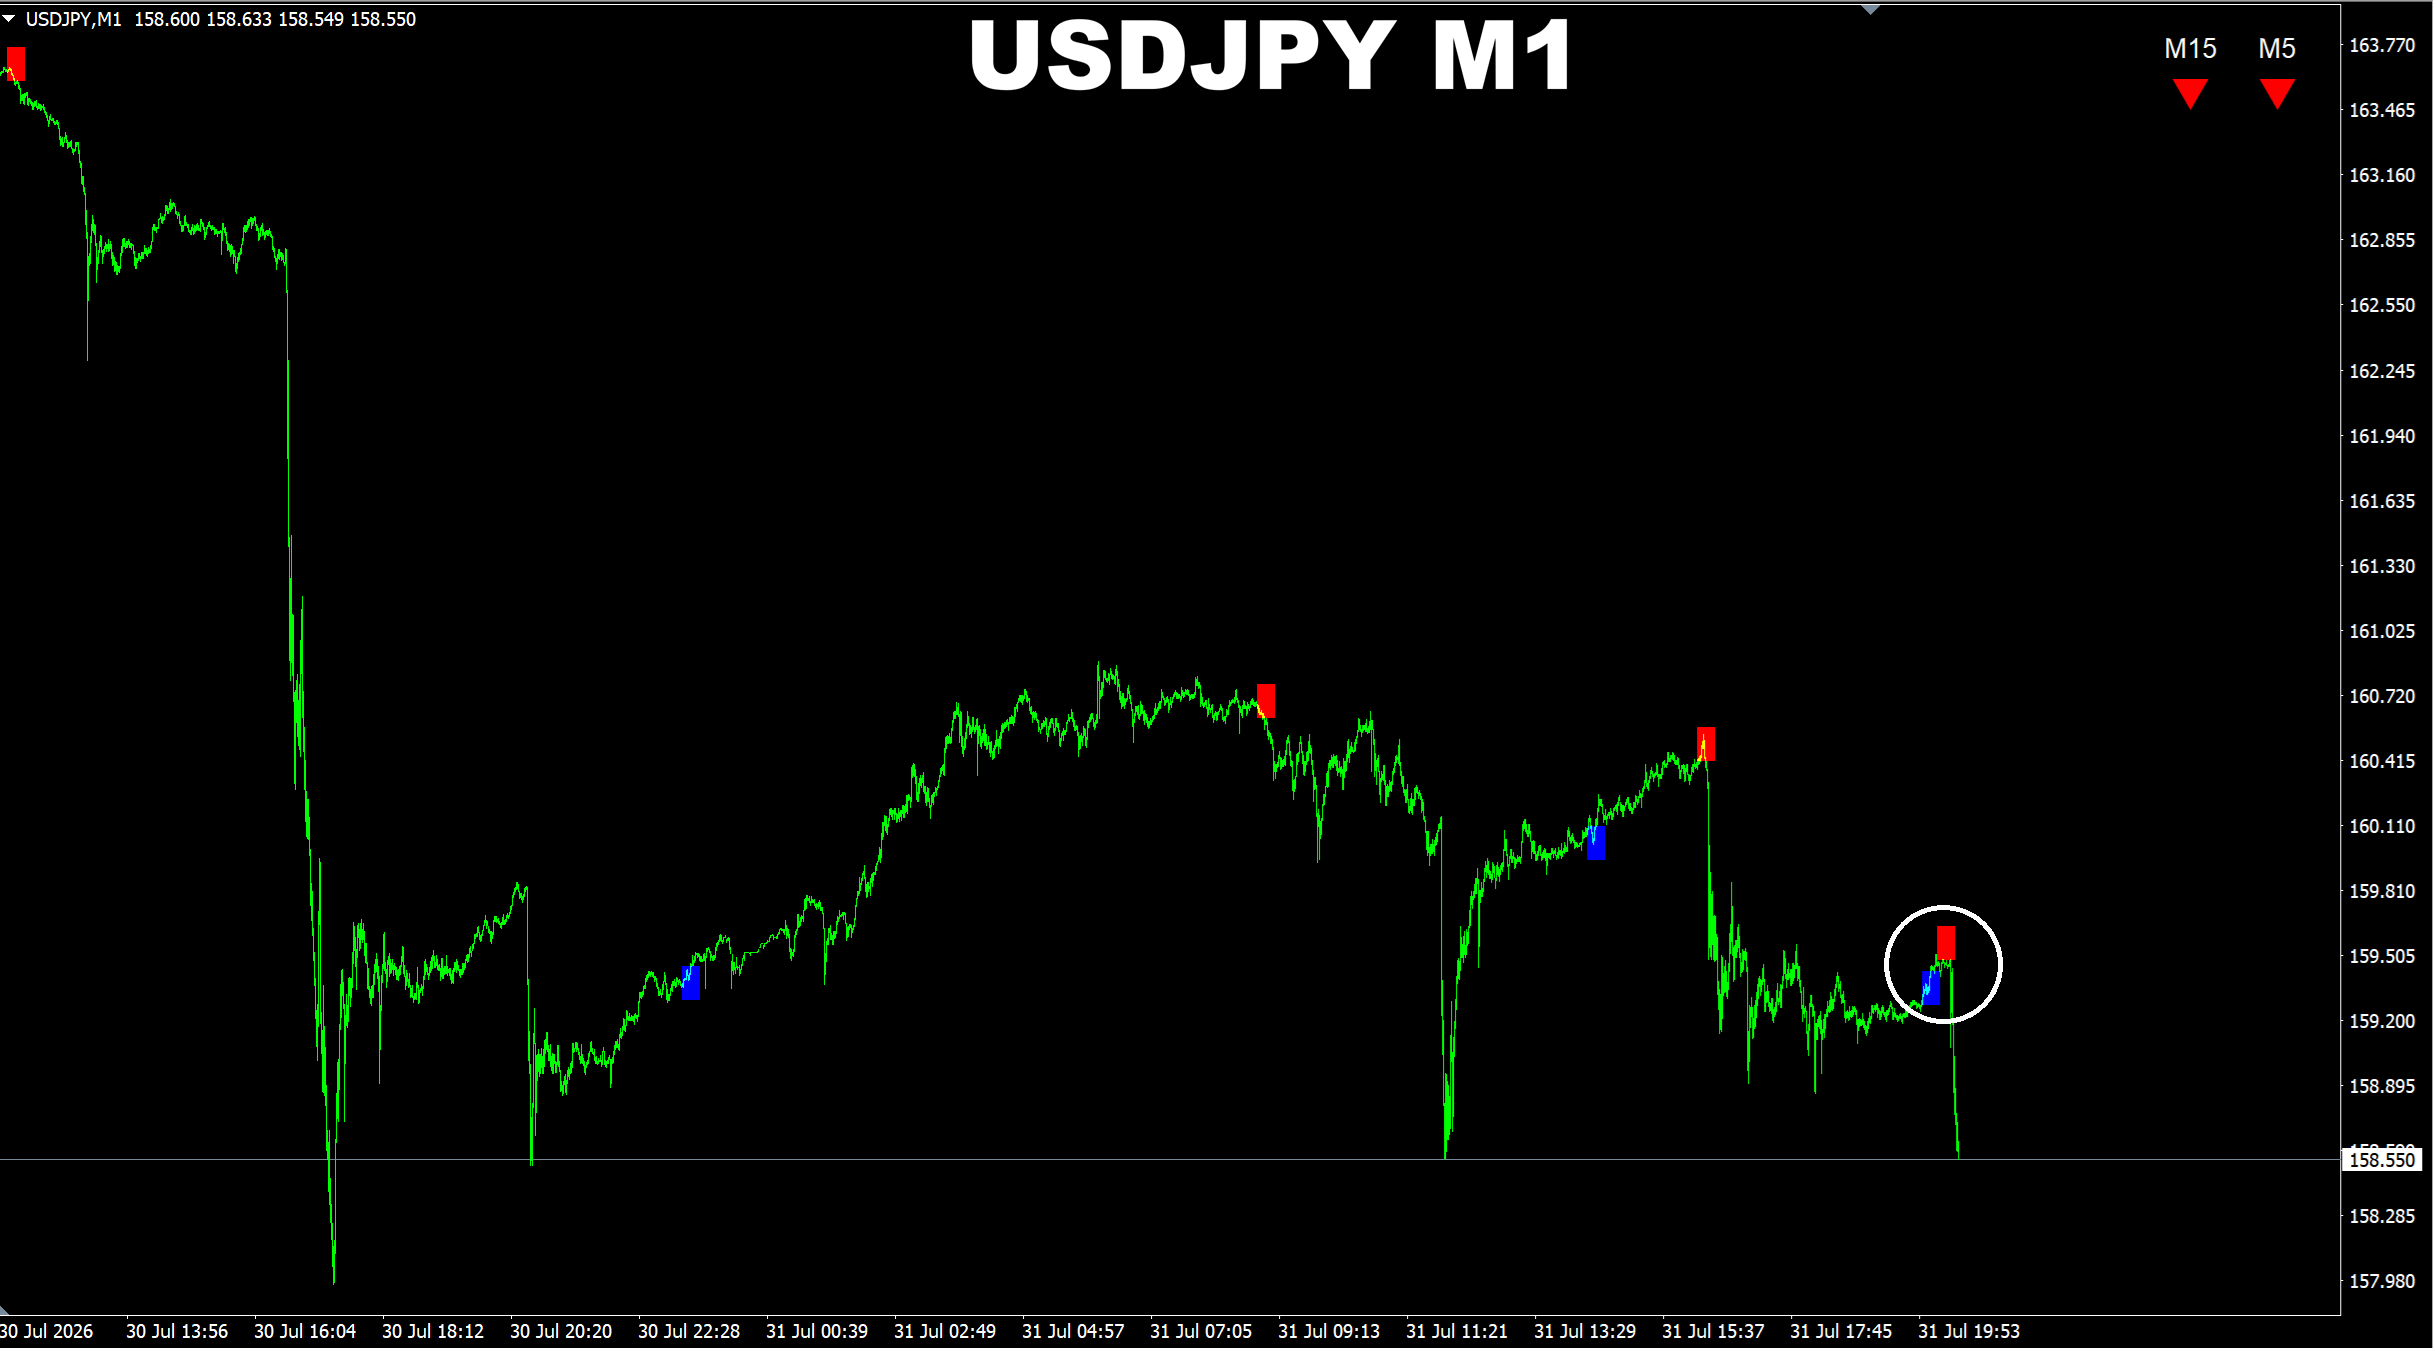
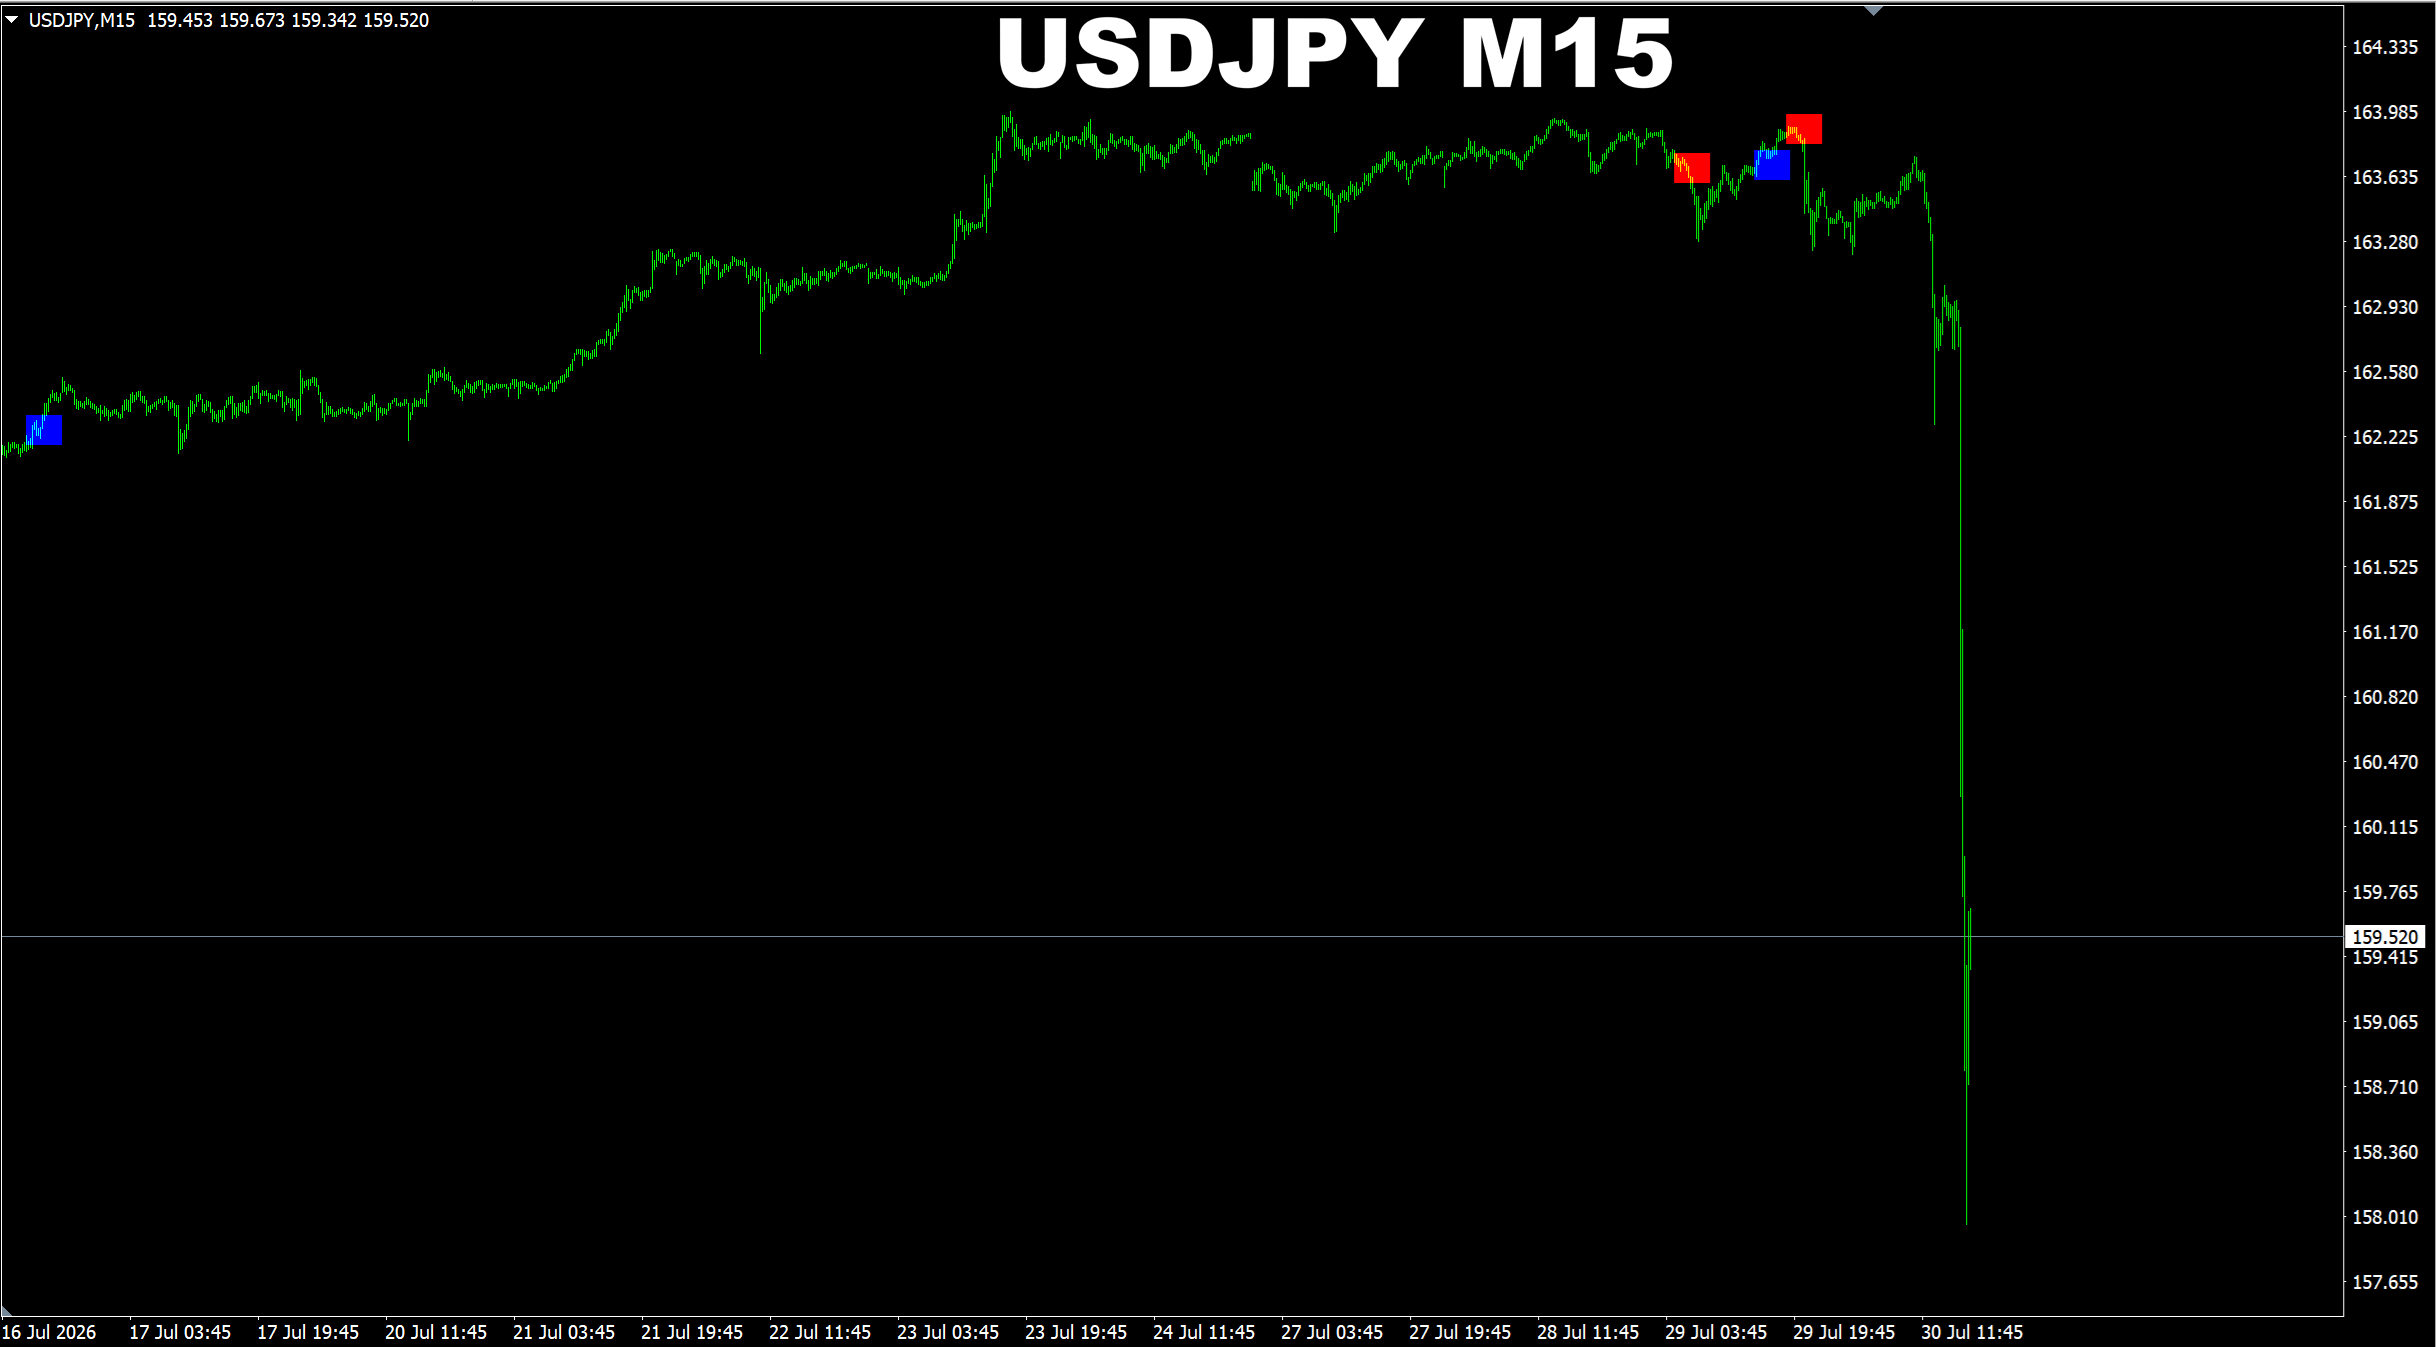
SR Liquidity. USDJPY M1. Default settings + confirmed patterns option being active. Recent signals performance.
소셜 네트워크에 공유 ·
2
Oleg Rodin
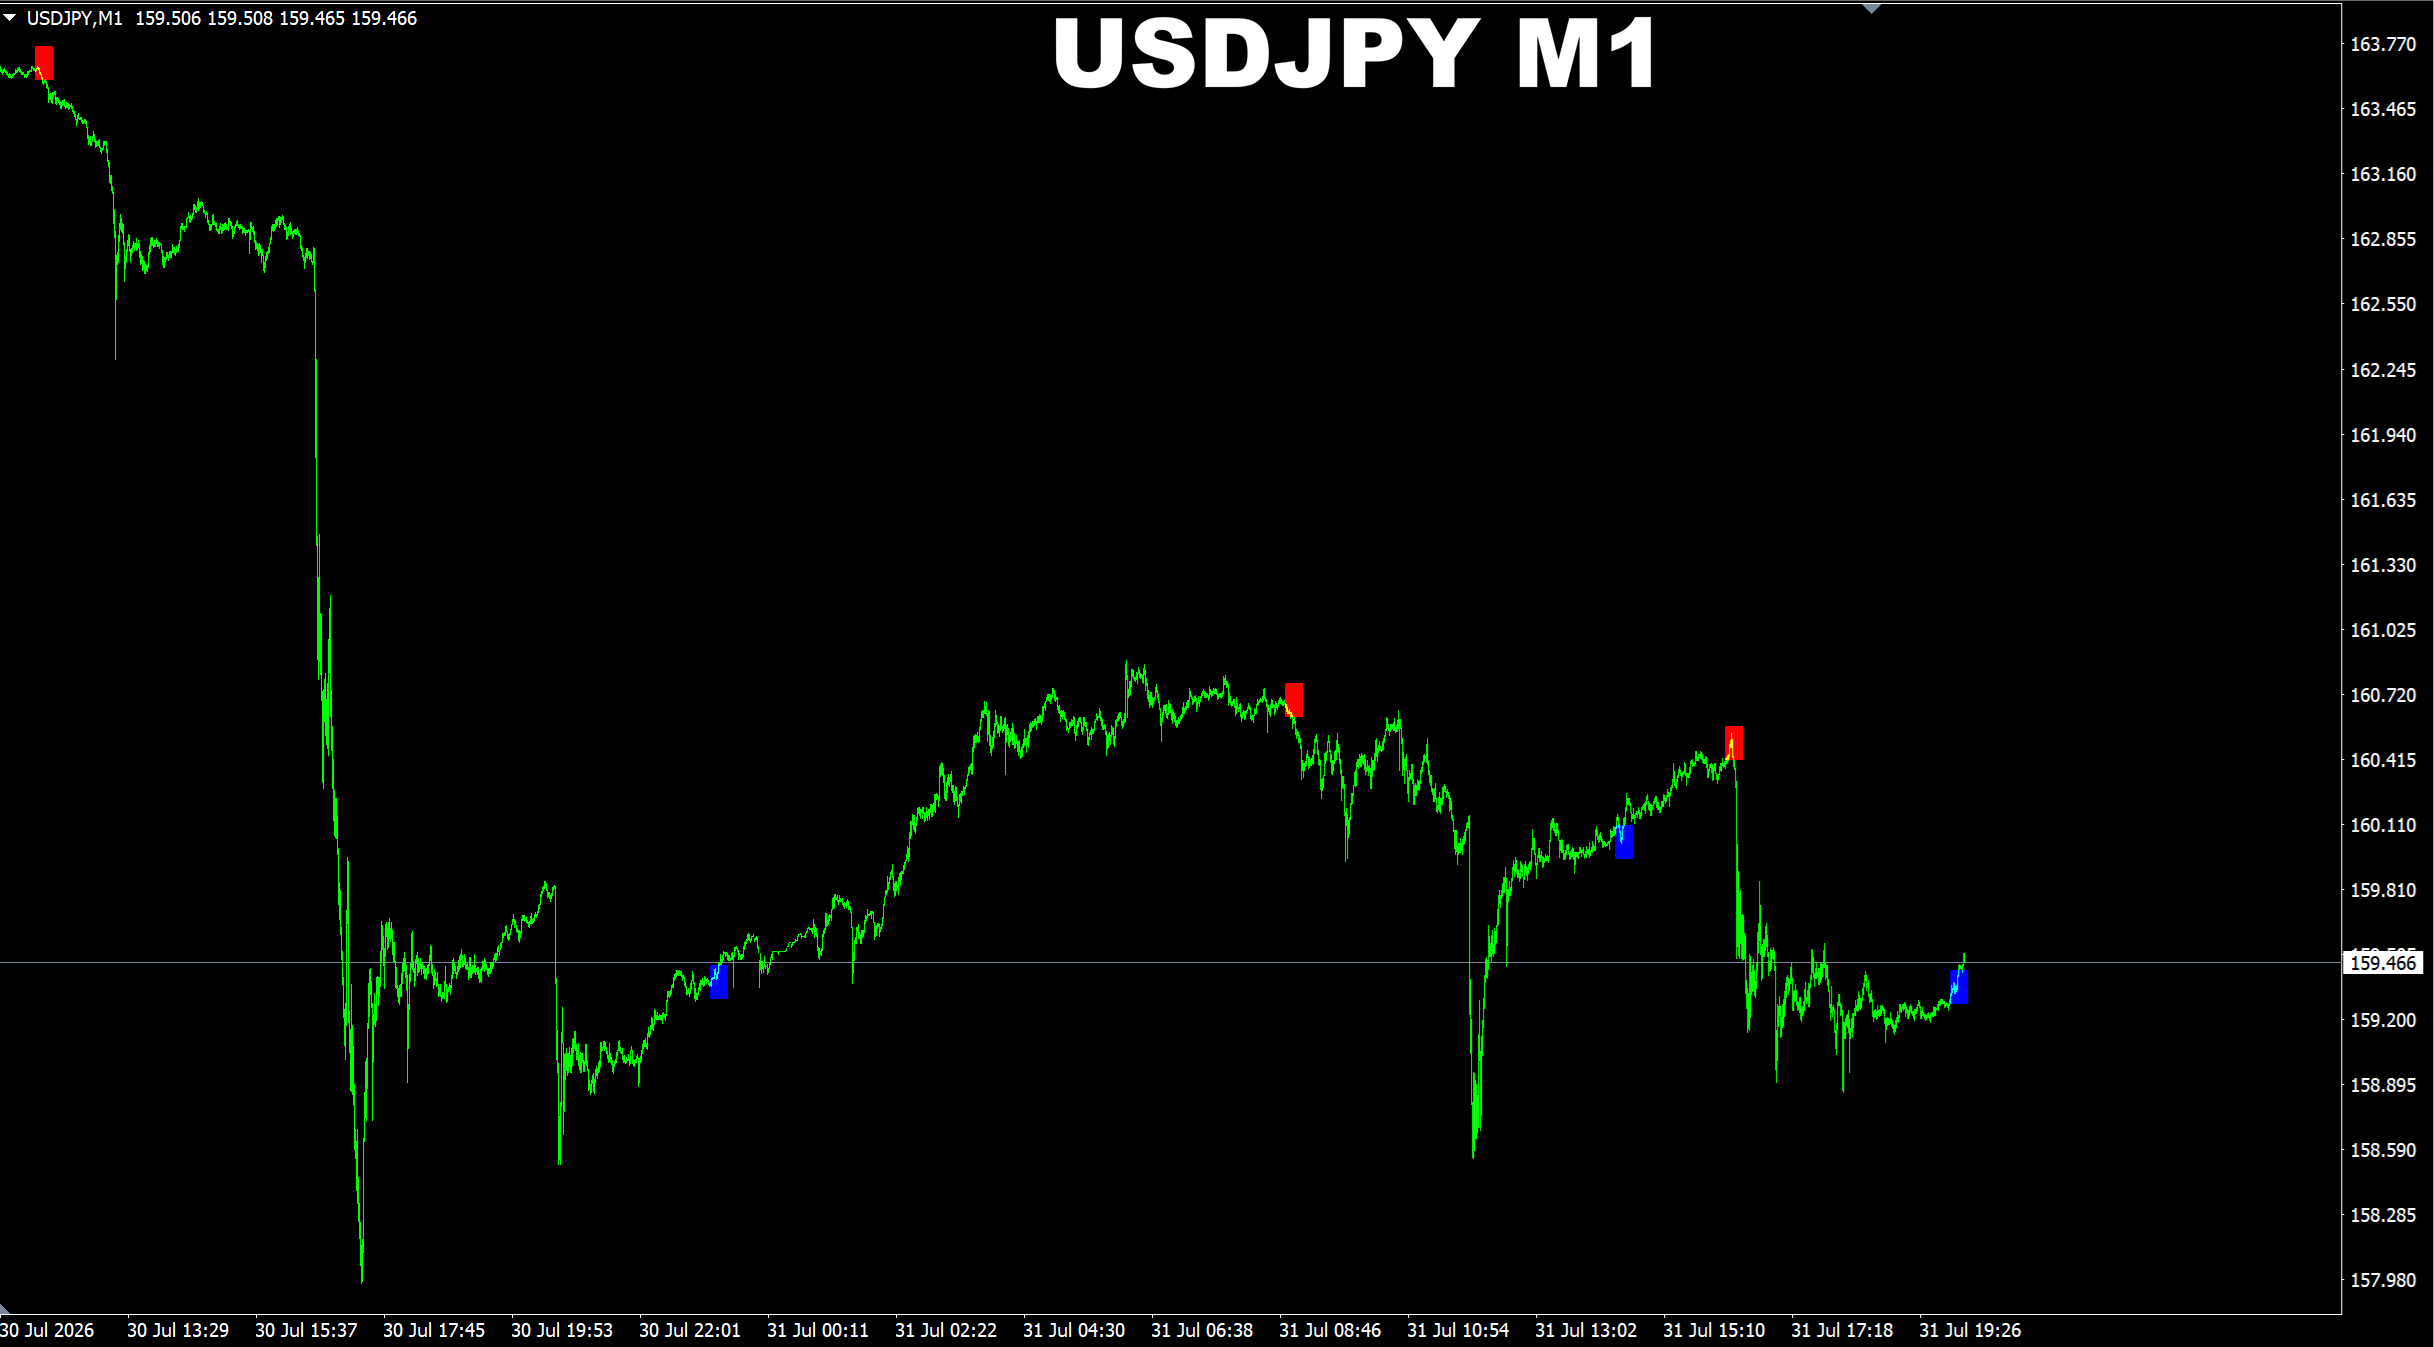
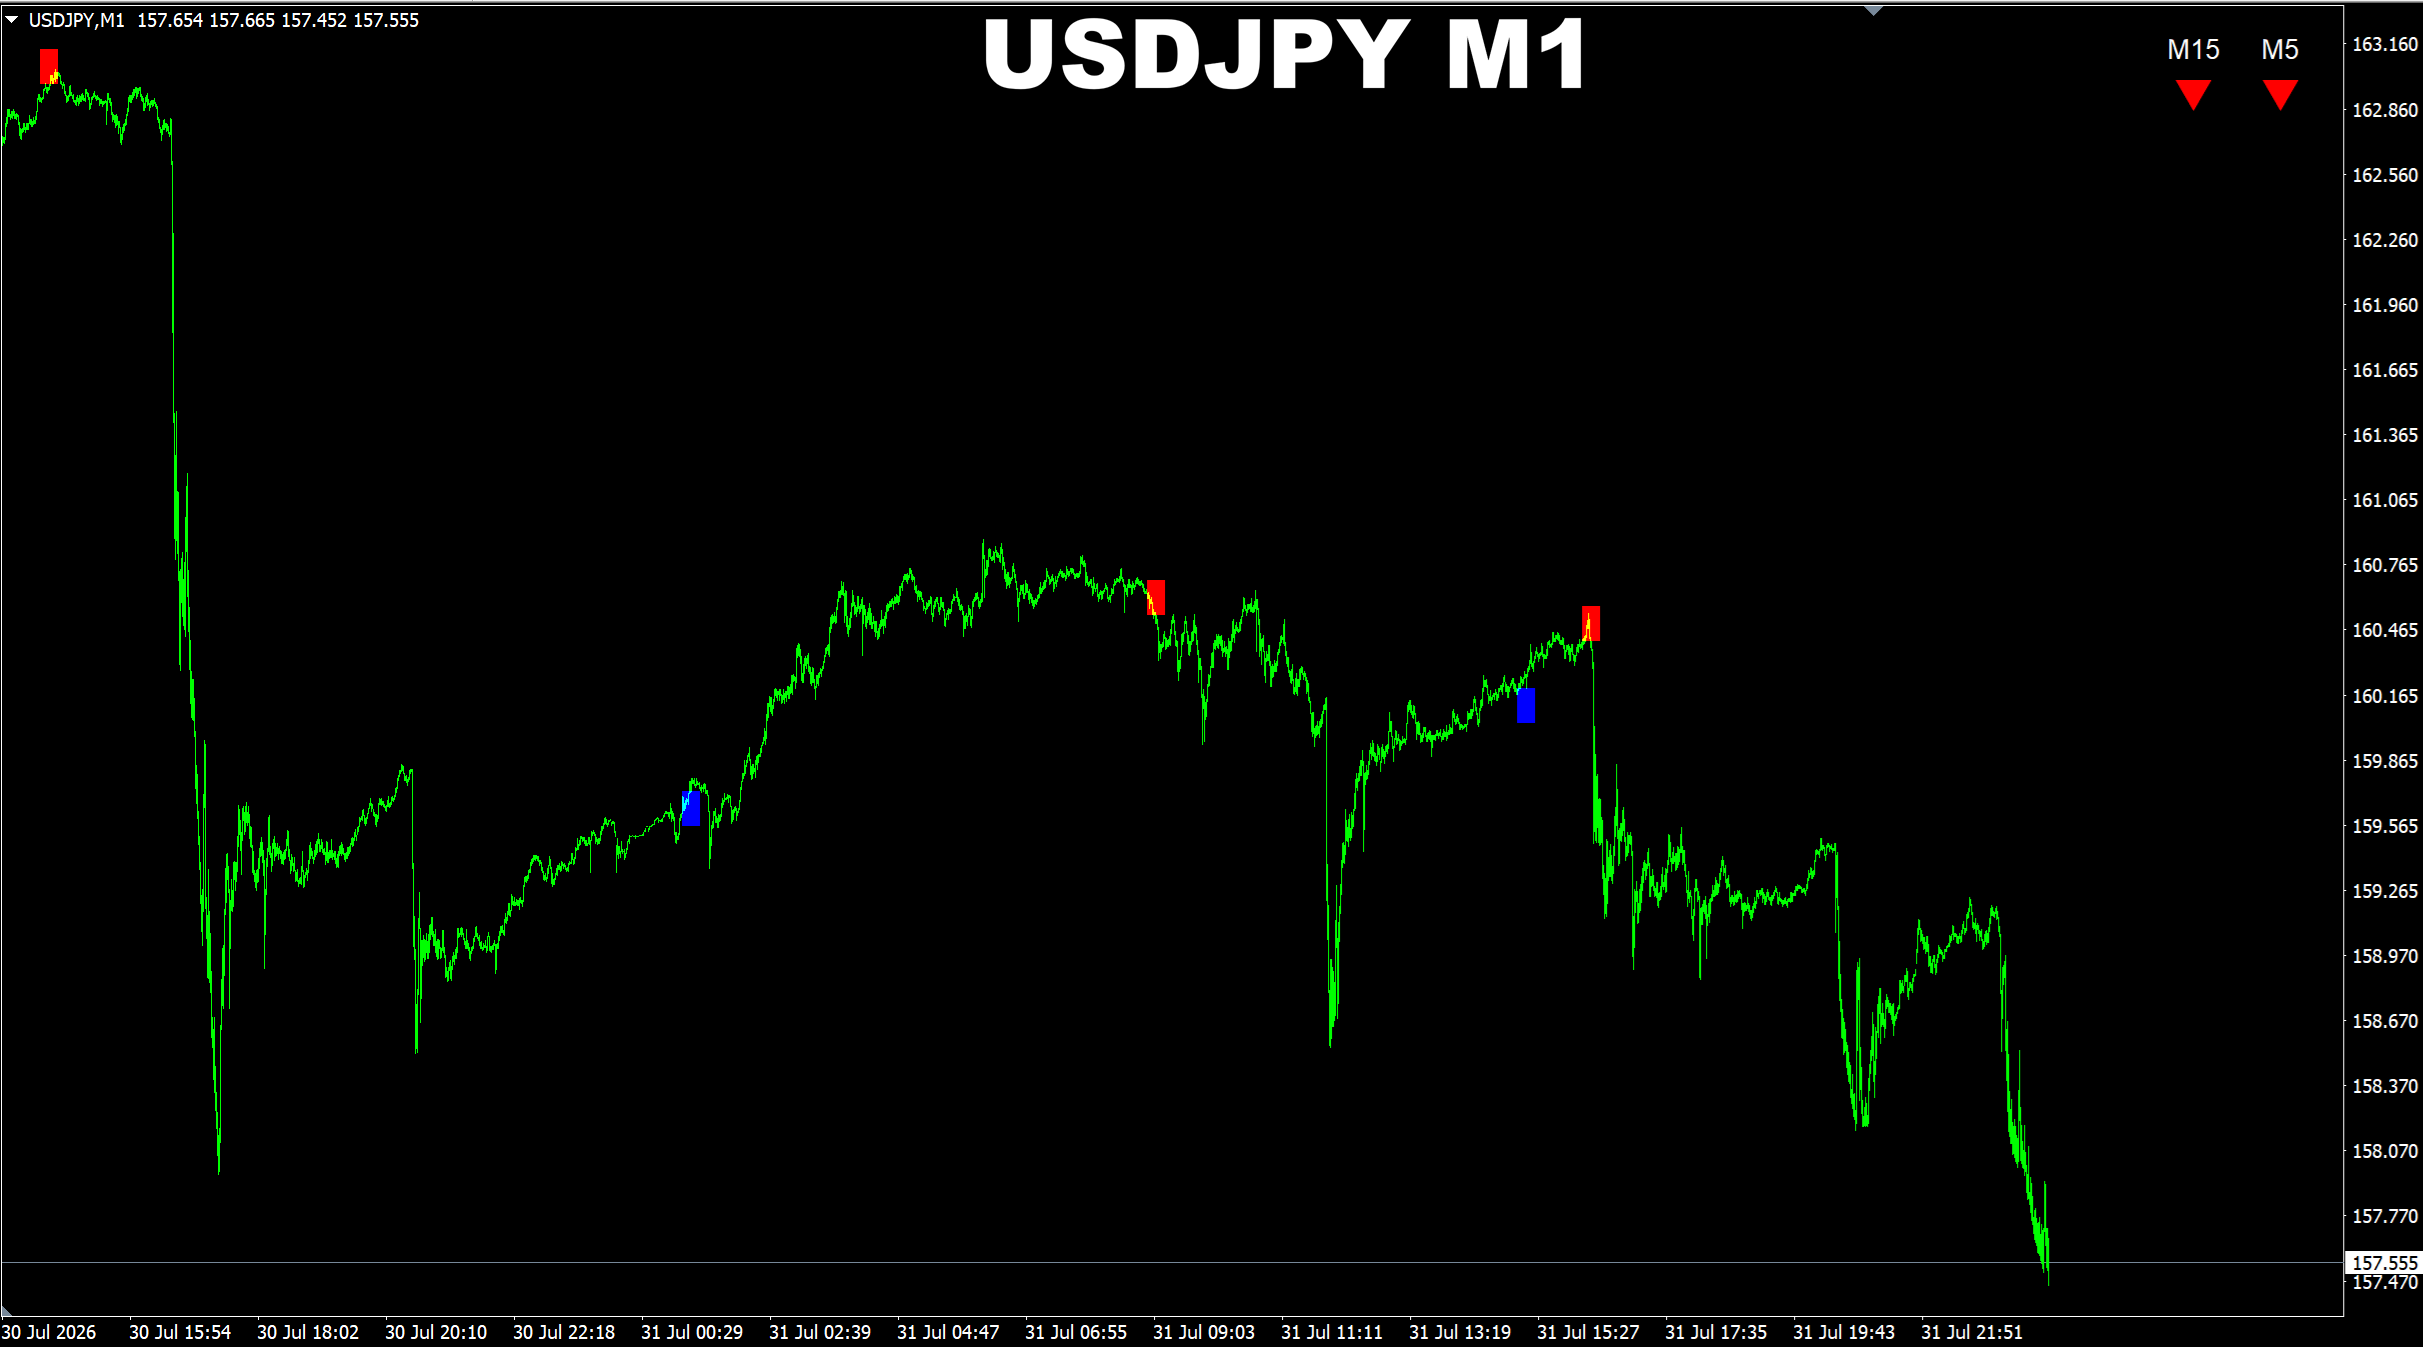
SR Liquidity. USDJPY M1. Dynamic Mode 2. Confirmed patterns only. Update on recent signals performance. The algo suggested changing the direction right after the previous buy pattern area was broken.
소셜 네트워크에 공유 ·
2
Oleg Rodin
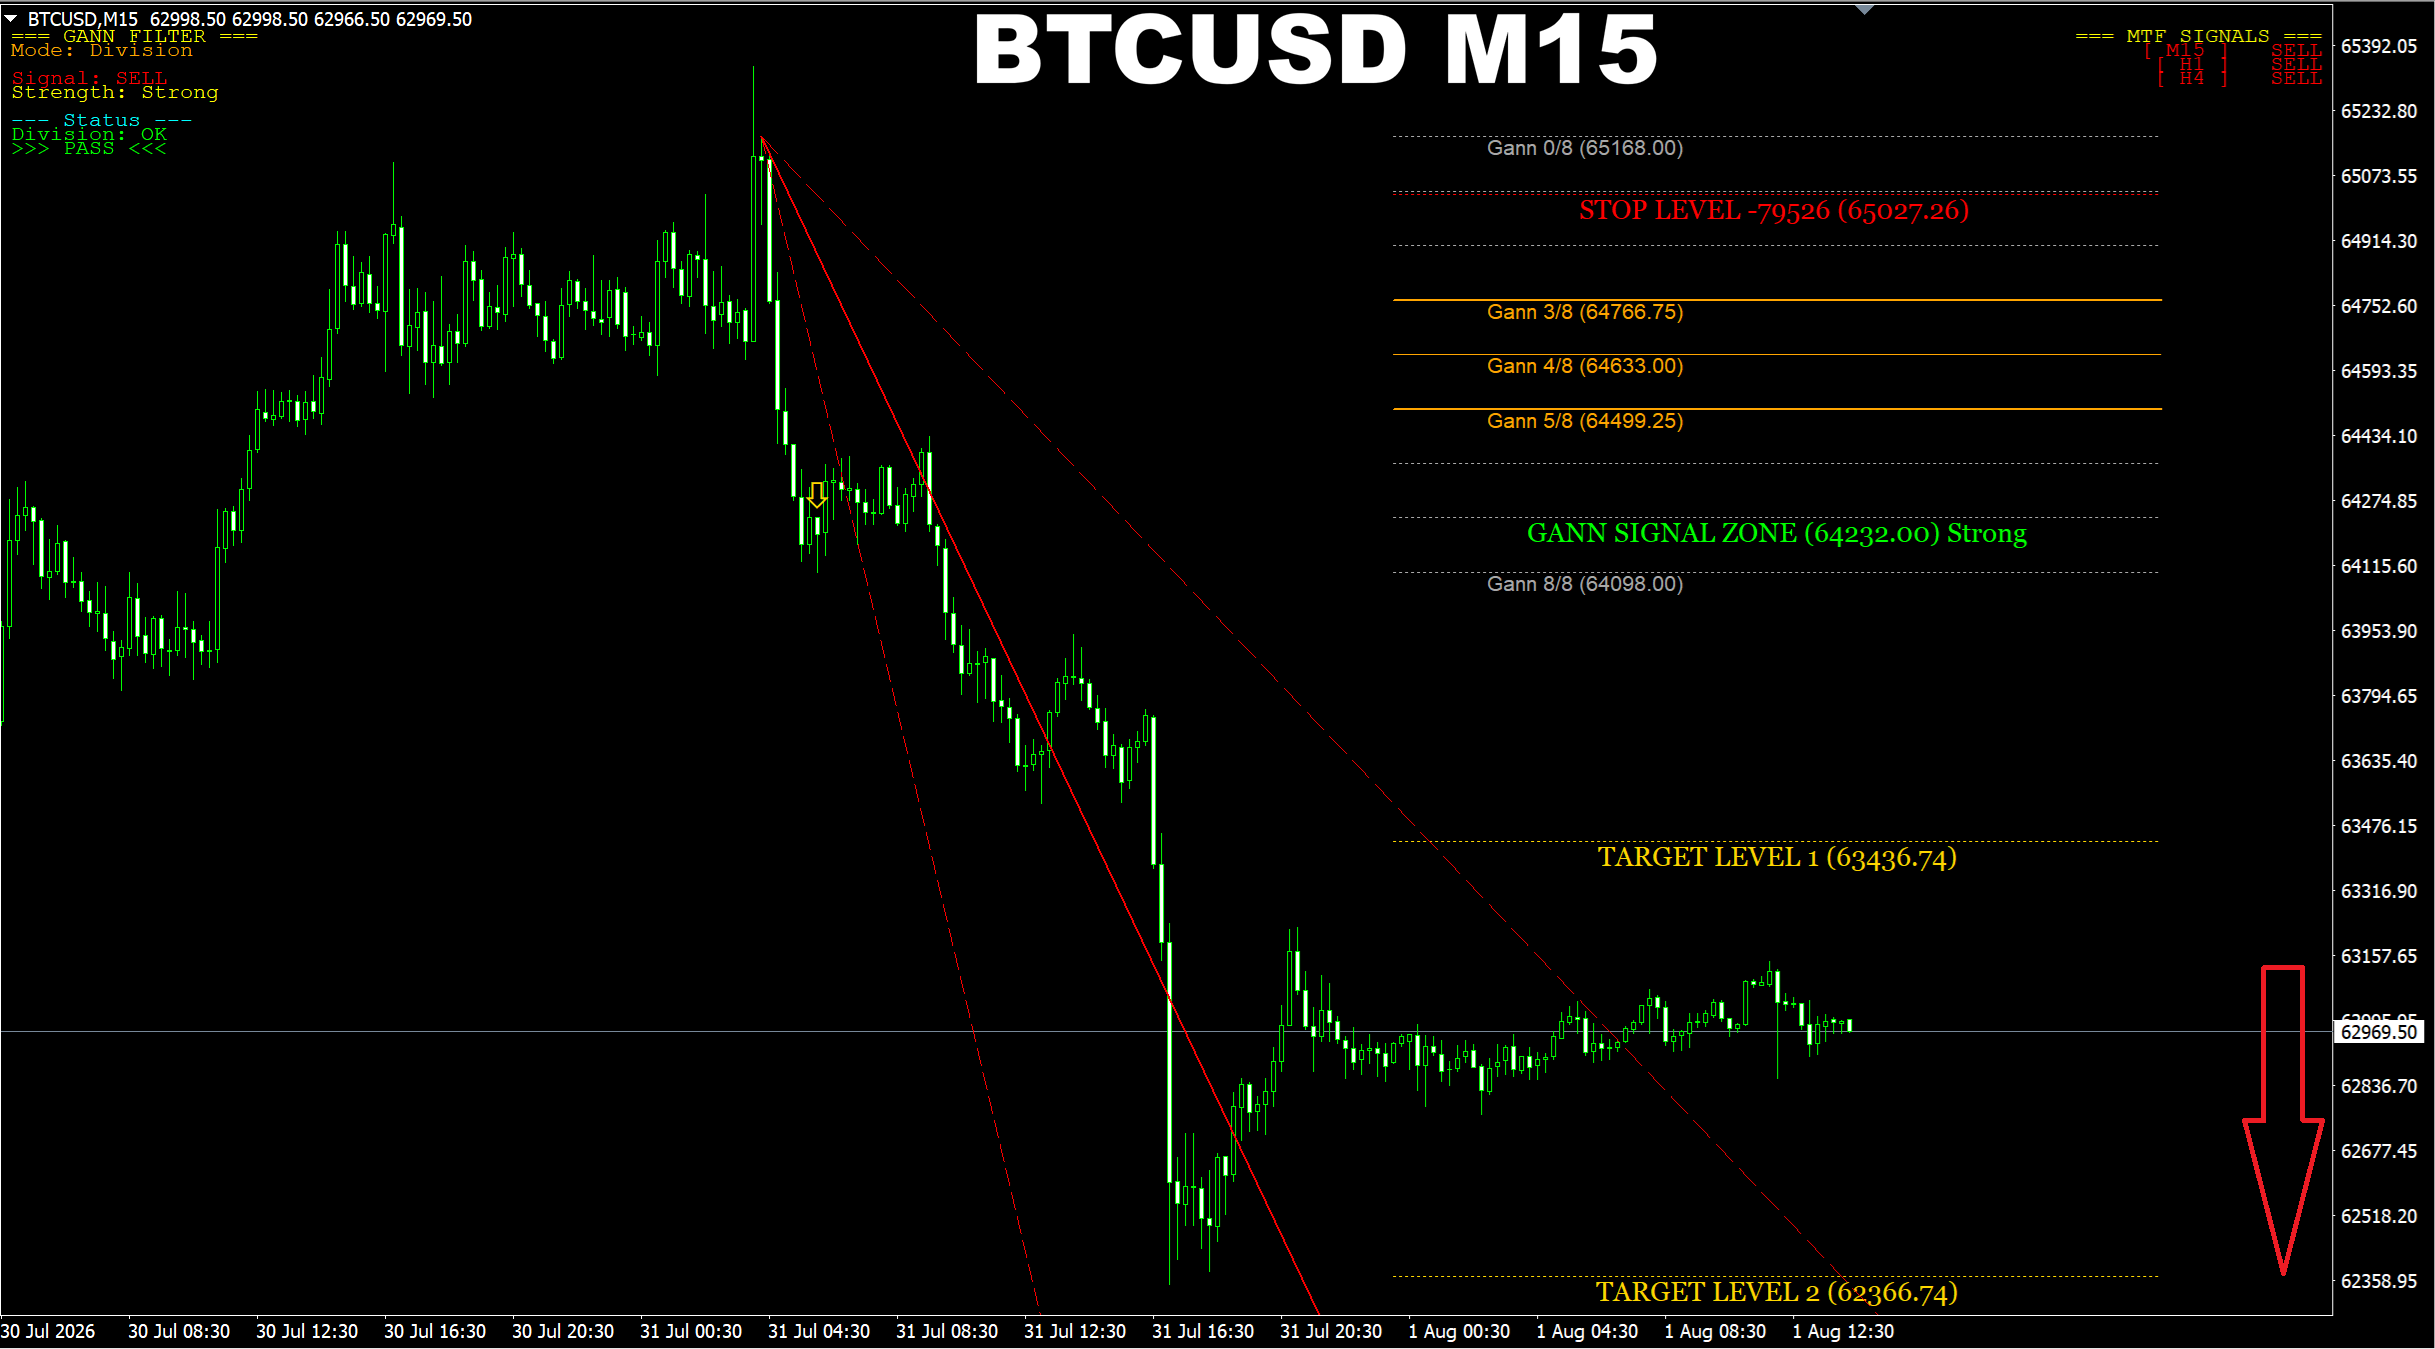
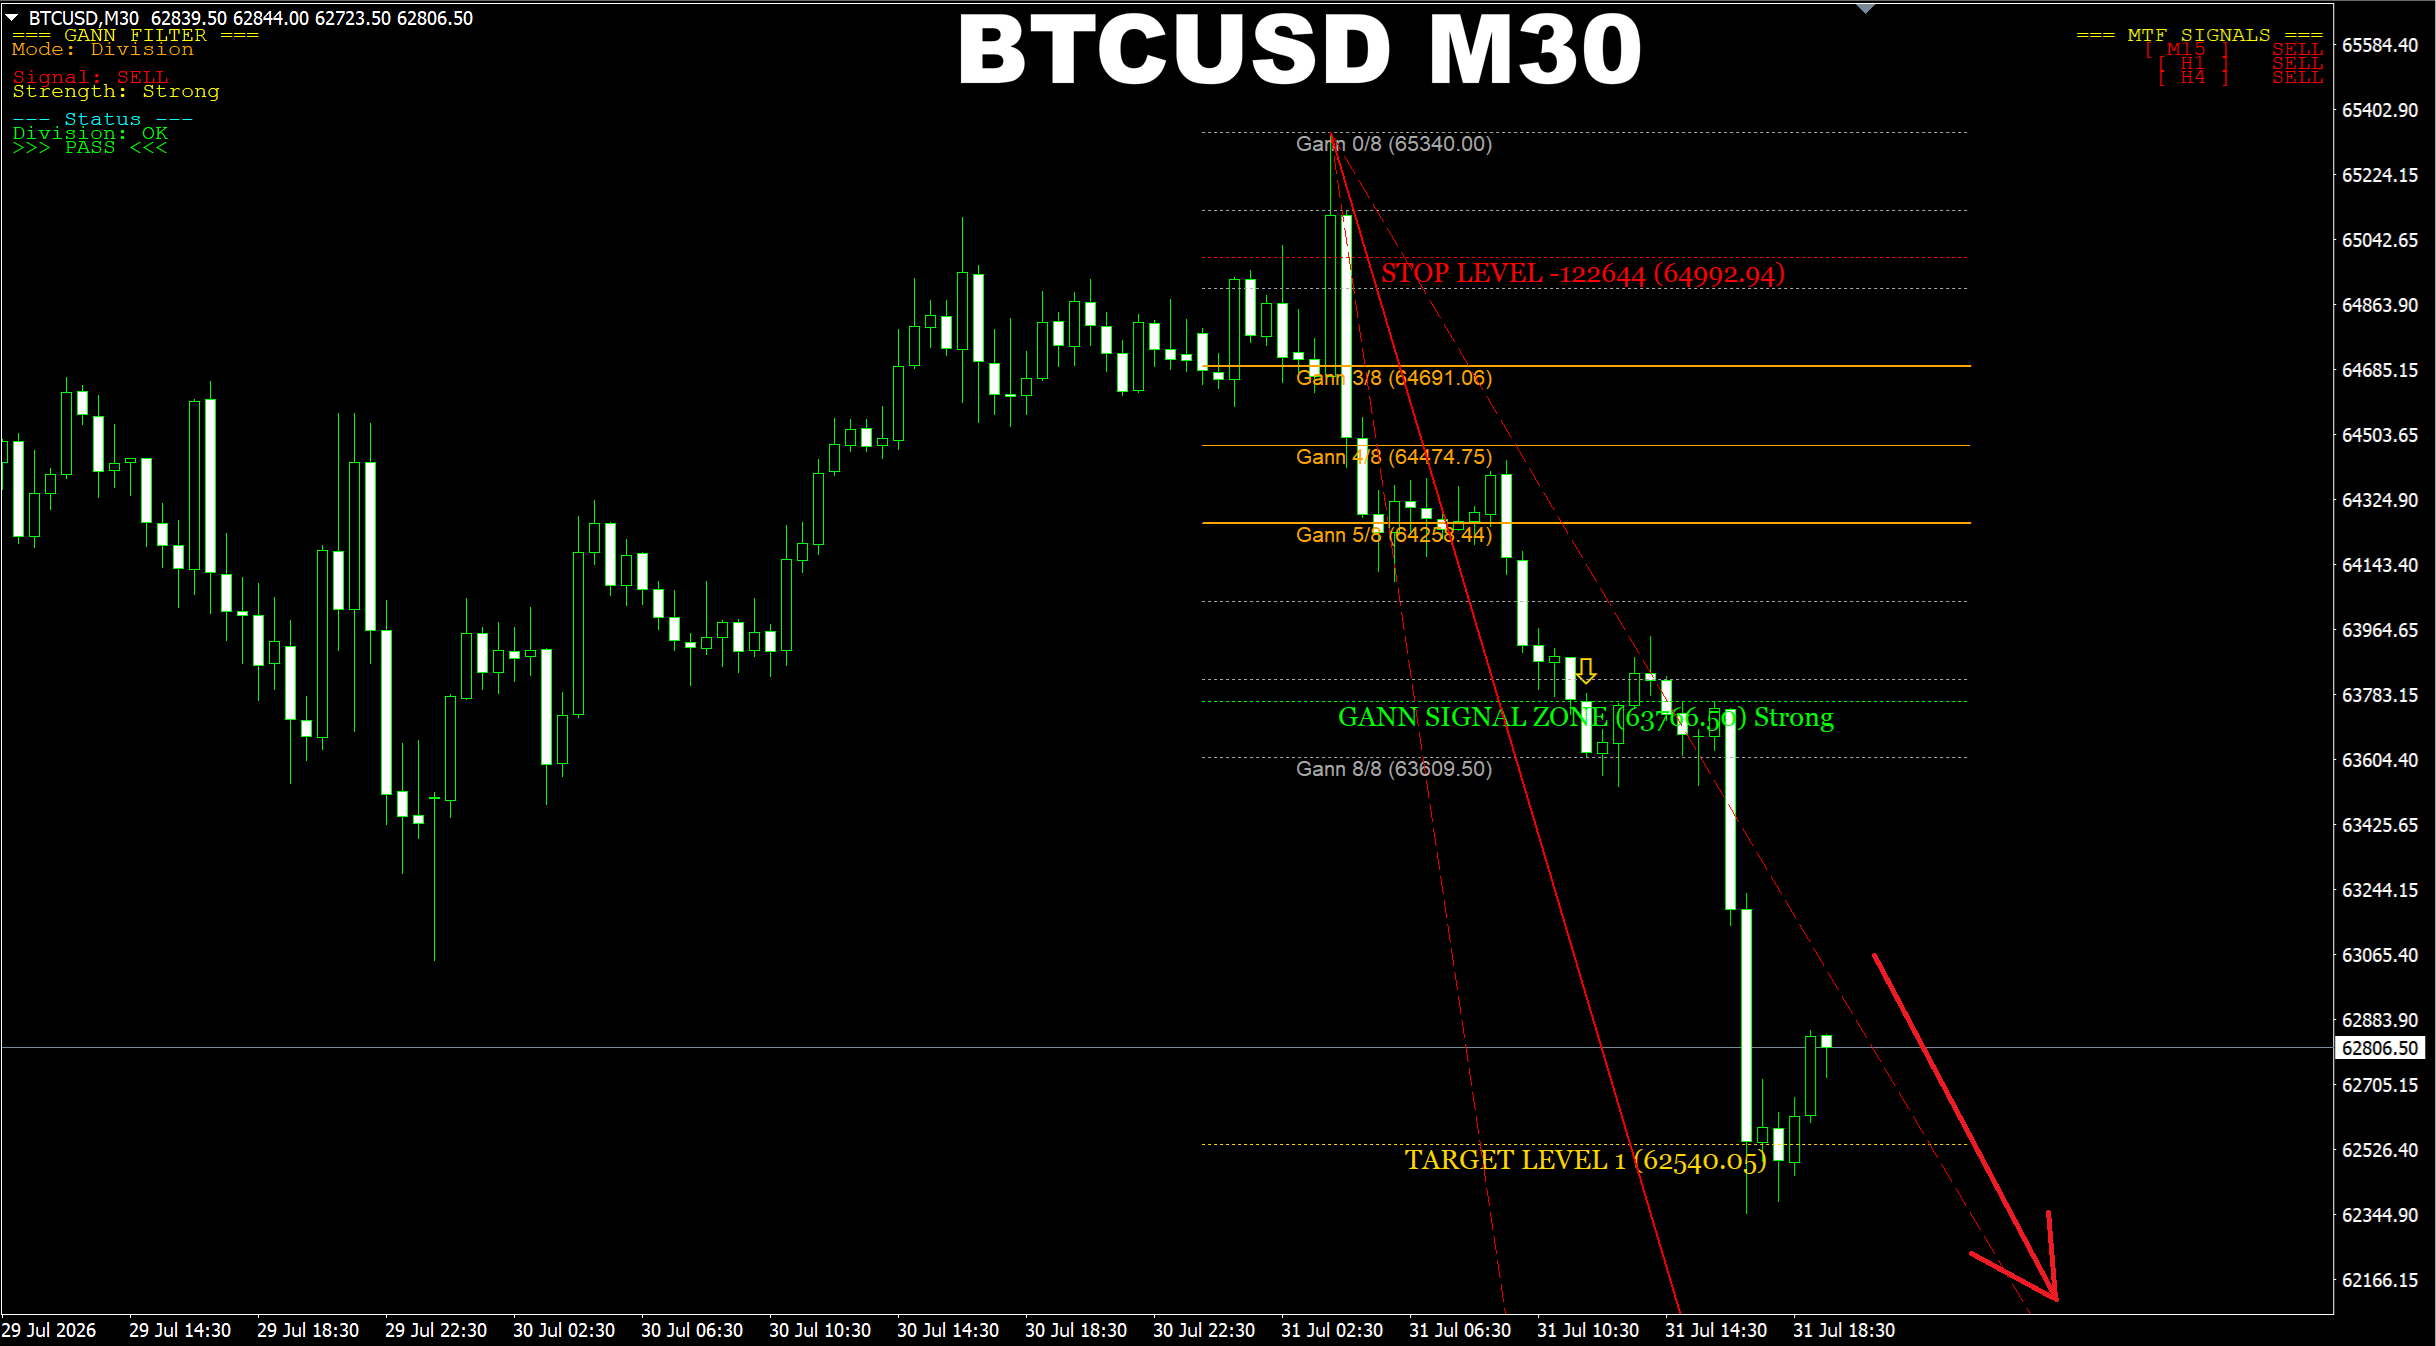
Gann Made Easy. BTCUSD M30. Update on the recent SELL signal. Price has reached the main target. But when current pullback is over, the price will go lower, probably to 61.8K area.
소셜 네트워크에 공유 ·
3
Oleg Rodin
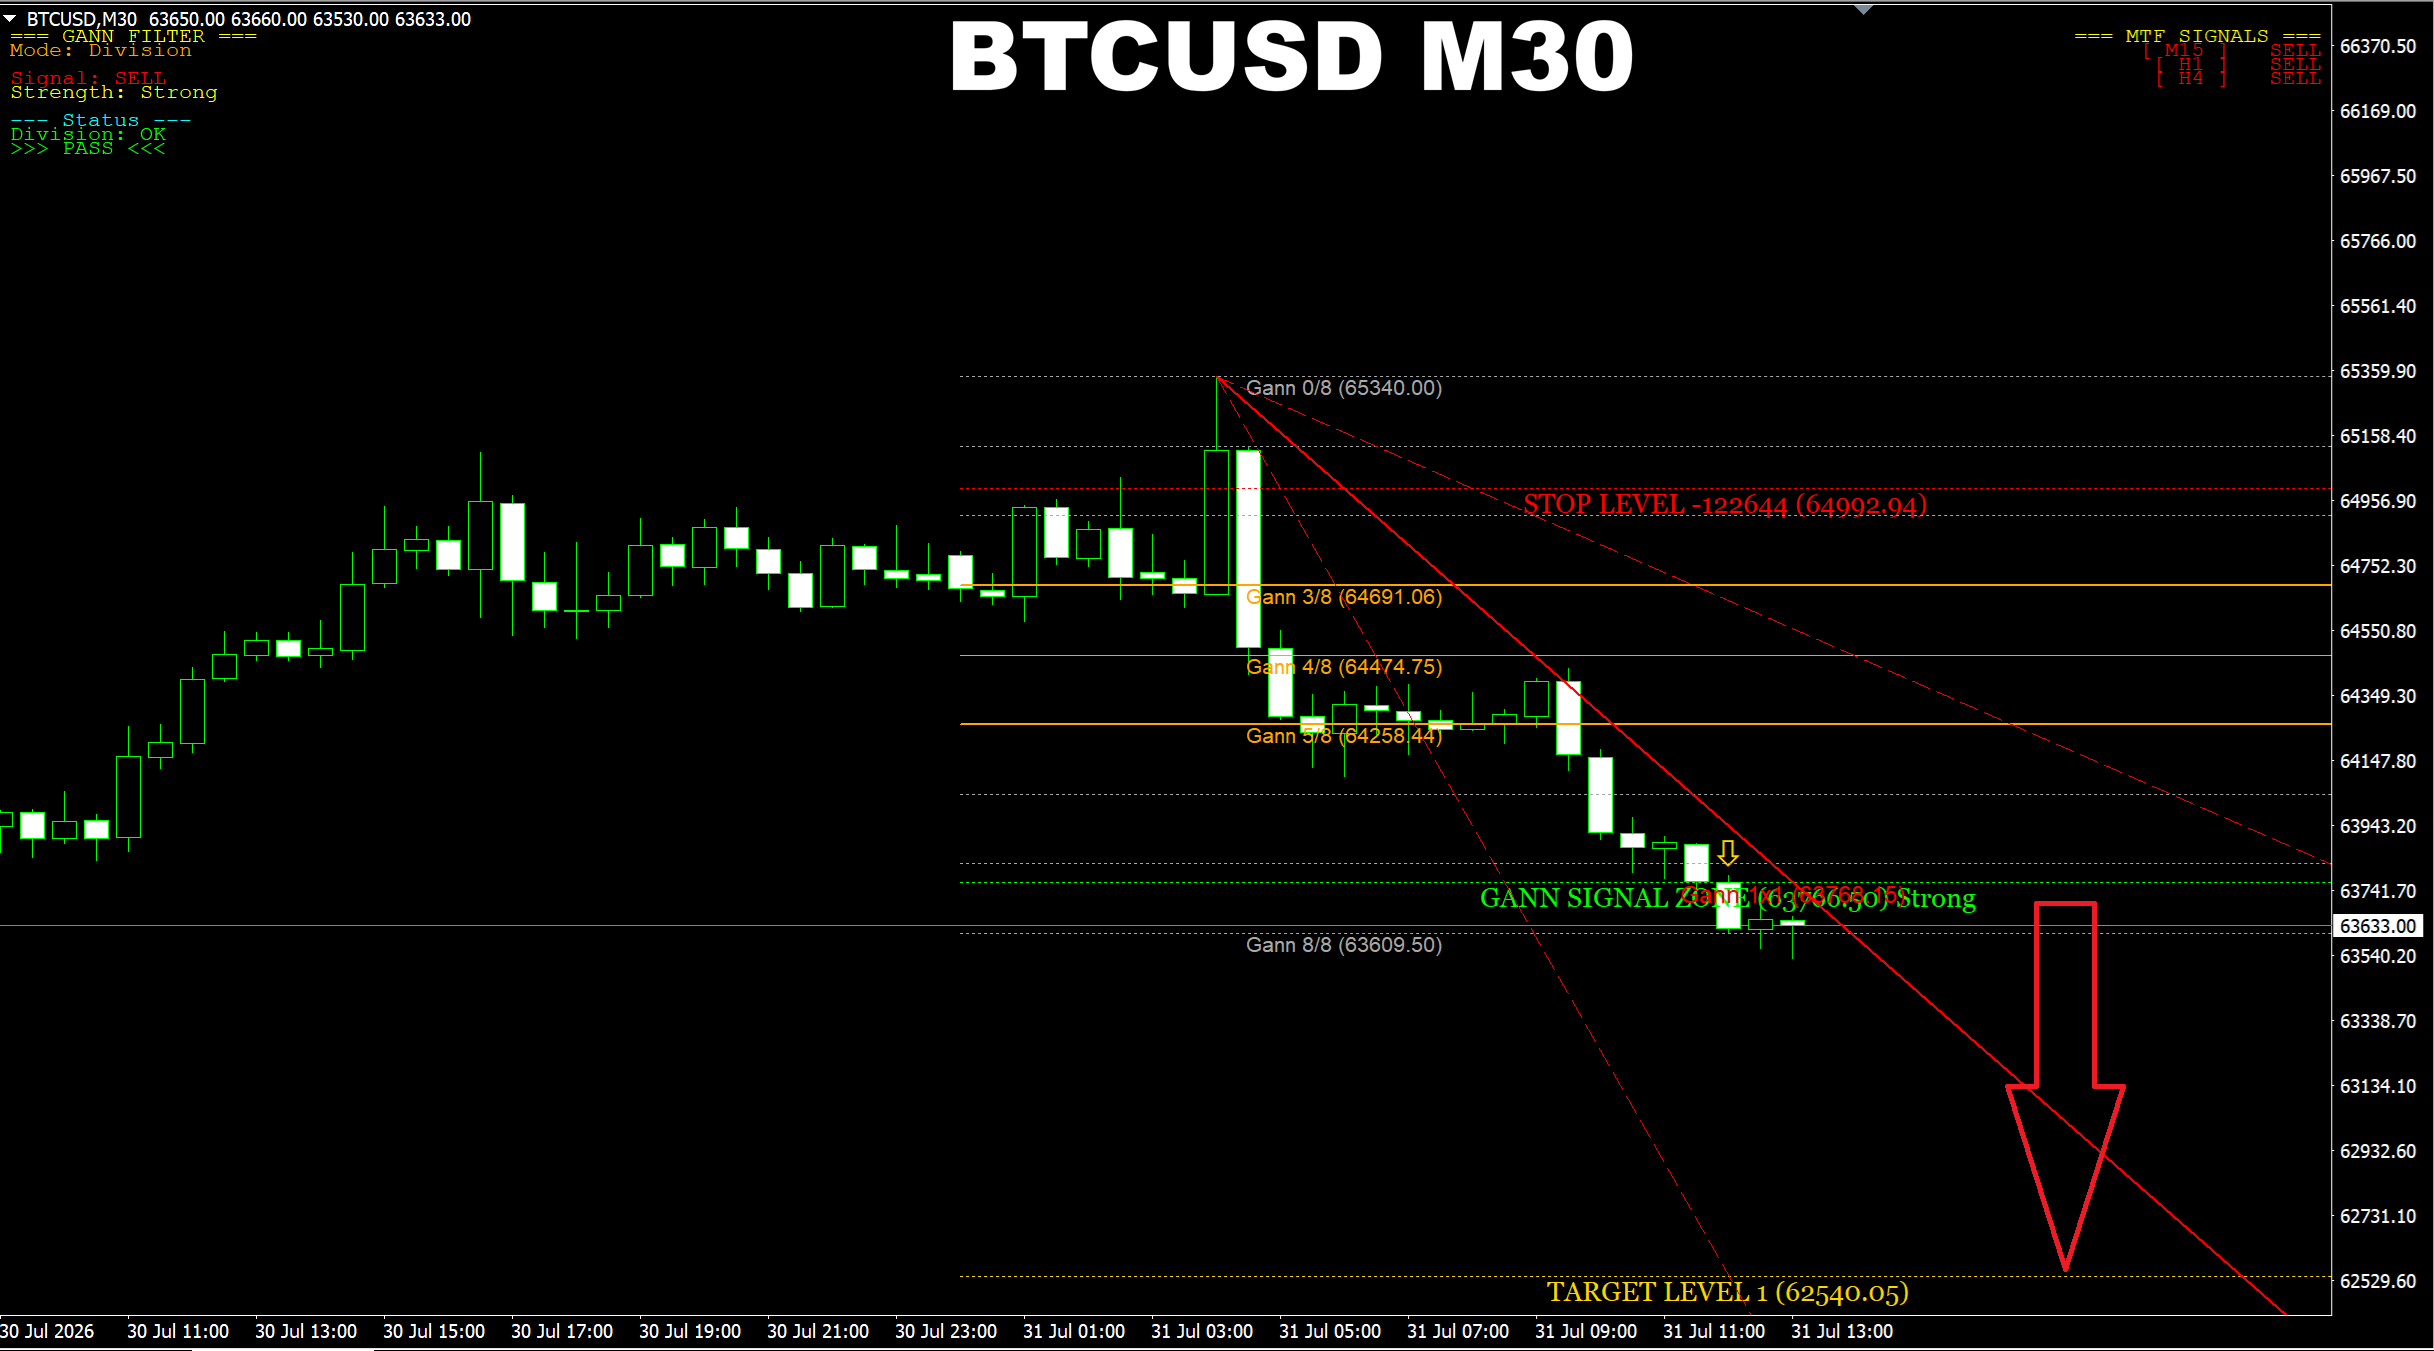
Gann Made Easy. BTCUSD M30. Watch for Gann 8/8 area. If the price breaches it, the chance is high we will the price going down toward the TP1 area.
소셜 네트워크에 공유 ·
4
Oleg Rodin
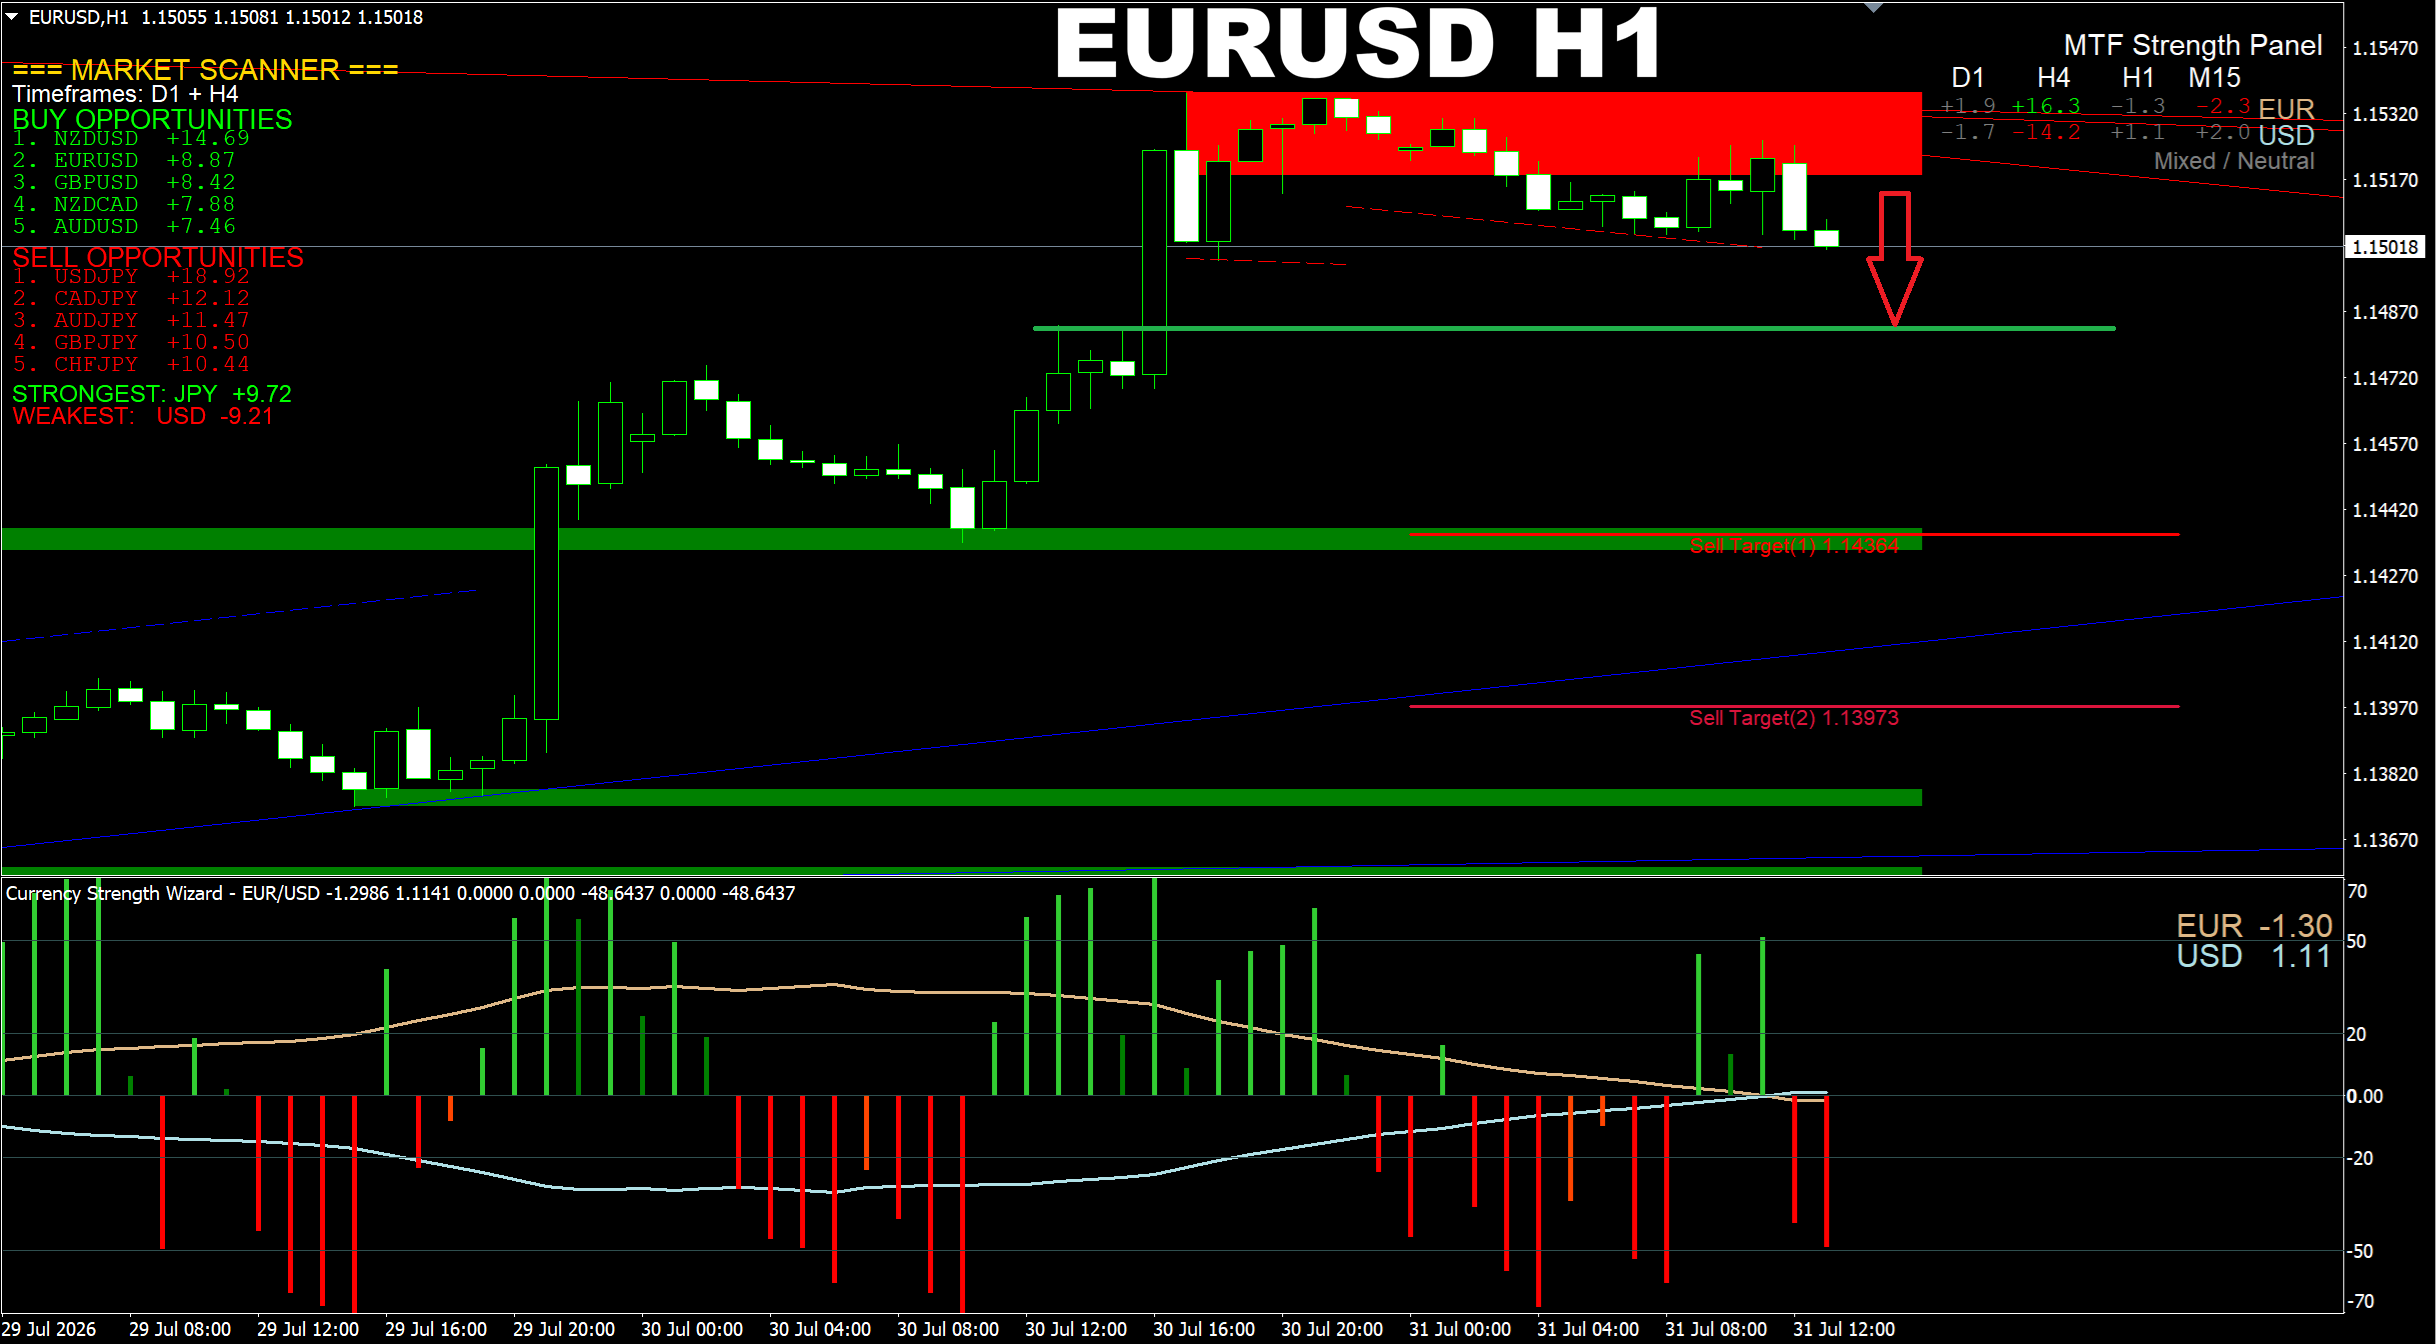
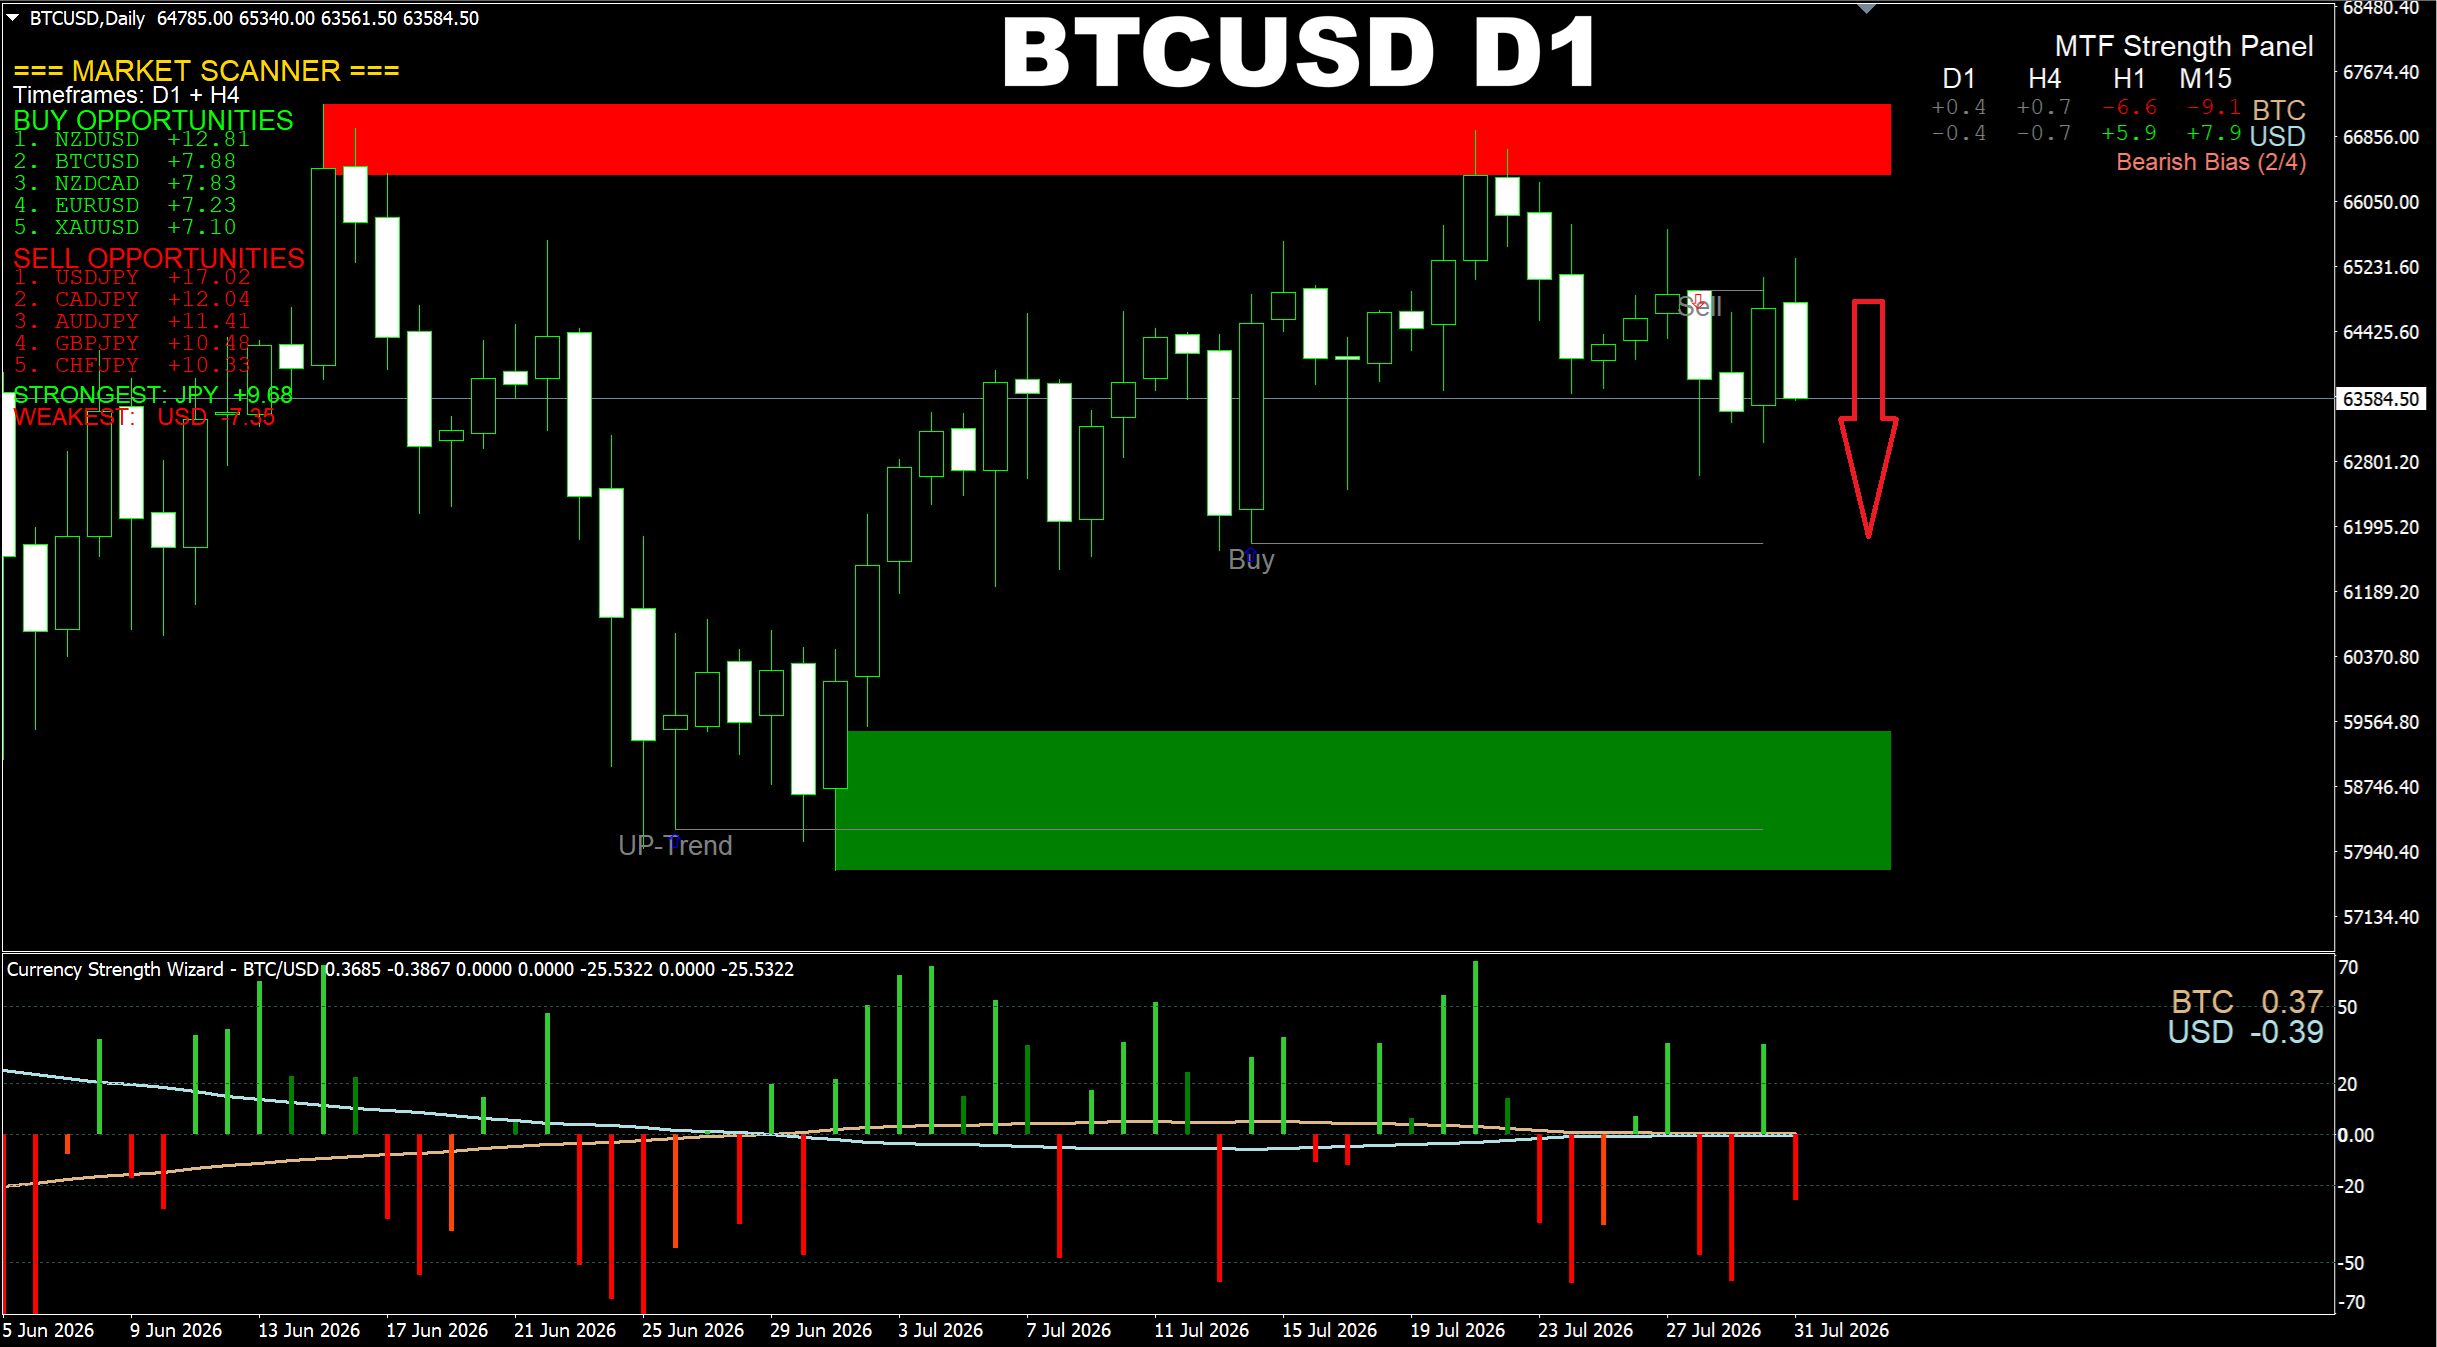
Currency Strength Wizard. BTCUSD D1. Update on current market. We have a selling wave toward Support shown by the Buy line in the screenshot.
소셜 네트워크에 공유 ·
4
Oleg Rodin
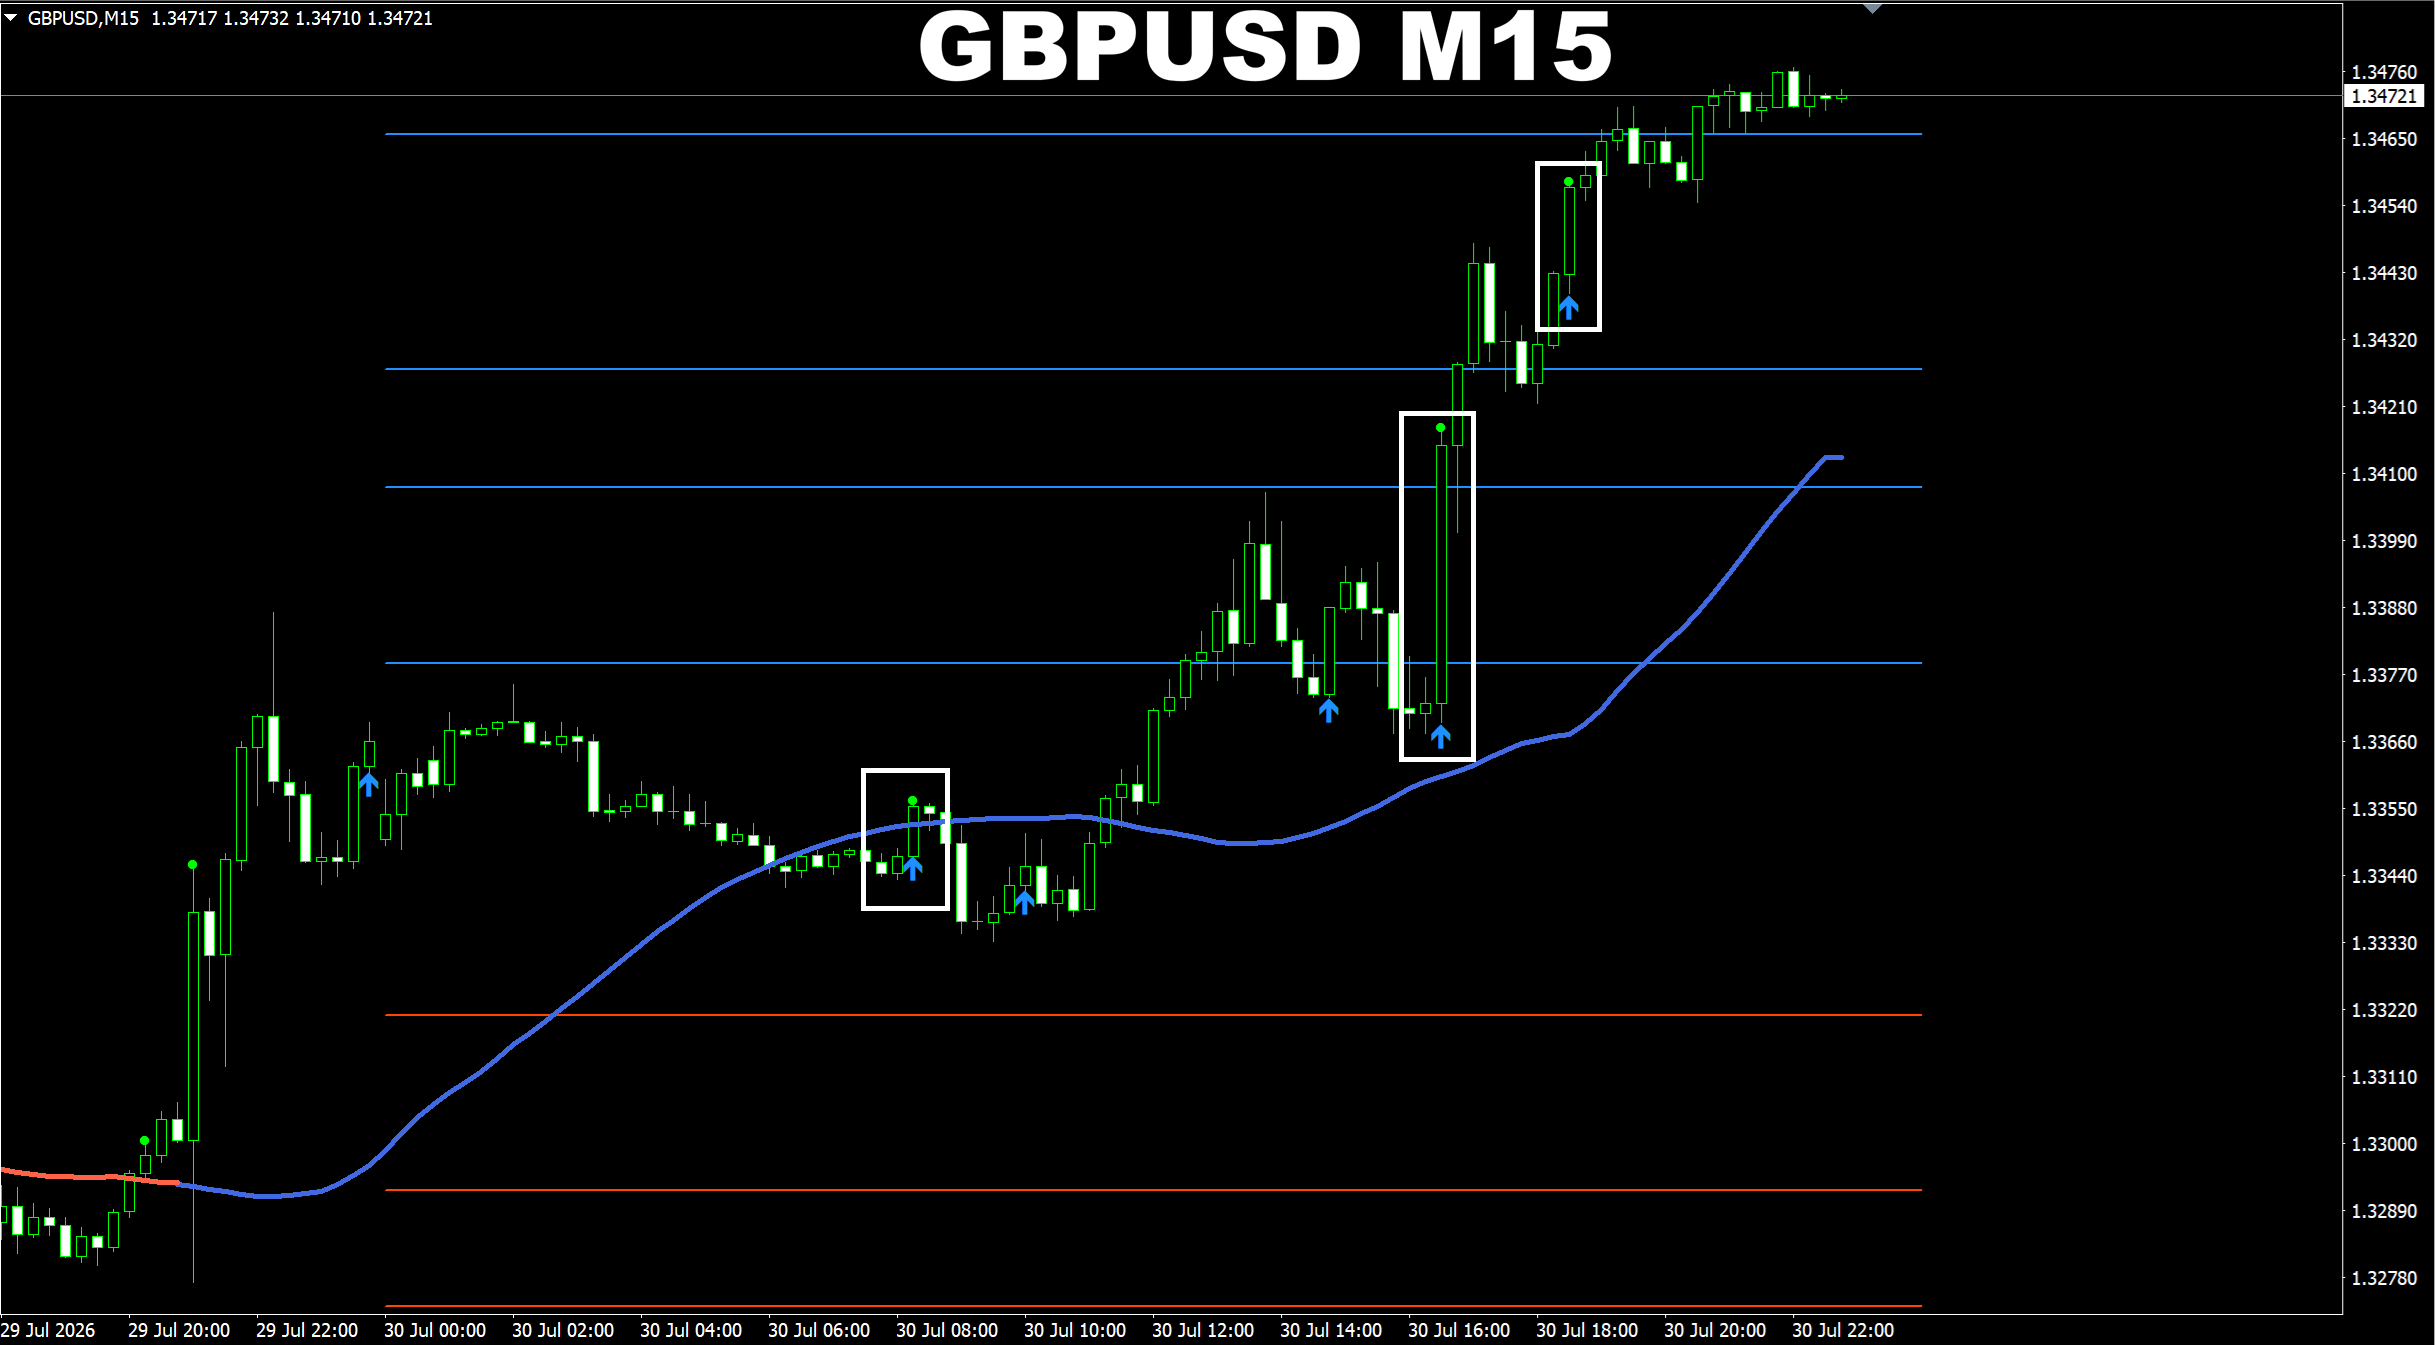
Scalper Vault. GBPUSD M15. I want to show one more example showing the breakout signals type I mentioned in my recent post regarding the ways of trading with the dot signal type. Here I want to show you how easy it is to tell if we have breakout conditions or not. Actually if you have an arrow signal and the dot type signal on the same candle, it means this is a breakout type signal which will probably lead the price in the predicted direction. I hope the tips I share with you here, will be helpful to you in real trading.
소셜 네트워크에 공유 ·
4
Oleg Rodin
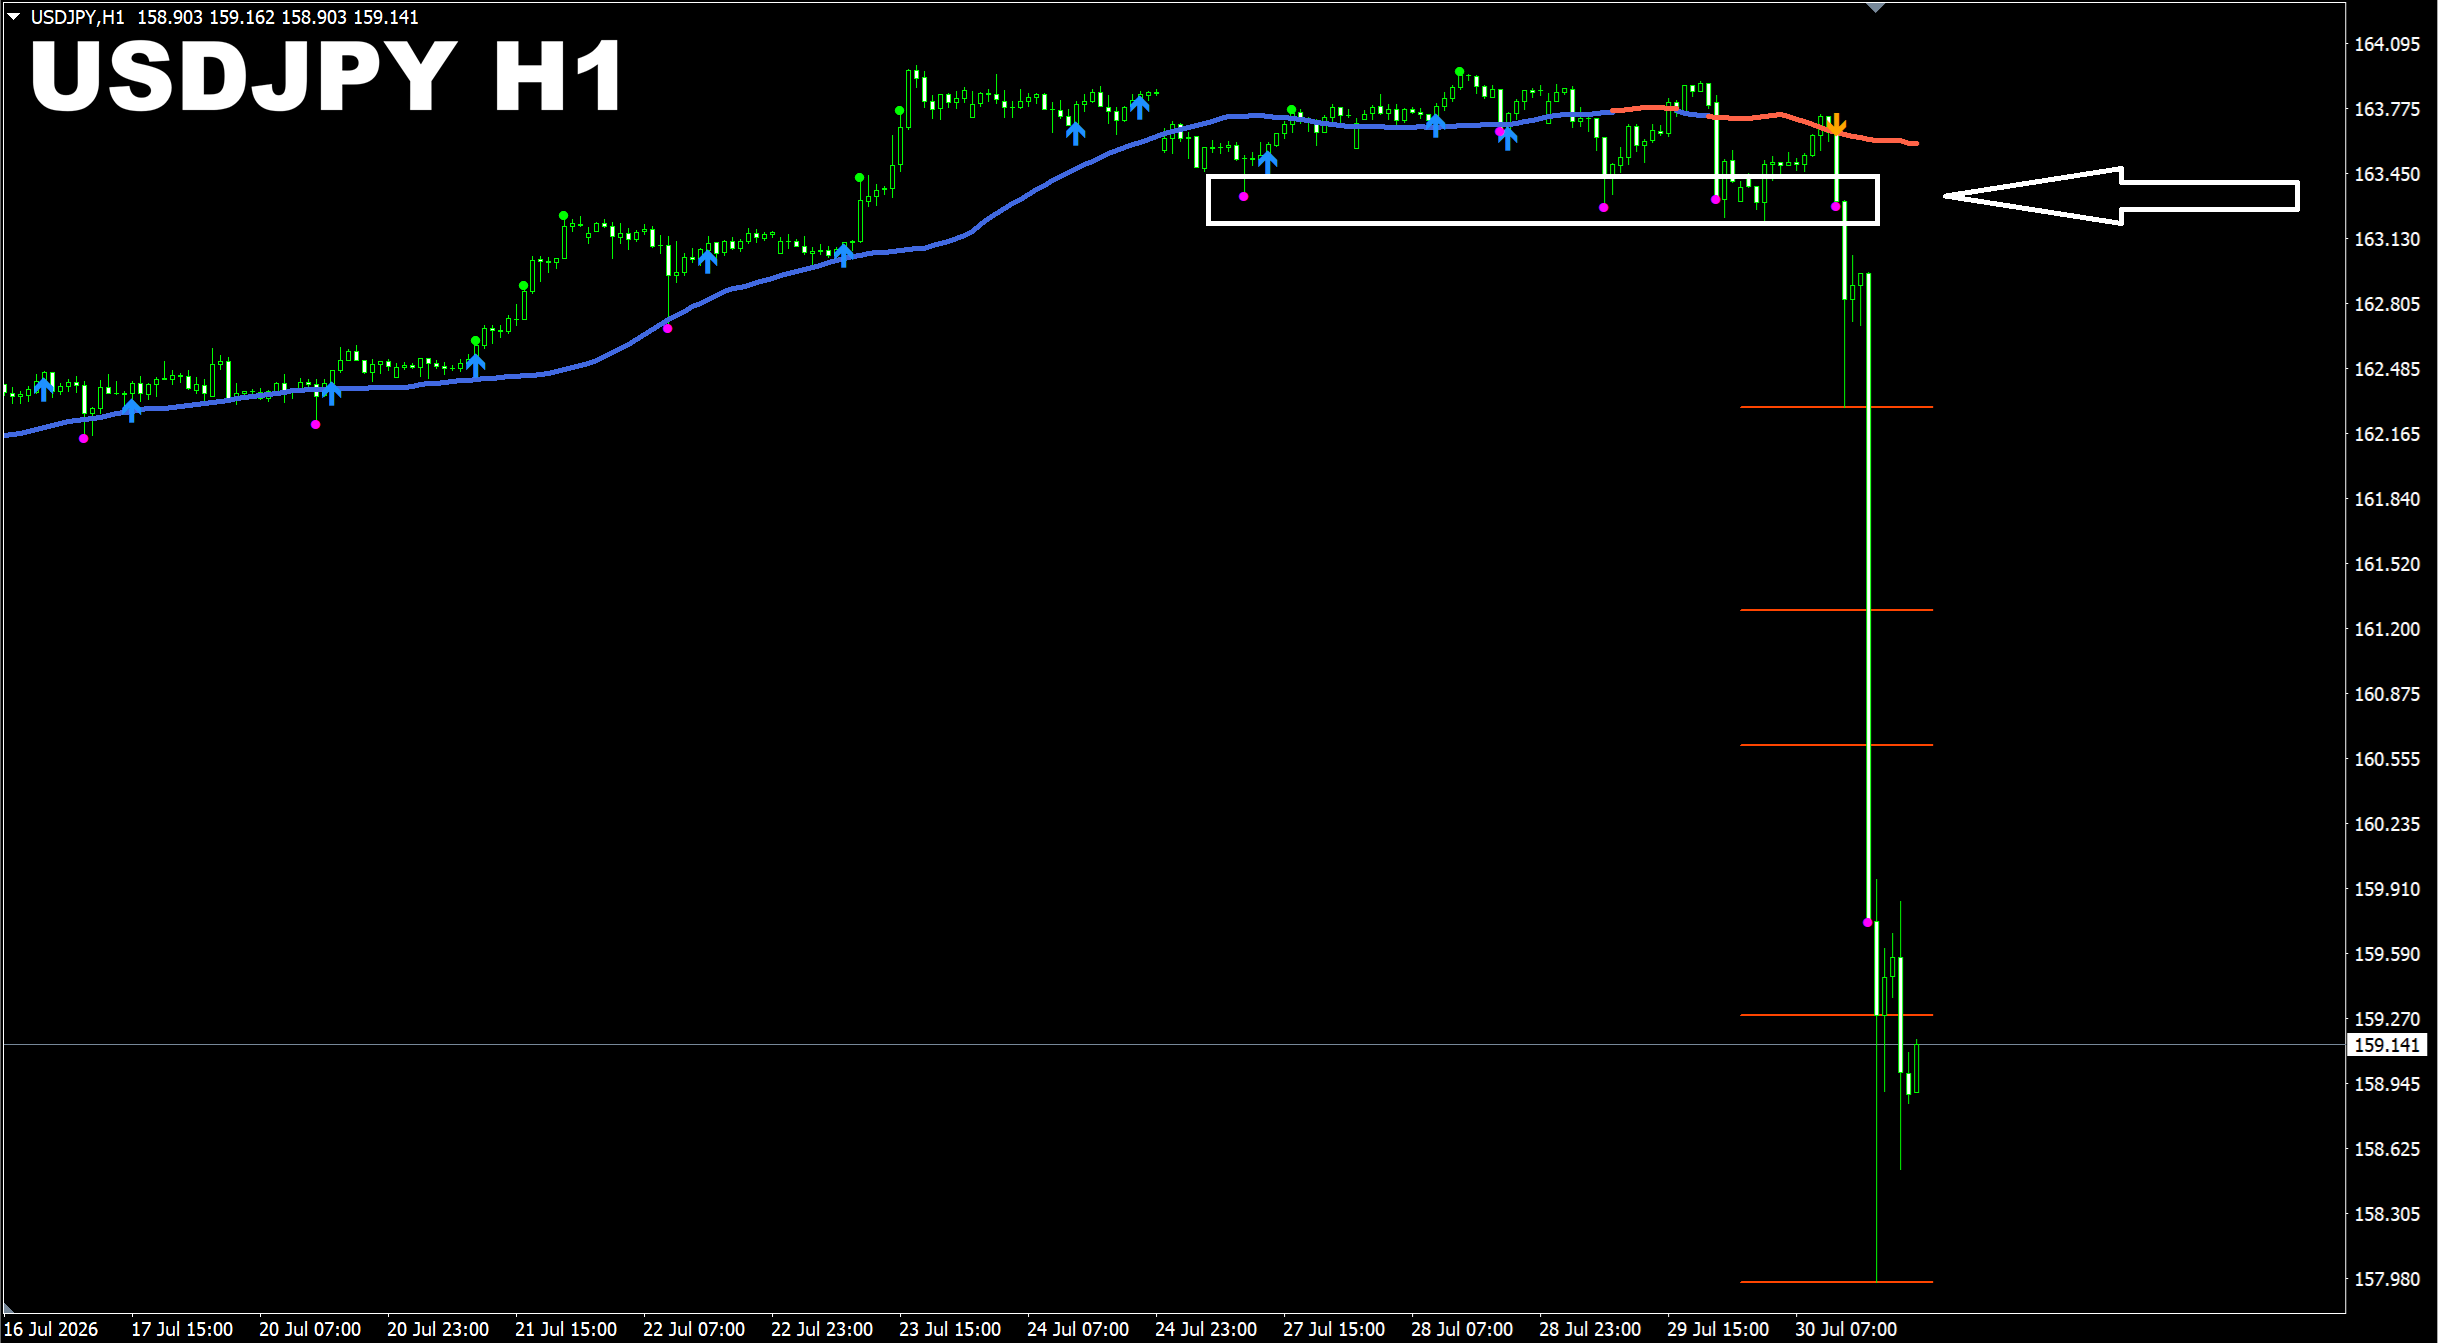
Scalper Vault. USDJPY H1. I would like to show you how the dot type signal in the indicator can be helpful for us to detect breakouts. This info will be helpful to all users of the indicator. If you're a user of this indicator, you already know that we can work with such signals using different techniques where they can be helpful for exit and even entry. But such signals can also be used to detect breakouts. If you see a series of dot signals like I've just shown in the screenshot, it means we have a clear Support area there (based on this example). When we start noticing the trend line to change its color, it will be the sign that the price may break that area. But the moment of breakout is the situation when price breaks the area shown by the dot signals. And this will be a confirmed breakout for us which we can use for a SELL entry, especially if we have the signal arrow and the dot signal on the same candle.
소셜 네트워크에 공유 ·
2
Oleg Rodin
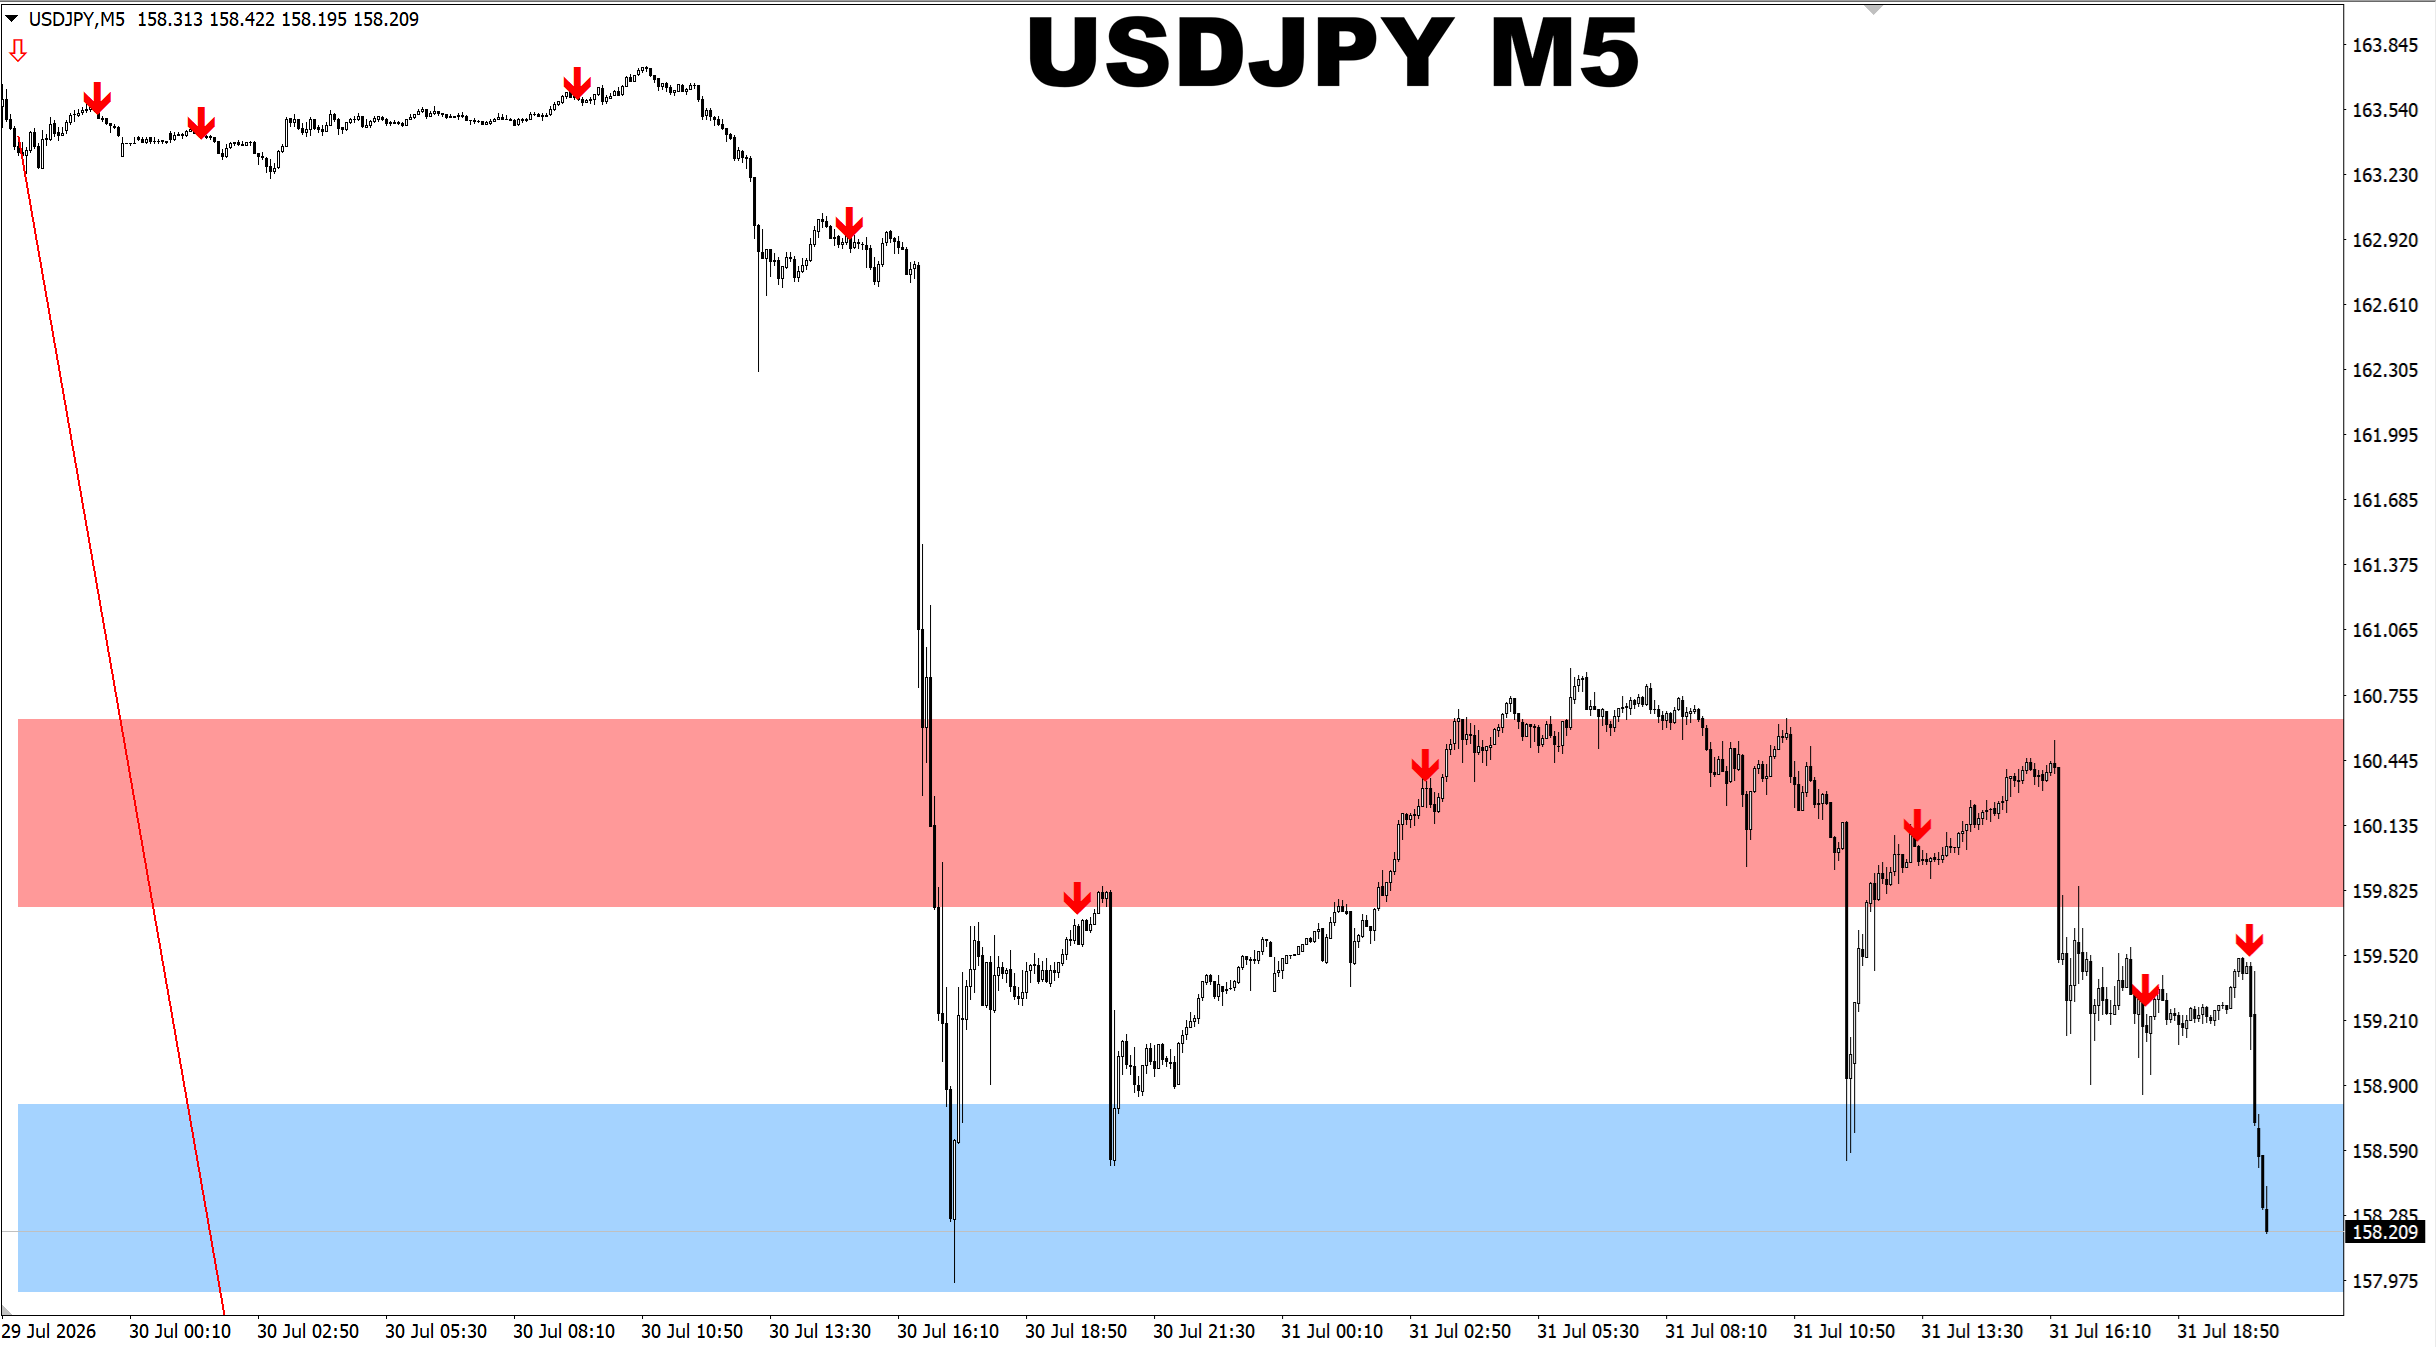
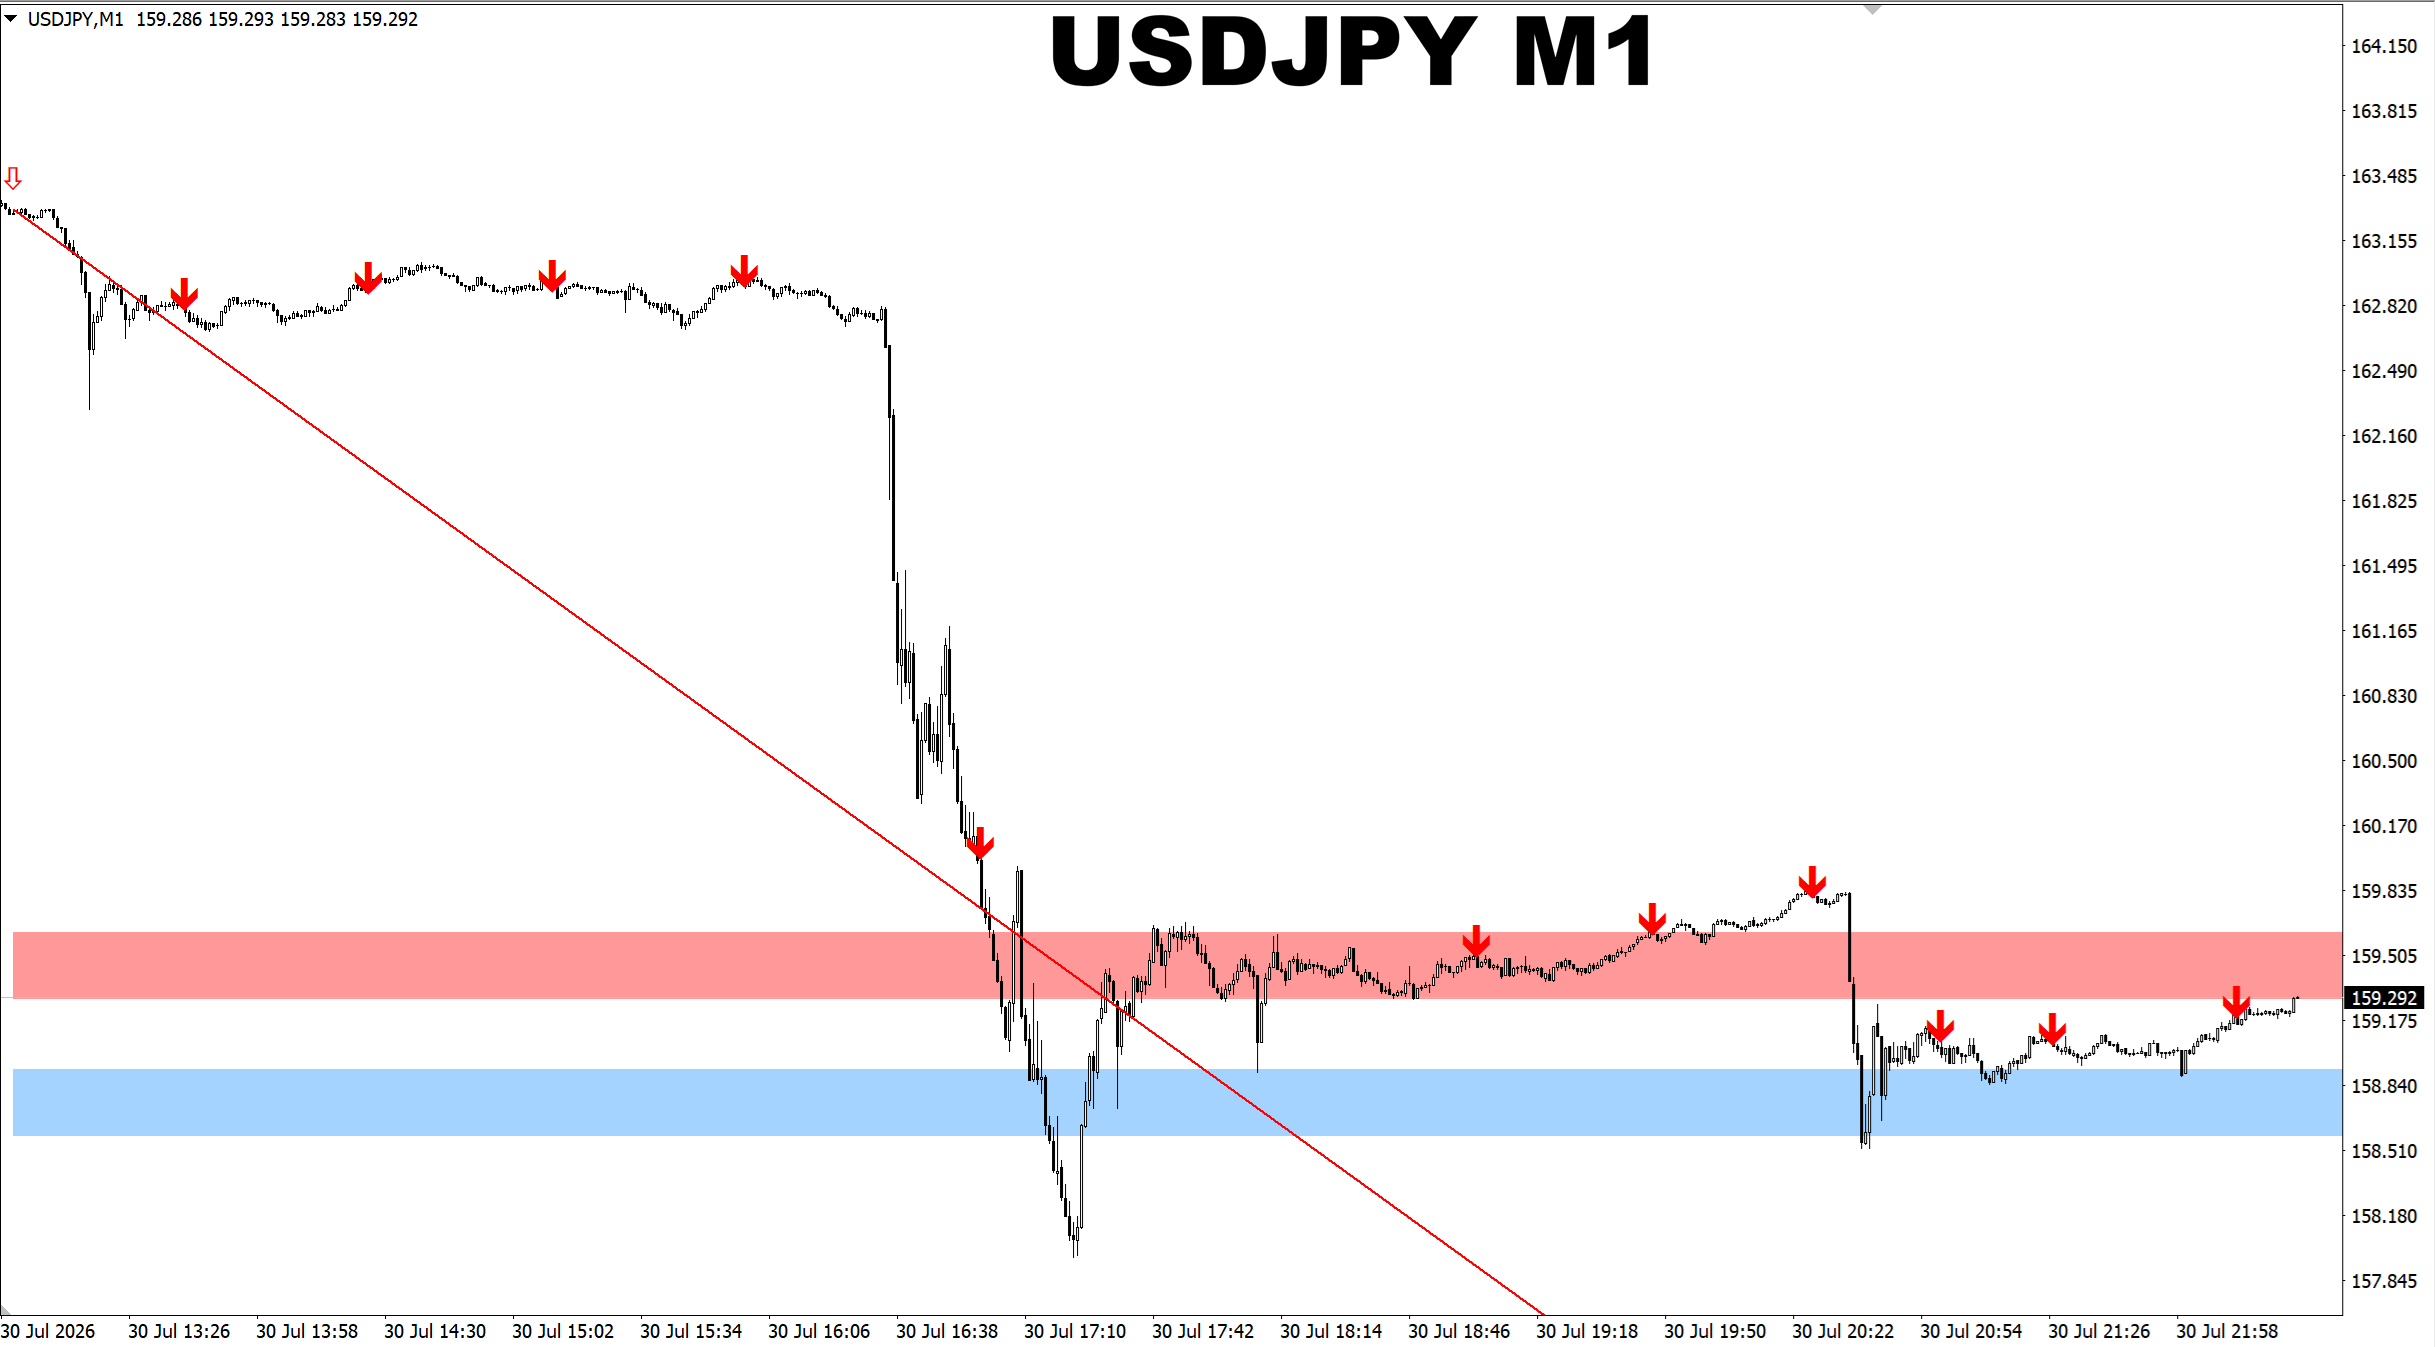
SR Liquidity. USDJPY M1. Default Mode 3. Confirmed patterns only. A new opposite pattern still has not been provided, it means the selling pressure is still there.
소셜 네트워크에 공유 ·
3
: