Ivan Stefanov / Profilo
- Informazioni
|
9+ anni
esperienza
|
32
prodotti
|
61
versioni demo
|
|
0
lavori
|
0
segnali
|
0
iscritti
|
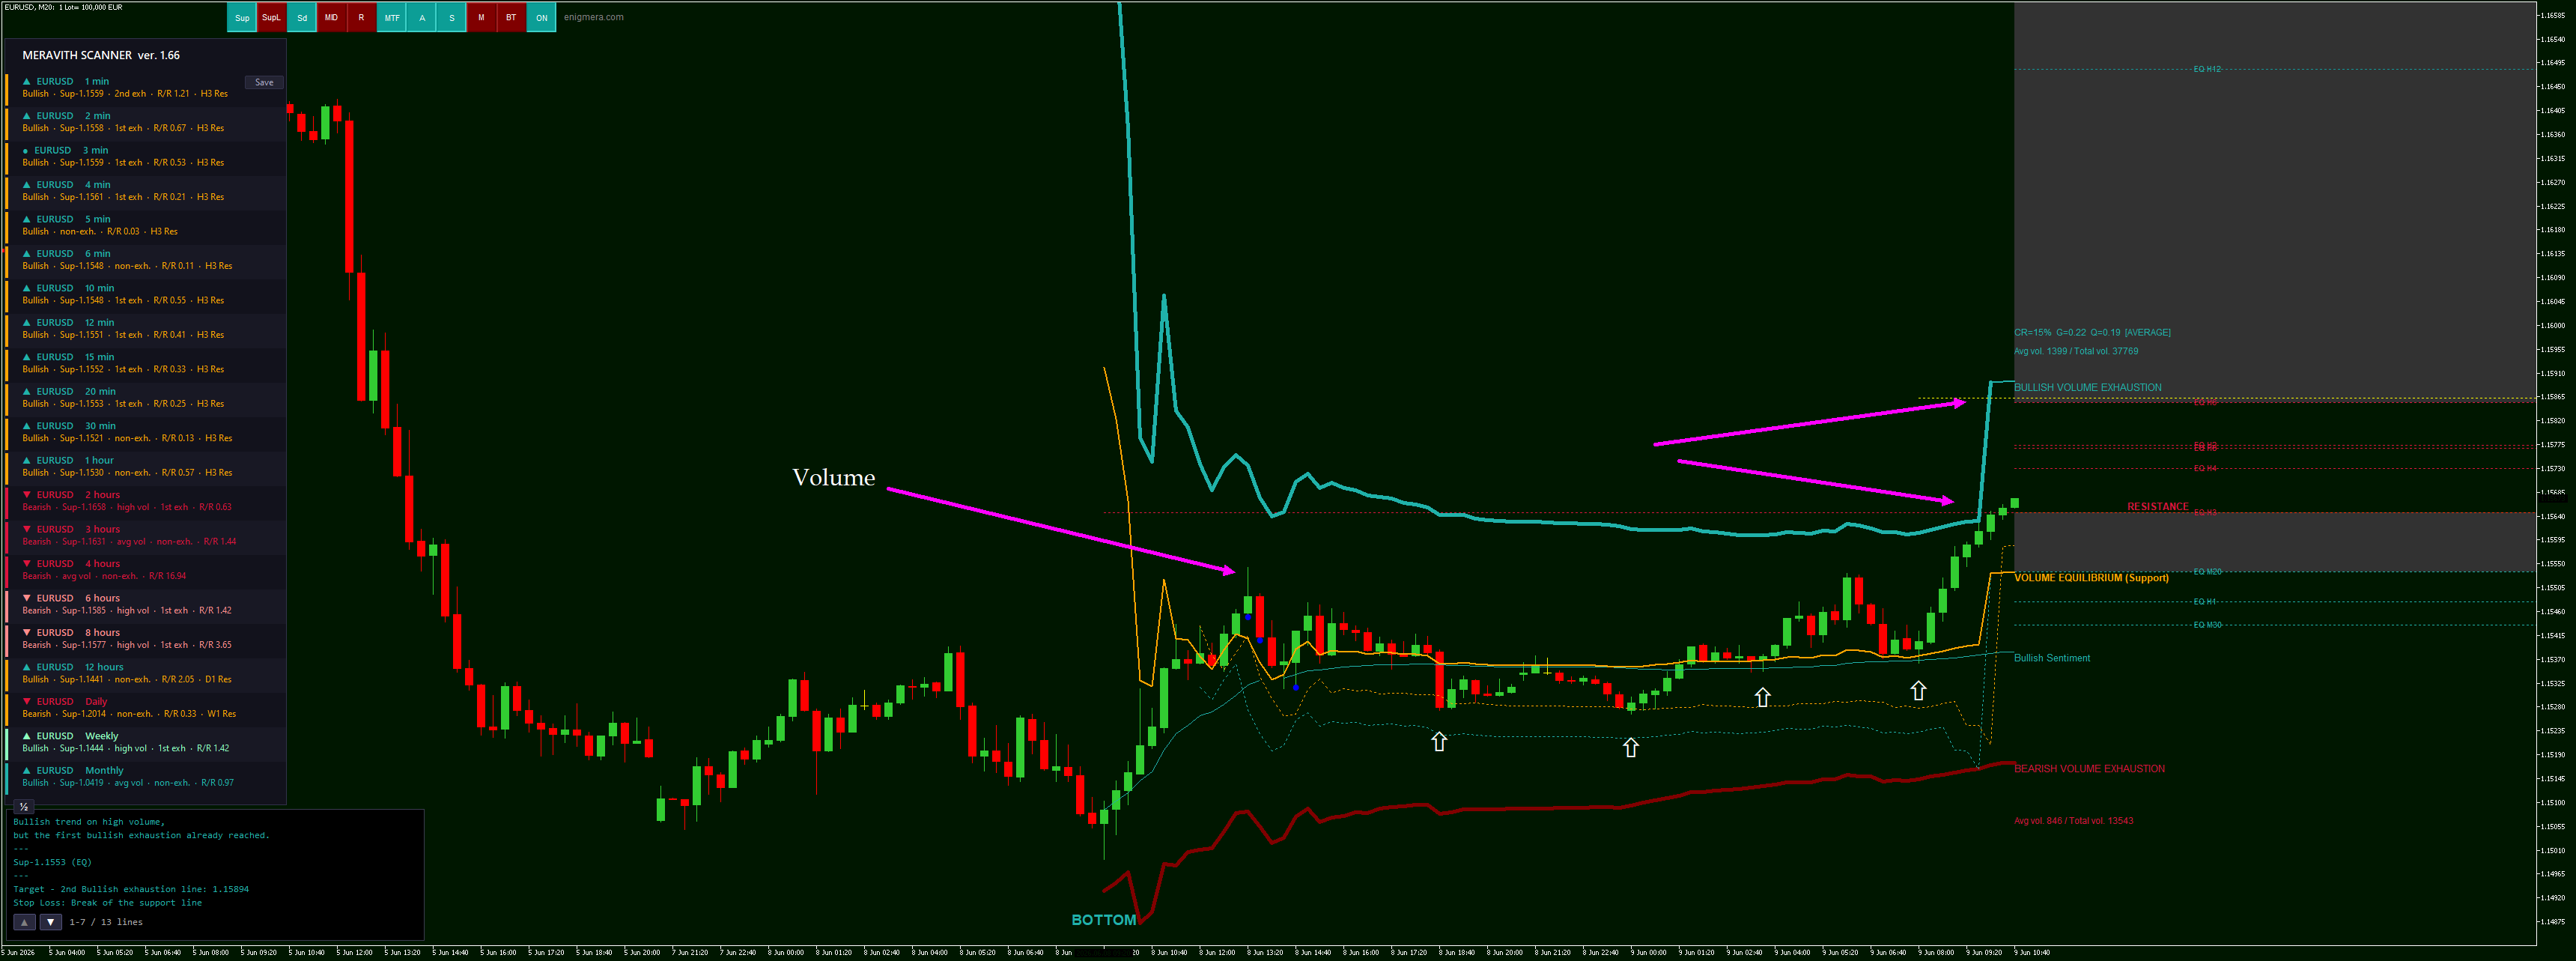
Later on broke up again over equilibirum. Tested the equilibirum twice and rocket up to the upper border of the liquidity pool.
It is like a textbook example.
Good luck!
Significant bullish volume was mentioned over the volume equilibirum line.
The correction to the bearish deviation line followed after that in order the bullish orders to be opened.
After that the market exploded up to the closest LIQUIDITY POOL.
The liquidity pool made between bullish and bearish liquidity lines by diffent time frames. In our case
this is bullish liquidity on 12h and bearish 8h. The distance between them made the closes liquidity pool.
Another one higher.
Profits collected.
TIMES aggiunge la dimensione temporale alla tua analisi. È il terzo elemento di una trinità di trading: Meravith mostra il prezzo equo, TransactionSpeed mostra il volume equo, e TIMES mostra in quale momento l’attività di mercato si concentra — rivelando se il momentum si sta costruendo o indebolendo. Cosa traccia: le zone (rettangoli) Invece di riempire il grafico con linee, TIMES condensa la sua analisi in rettangoli colorati disegnati direttamente sul grafico dei prezzi. Ogni rettangolo
RSI Divergence Pulse is an RSI-based indicator for MetaTrader 4. It detects regular and hidden divergences, draws them on the price chart and in the RSI subwindow, shows RSI values from five timeframes in one panel, and reports the current RSI state in an information panel. Alerts can be sent when a divergence is confirmed. How it works The indicator calculates a standard RSI and a signal line, which is a simple moving average of the RSI. Significant RSI highs and lows are located with a
RSI Divergence Pulse è un indicatore RSI completo che combina rilevazione di divergenze, analisi multi-timeframe e strumenti visivi in un'unica applicazione leggera. Identifica automaticamente divergenze Regolari e Nascoste, mostra un pannello RSI Multi-Timeframe in tempo reale, riempie le zone OB/OS per il riconoscimento visivo, disegna linee di divergenza sia sul grafico dei prezzi che nella sott finestra RSI, posiziona frecce Buy/Sell e fornisce avvisi in tempo reale. Features Color-Coded
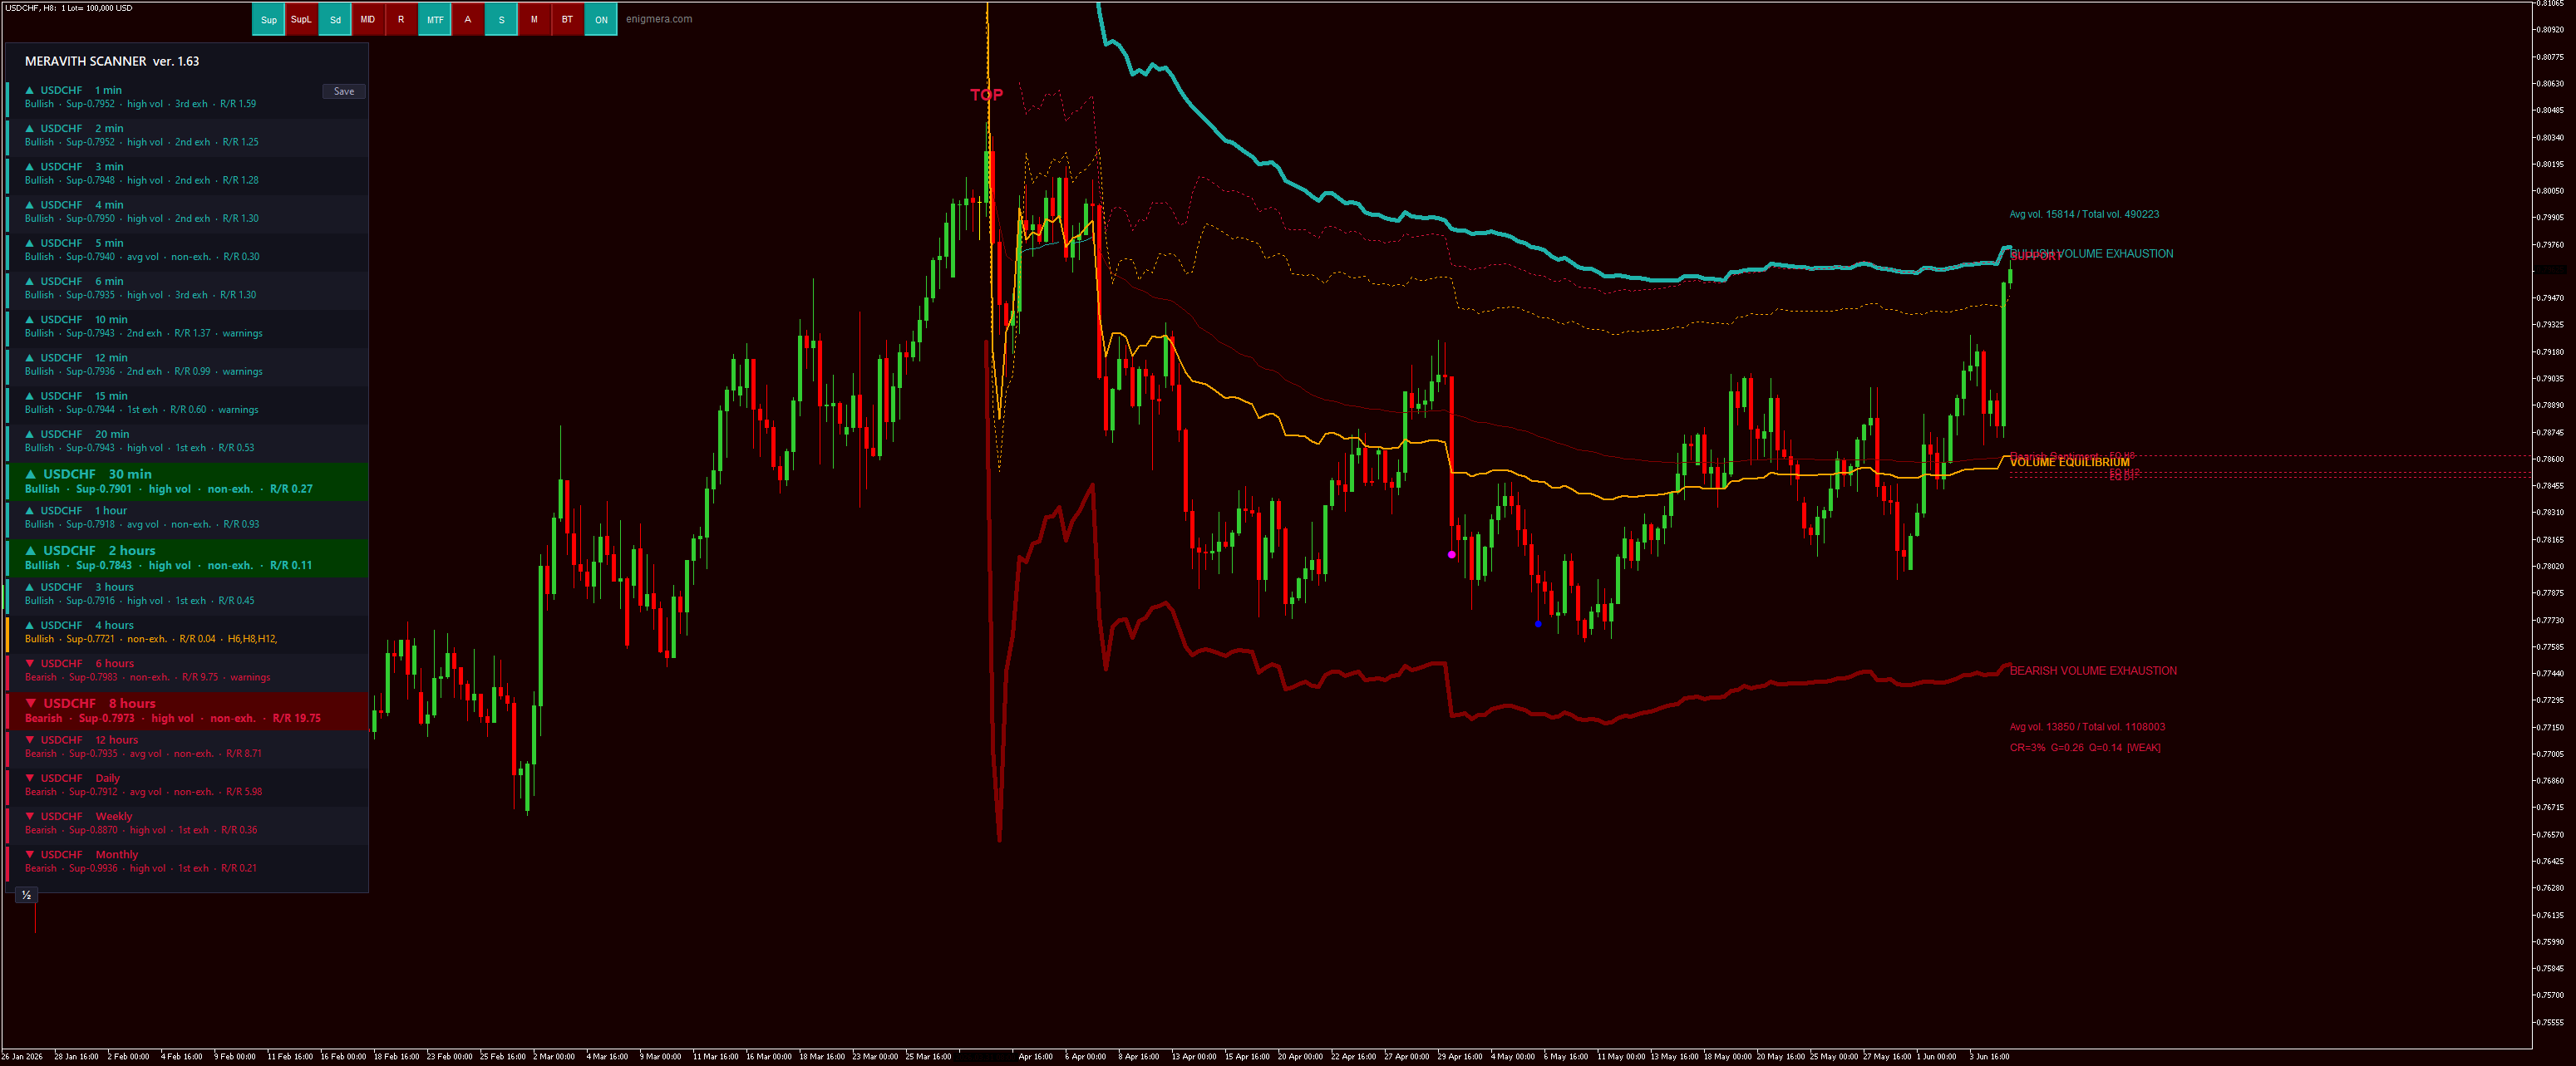
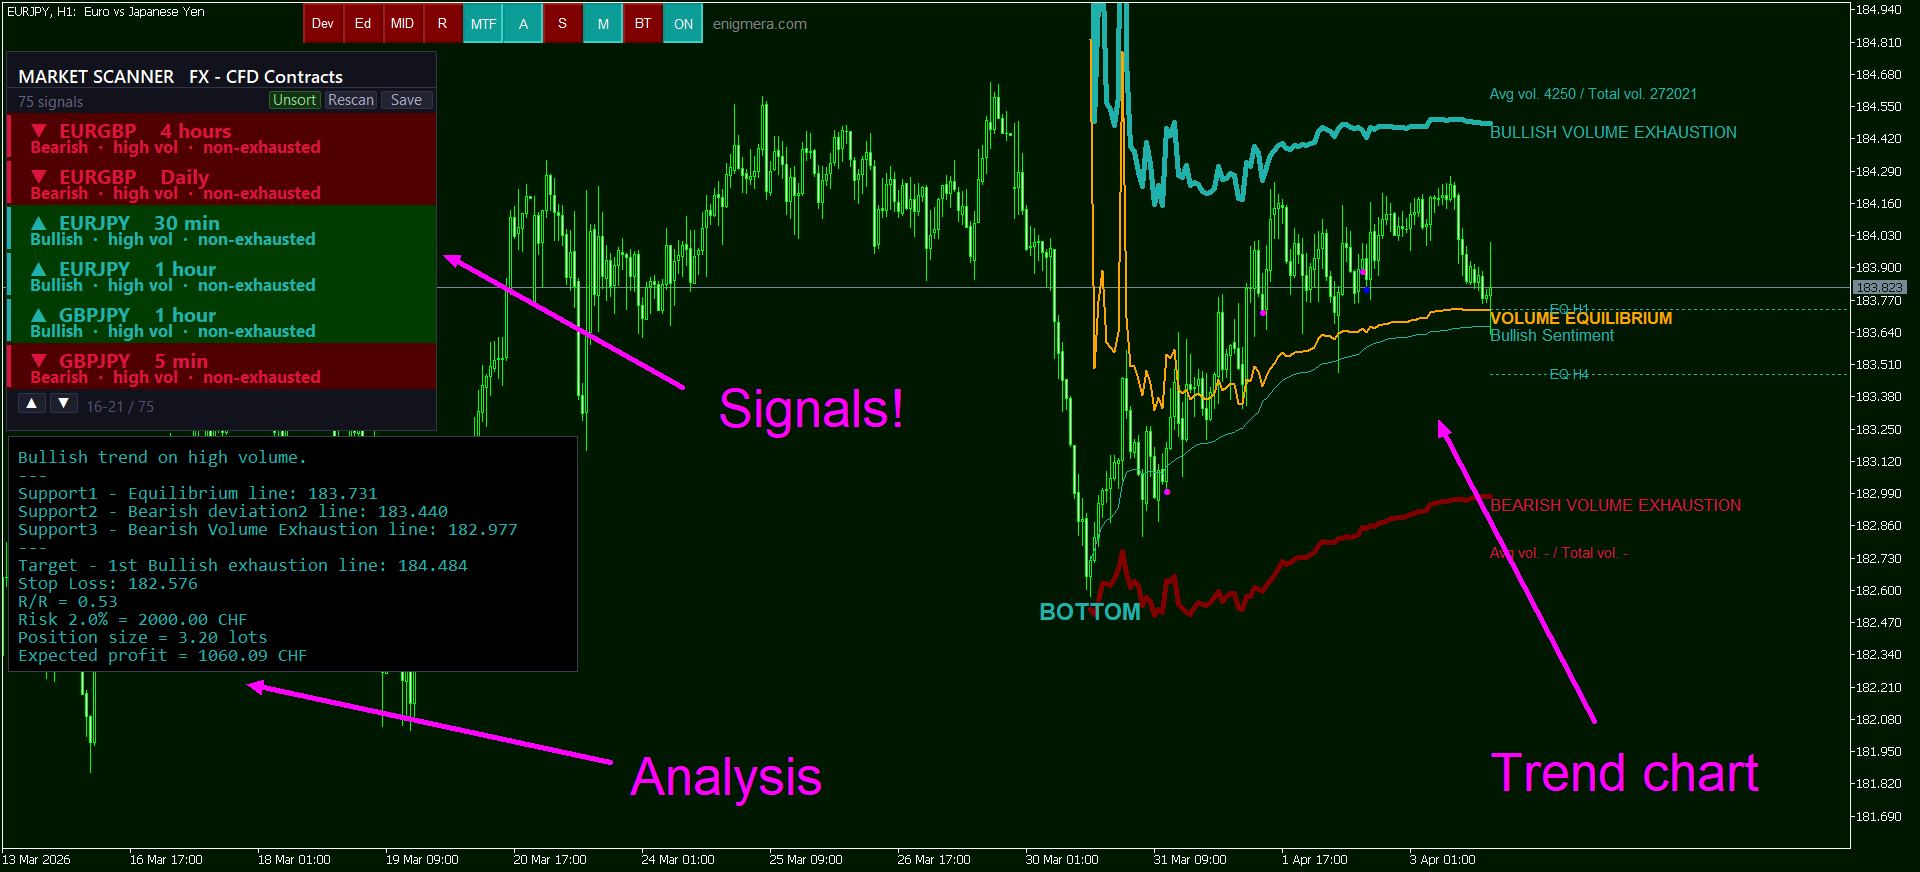
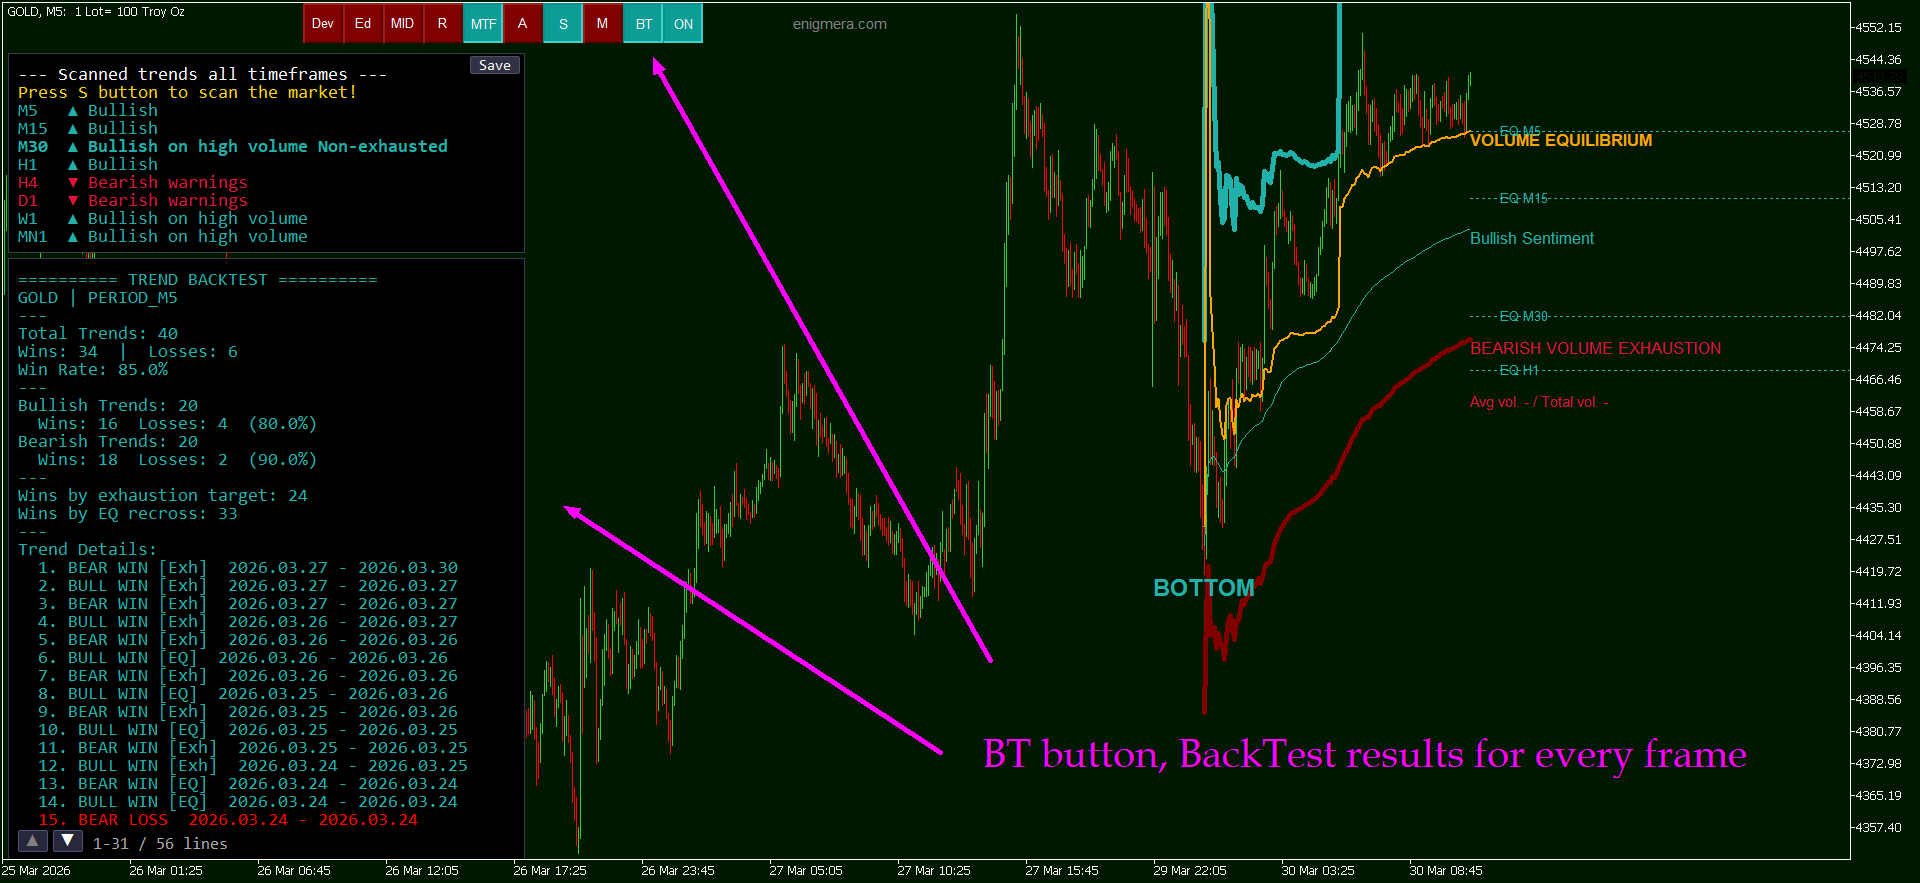
MERAVITH SCANNER è un indicatore professionale per i mercati finanziari su MetaTrader 5, che integra più strumenti di analisi in un unico sistema. Esegue tutti i calcoli automaticamente utilizzando una metodologia proprietaria basata sul prezzo medio ponderato per il volume (VWAP), eliminando completamente l’interpretazione soggettiva. L’indicatore funziona su tutte le classi di asset (Forex, Azioni, Indici, Commodities, Criptovalute) e su tutti i timeframe, da M1 a Mensile. Il principio
Oscillatore di momentum avanzato che regola automaticamente il suo periodo in base alla volatilità del mercato per segnali di ipercomprato e ipervenduto più accurati. Come Funziona: L'indicatore utilizza un calcolo del periodo adattivo che si riduce durante l'alta volatilità e si allunga durante la bassa volatilità. Questa regolazione dinamica fornisce segnali più rapidi quando il mercato è in trend e riduce i falsi segnali durante le fasi di lateralità. Il valore RSI viene calcolato sulla base