Ao Shen / Profilo
- Informazioni
|
2 anni
esperienza
|
6
prodotti
|
40
versioni demo
|
|
0
lavori
|
0
segnali
|
0
iscritti
|
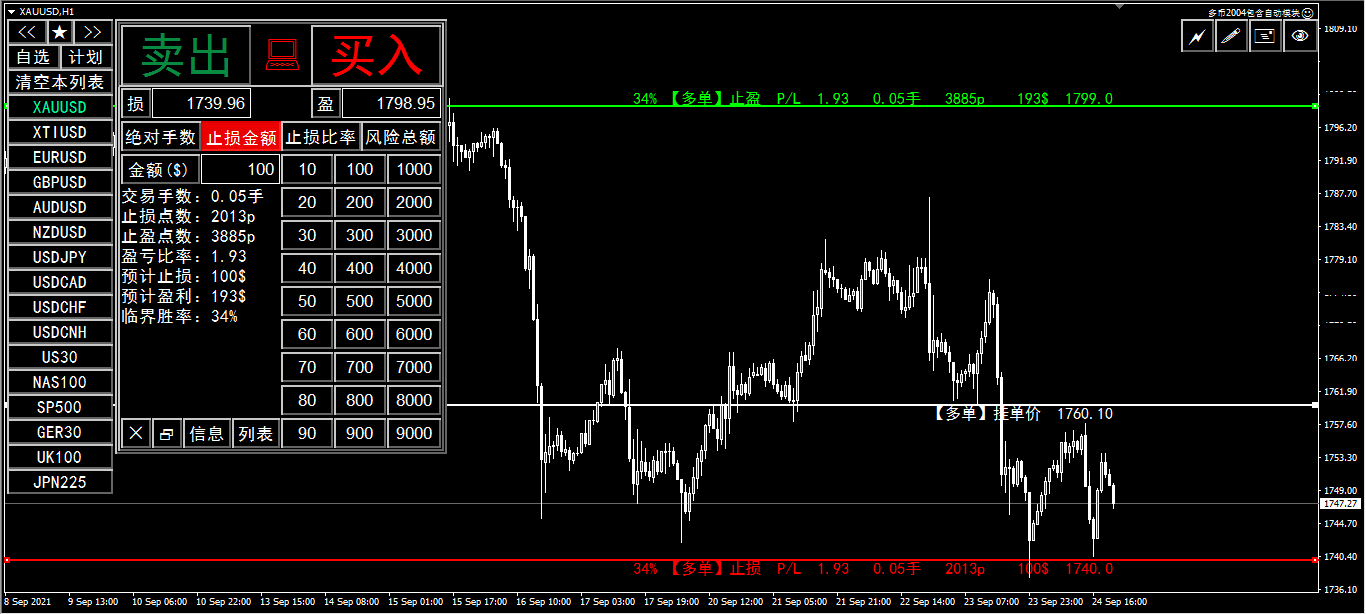
Elenco delle funzioni: Tipo di interfaccia: tipo convenzionale e tipo singolo per spazzole; Il volume identifica tre modalità: numero assoluto di mani, volume di rischio e rapporto di rischio; Pannelli digitali — linea di interruzione del rapporto tra perdite e profitti fissi; — il termine di scadenza per la modifica del lotto dell’ordine di collaudo o dell’ordine di collaudo; • valutazione del singolo rischio rispetto al controllo totale del rischio; — la gestione delle scorte, come ad esempio
About Line Drawing: ( 1) Select Line Type Zigzag Line Fibo Horizontal Trend Line Range Line Price-Time Net ( 2) Set Line Style To set line color built-in or style and width just by clicking certain button To set line color to user color by clicking the second color button of second line when it is pressed ( 3) Start Drawing If you have not pressed any of those Drawing-Type-Button(HL/Rng/Net/Fibo),when you select the Line-Color-Button or
1. Compound Drawings (1) Line segment with arrow (2) Continuous line segment (broken line) (3) Parallelogram (4) Polygon (5) Profit and loss ratio measurement tools 2. Backtracking By the Z key in the process of drawing the line Line types that support Z-key backtracking: continuous line segments (broken line) ,channels,parallelograms,polygons, and fibo extensions. 3.Automatic Adsorption (1) Click the "Lock-Button" to switch the automatic adsorption switch before drawing
About testing Mode: You should download the version for MT4 to test instead. https://www.mql5.com/en/market/product/109093?source=Site+Market+My+Products+Page#description 1. Compound Drawings (1) Line segment with arrow (2) Continuous line segment (broken line) (3) Parallelogram (4) Polygon (5) Profit and loss ratio measurement tools 2. Backtracking By the Z key in the process of drawing the line Line types that support Z-key backtracking: continuous
About testing Mode: 1.To get the best usage experience please use the tick data to test and adjust the test speed to proper speed (tick price jump quickly but K bars scroll slowly)!!! 2.Click "Indicator Properties"-> Click "Reset" before testing the indicator to restore the default parameters of the indicator. 1. Compound Drawings (1) Line segment with arrow (2) Continuous line segment (broken line) (3) Parallelogram (4) Polygon (5) Profit and loss ratio measurement tools
LuXiwu Trend Trading special wave marking tool 0.Main table show hide Click the bottom 10% area of price axis to show or hide main table,or by default key Q. 1. QJT search Click the high or low point of the main wave to automatically find the QJT . If there is overlap between the inner and outer intervals, click the button << or >> to adjust the left and right, or manually drag the adjustment after completion.If there is a failure wave, you can use the system's own


