Thushara Dissanayake / Profilo
- Informazioni
|
9+ anni
esperienza
|
97
prodotti
|
107
versioni demo
|
|
5
lavori
|
0
segnali
|
0
iscritti
|
Con oltre 8 anni di esperienza come programmatore e trader Forex, ho sviluppato più di 90 prodotti, con oltre 1000 vendite all'attivo. La mia passione per l'automazione mi spinge a creare strumenti che racchiudano una reale conoscenza del trading, con l'obiettivo di semplificare il processo decisionale per i trader, consentendo loro di prendere decisioni più intelligenti e rapide.
Offro una vasta gamma di soluzioni di trading per tutti i tipi di trader, dai principianti che muovono i primi passi ai professionisti esperti alla ricerca di strumenti di precisione. Ogni prodotto che rilascio viene accuratamente testato per qualità e prestazioni, garantendovi l'accesso ad alcuni degli strumenti più affidabili e innovativi disponibili oggi.
La mia missione è semplice: aiutare i trader a crescere fornendo loro gli strumenti giusti e un supporto continuo. Sono sempre a vostra disposizione per rispondere alle vostre domande e aiutarvi a trarre il massimo dal vostro percorso di trading.
Unisciti alla nostra crescente community di trader e scopri la differenza che robot, indicatori e applicazioni di trading Forex ben progettati possono fare per il tuo successo.
Canale: https://www.mql5.com/en/channels/forexrobotarmy
Chat: https://www.mql5.com/en/messages/010362012813dc01
Candlestick Pattern Alert è un indicatore di pattern a candele giapponesi per MT4 e MT5, progettato per rilevare, classificare e visualizzare automaticamente oltre 50 pattern principali di candele giapponesi in tempo reale. Creato per il trading basato sulla price action e l'analisi tecnica , l'indicatore analizza le candele completate, identifica pattern di inversione rialzisti e ribassisti confermati e
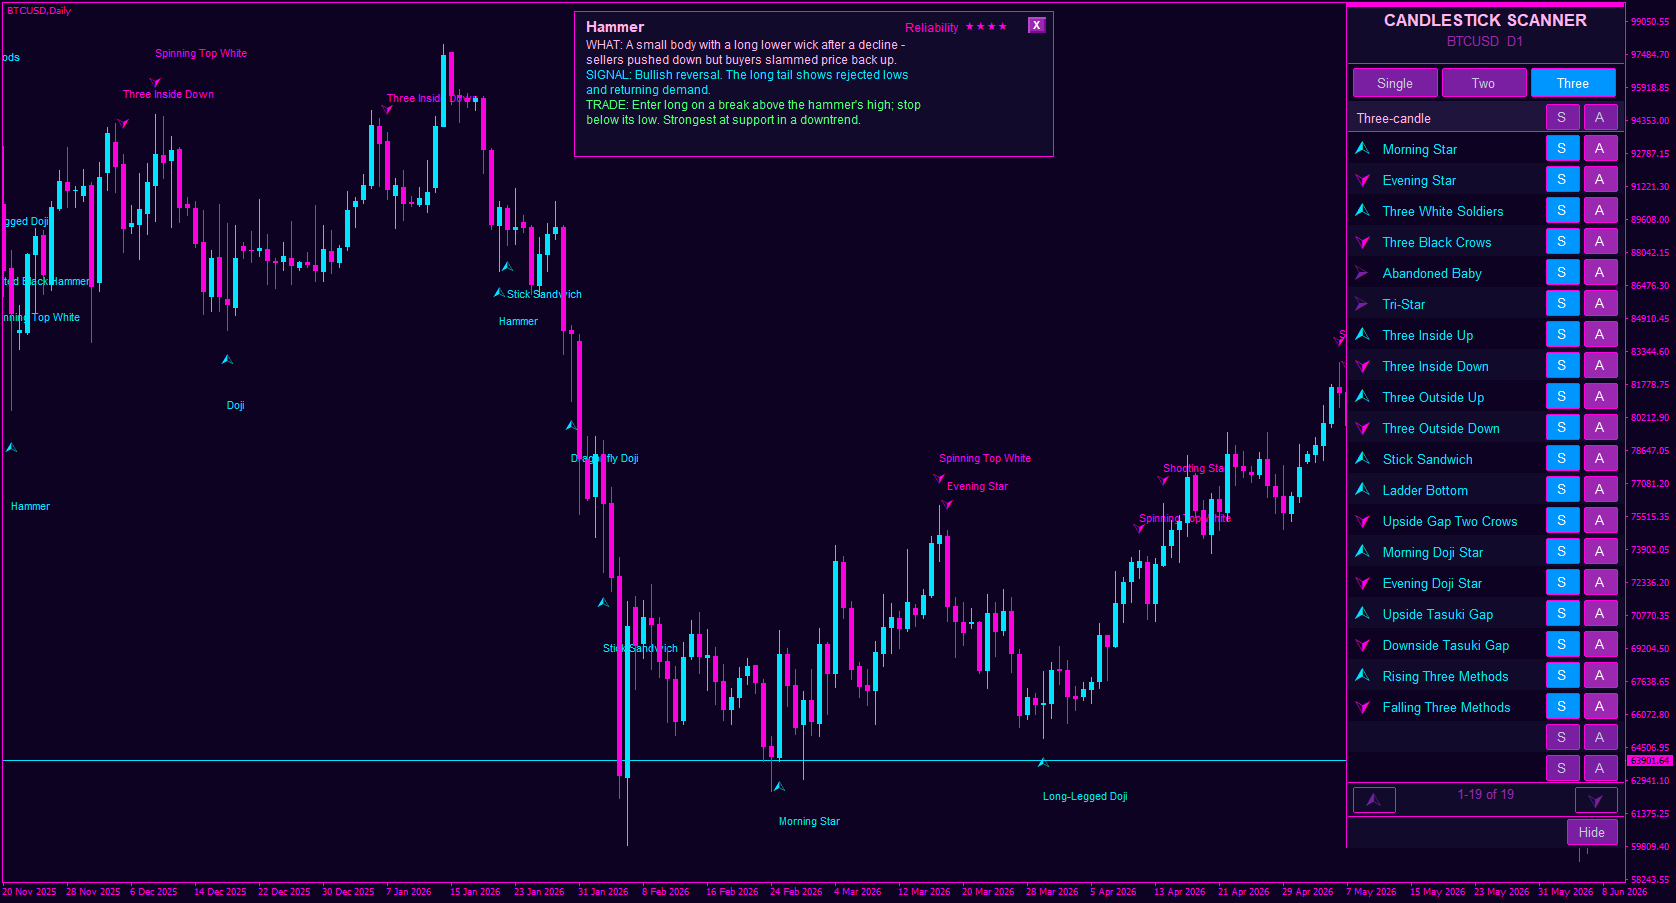
Two features I just added to the pattern detection dashboard:
⭐ Reliability meter - every pattern now shows a strength rating (★★★★☆) right on the card, so you know at a glance how much weight to give a signal. No more guessing which patterns actually matter.
📚 Learn mode - flip a switch and the dashboard cycles through every pattern one by one, like a mini tutorial built right into your charts. Learn the patterns while you trade.
I built these because I remember starting out and drowning in pattern names with no idea which ones to trust. This makes it click faster.
What patterns tripped you up when you were learning? Drop them below 👇 curious to hear.
Follow for the next update. 🔥
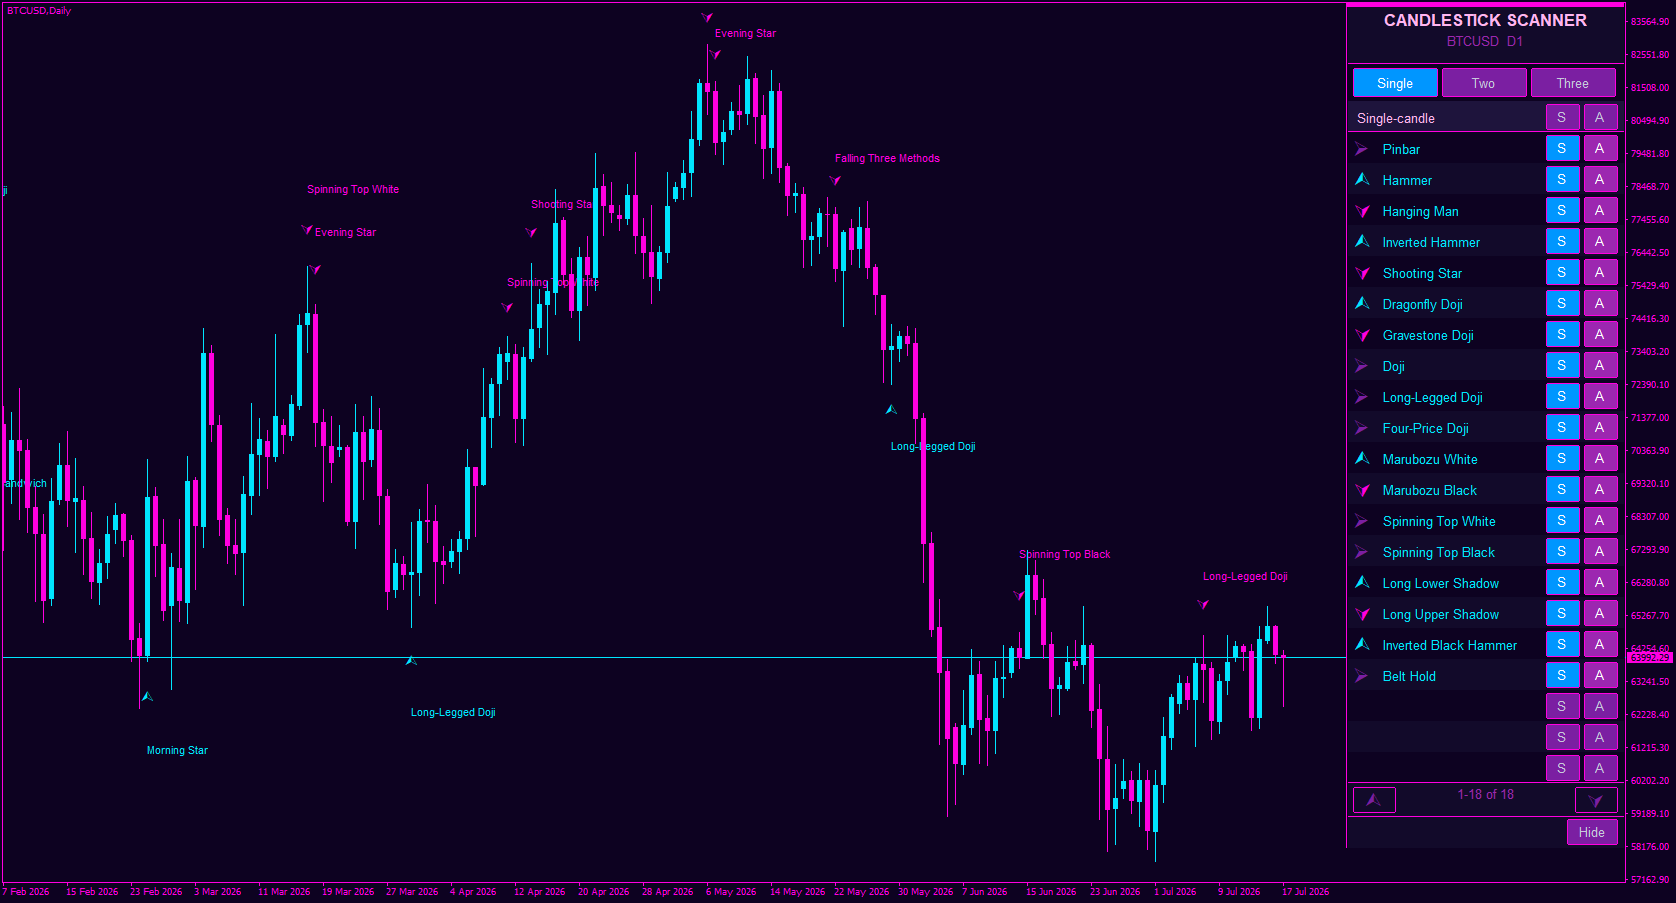
New candlestick pattern detection dashboard, spotting the patterns for you, right on the panel, so you're not squinting at charts trying to name what you're seeing.
This is the very first image I'm sharing. Still early, but it already looks this clean. 🔥
I've got a good feeling about this one.
What patterns would you want it to catch? Drop your must-haves below 👇 your input shapes what I build next.
Follow so you don't miss the next reveal. ⚡
Pivot Confluence Zones è un indicatore di analisi tecnica per MT4 e MT5 progettato per identificare zone di ritracciamento , aree di inversione e livelli di supporto e resistenza, combinando Pivot Point , ritracciamenti di Fibonacci , ATR e ADR in un unico spazio di lavoro per il trading. Invece di affidarsi a un singolo strumento tecnico, l'indicatore ricerca zone di
The update so many of you have been waiting for just went out and this is a big one. Everything you've been asking for over the last few weeks made it into this release.
If you've been sitting on the fence, now's the time to take a proper look. And if you already own it, the update is waiting for you. 🙌
Huge thanks to everyone who sent feedback and ideas along the way v2.0 is genuinely shaped by this community.
Check it out, load it on your charts, and tell me what you think. 👇 Free demo available as always, results may vary, but I think you'll like what you see. 🔥
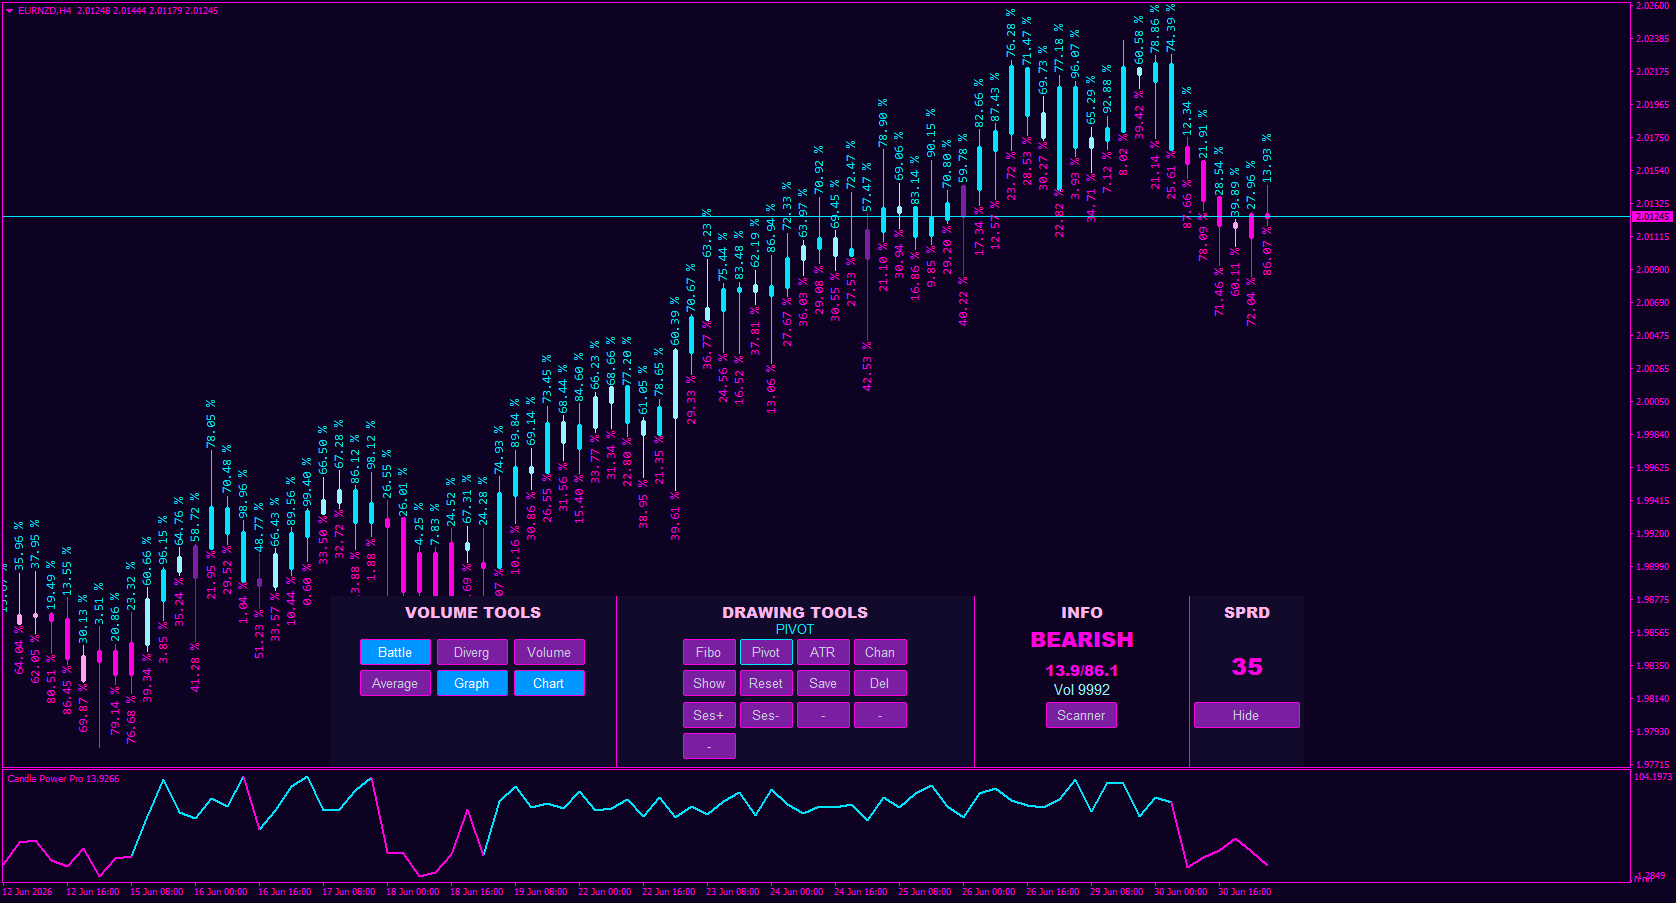
Candle Power Pro è un indicatore di analisi del volume progettato per analizzare il volume reale dei tick , la pressione rialzista/ribassista , gli squilibri tra acquirenti e venditori e le relazioni prezzo-volume direttamente dal grafico. L'indicatore trasforma l'attività del volume delle candele in un sistema di analisi di mercato visivo, mostrando le percentuali di volume rialzista e ribassista , la
Candle Power Pro just got smarter. The updated Volume Spike algorithm now auto-detects high-volume candles and drops a 💣 bomb arrow right when a fresh trend kicks off. Look at the screenshot, every candle redraws by bull/bear percentage, and the moment a real volume spike hits, you see the signal clearly as a new trend opens (this one caught a sell). No guesswork, no squinting at volume bars.
This is the kind of edge I love building, simple to read, genuinely useful, and now fully automatic.
Want to see it live on your charts? Check out Candle Power Pro and grab the free demo. 👇 As always, results may vary, but the read is crystal clear.
Drop a comment if you'd run this strategy. 🔥
Take a close look at the dashboard and tell me what changed. First one to call it right gets bragging rights. 😏
Drop your guess below. 👇 I'll reveal it in the comments once a few of you have had a go.
Follow to catch the full update when it drops. 🔥
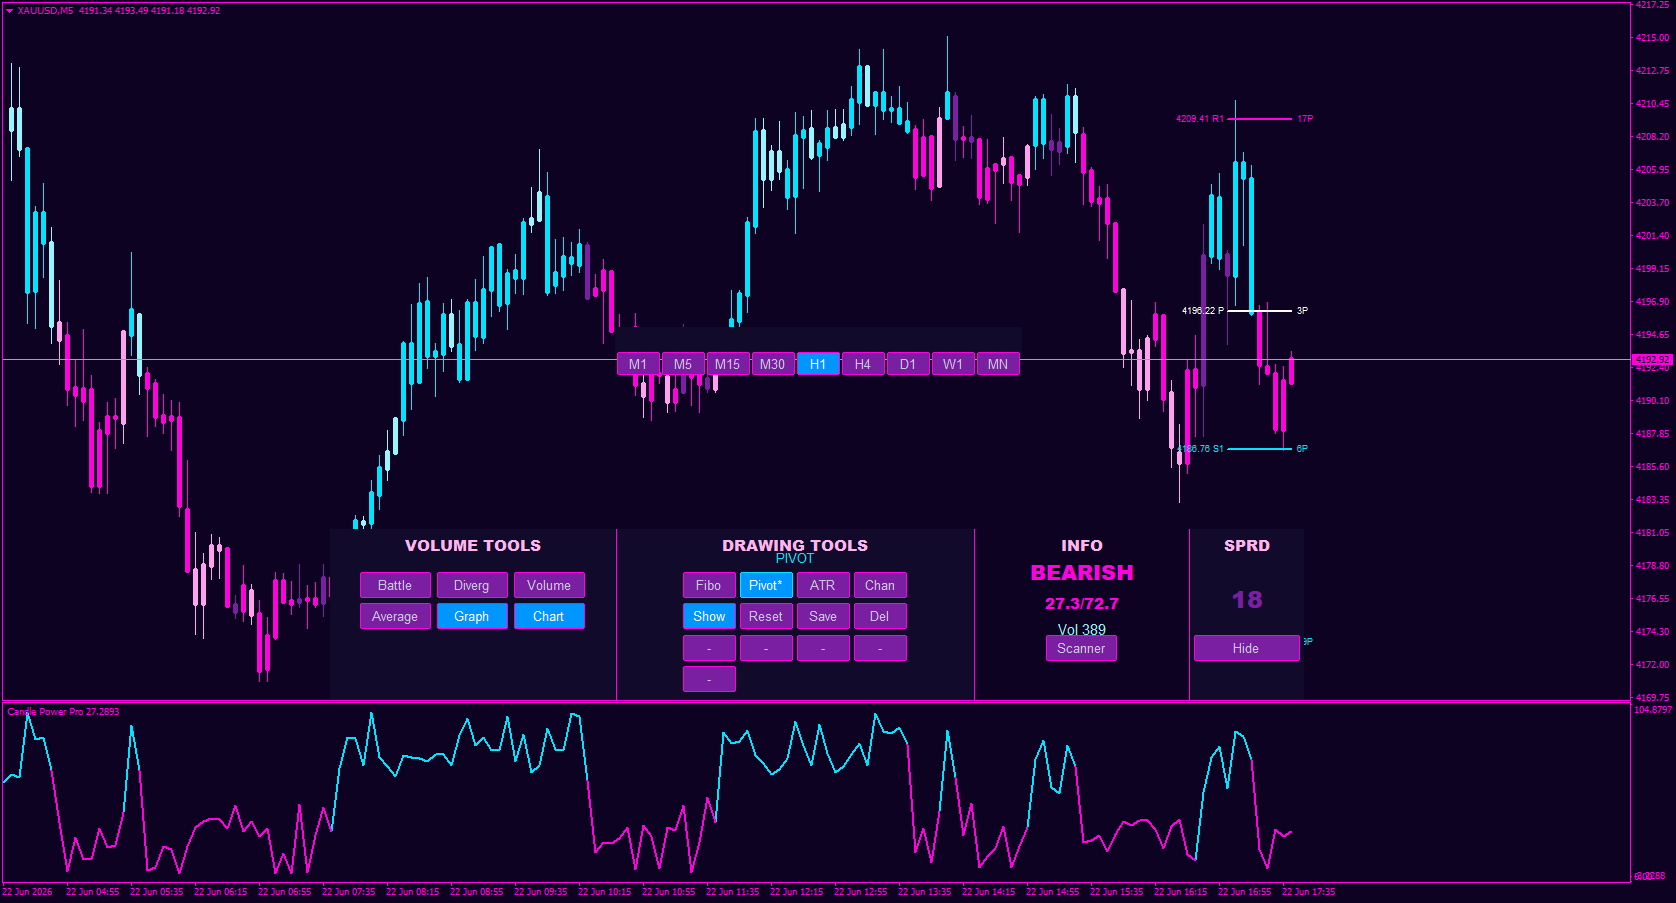
No name. No details. Just a look.
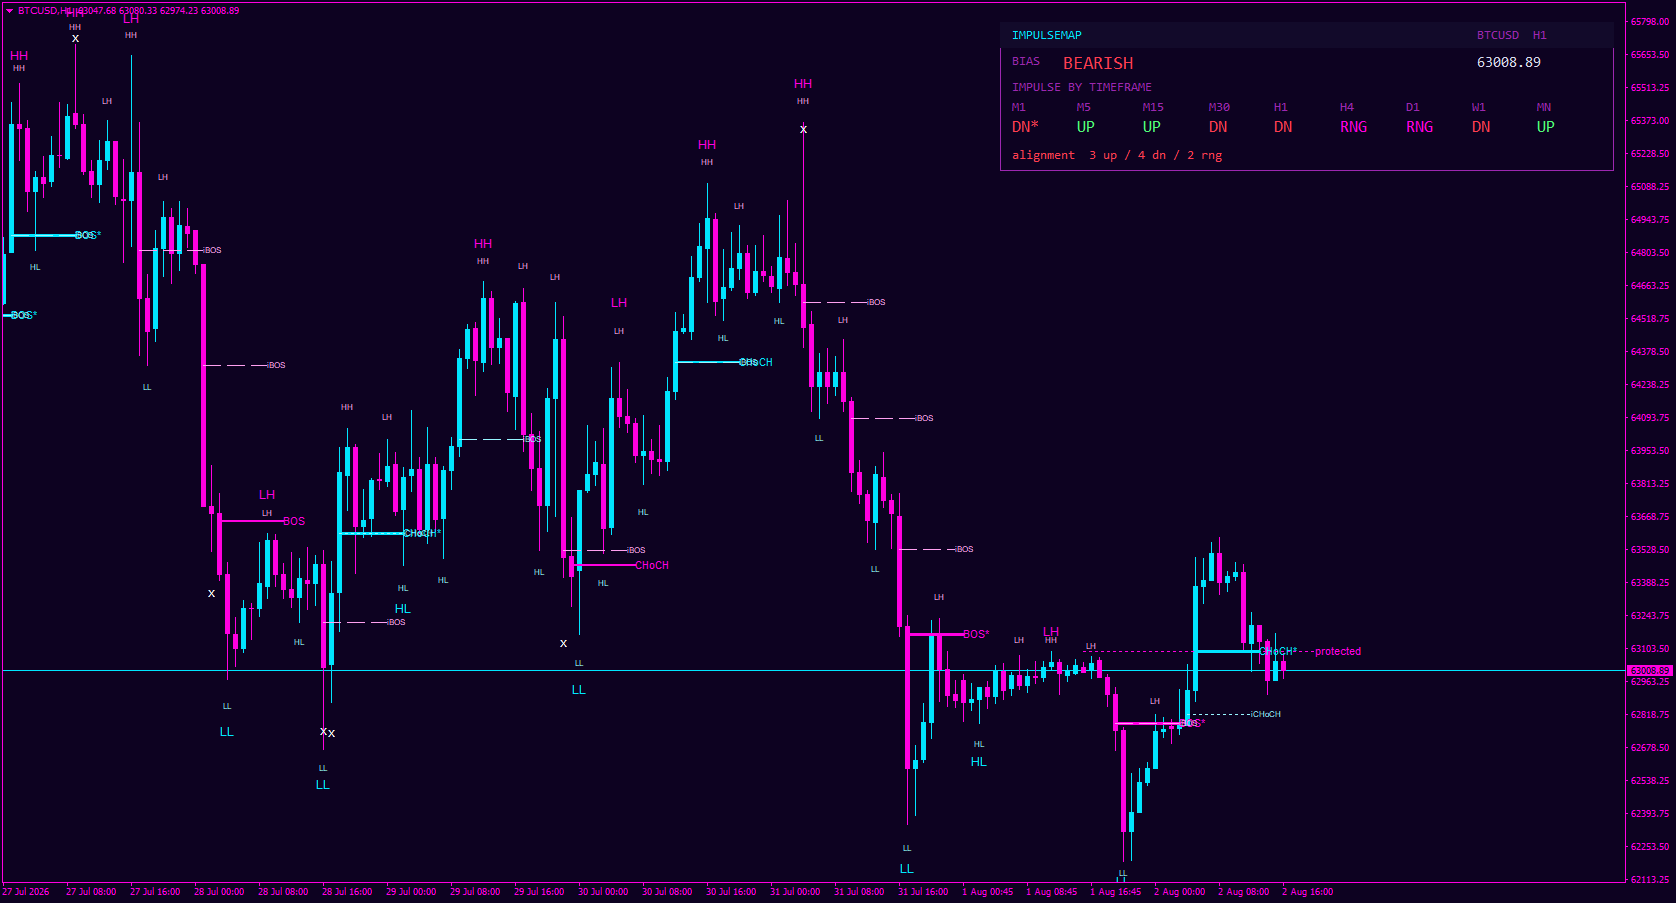
That cyber-synth glow, pivot levels mapped out, candle power signals sitting right behind your chart where you actually need them. All in one clean panel.
I'm obsessed with how this theme is coming together, but I want YOUR eyes on it.
What's the vibe? Does the design hit, or would you change something? Drop your honest take below. 👇
Something new is coming. Follow so you don't miss the reveal. ⚡
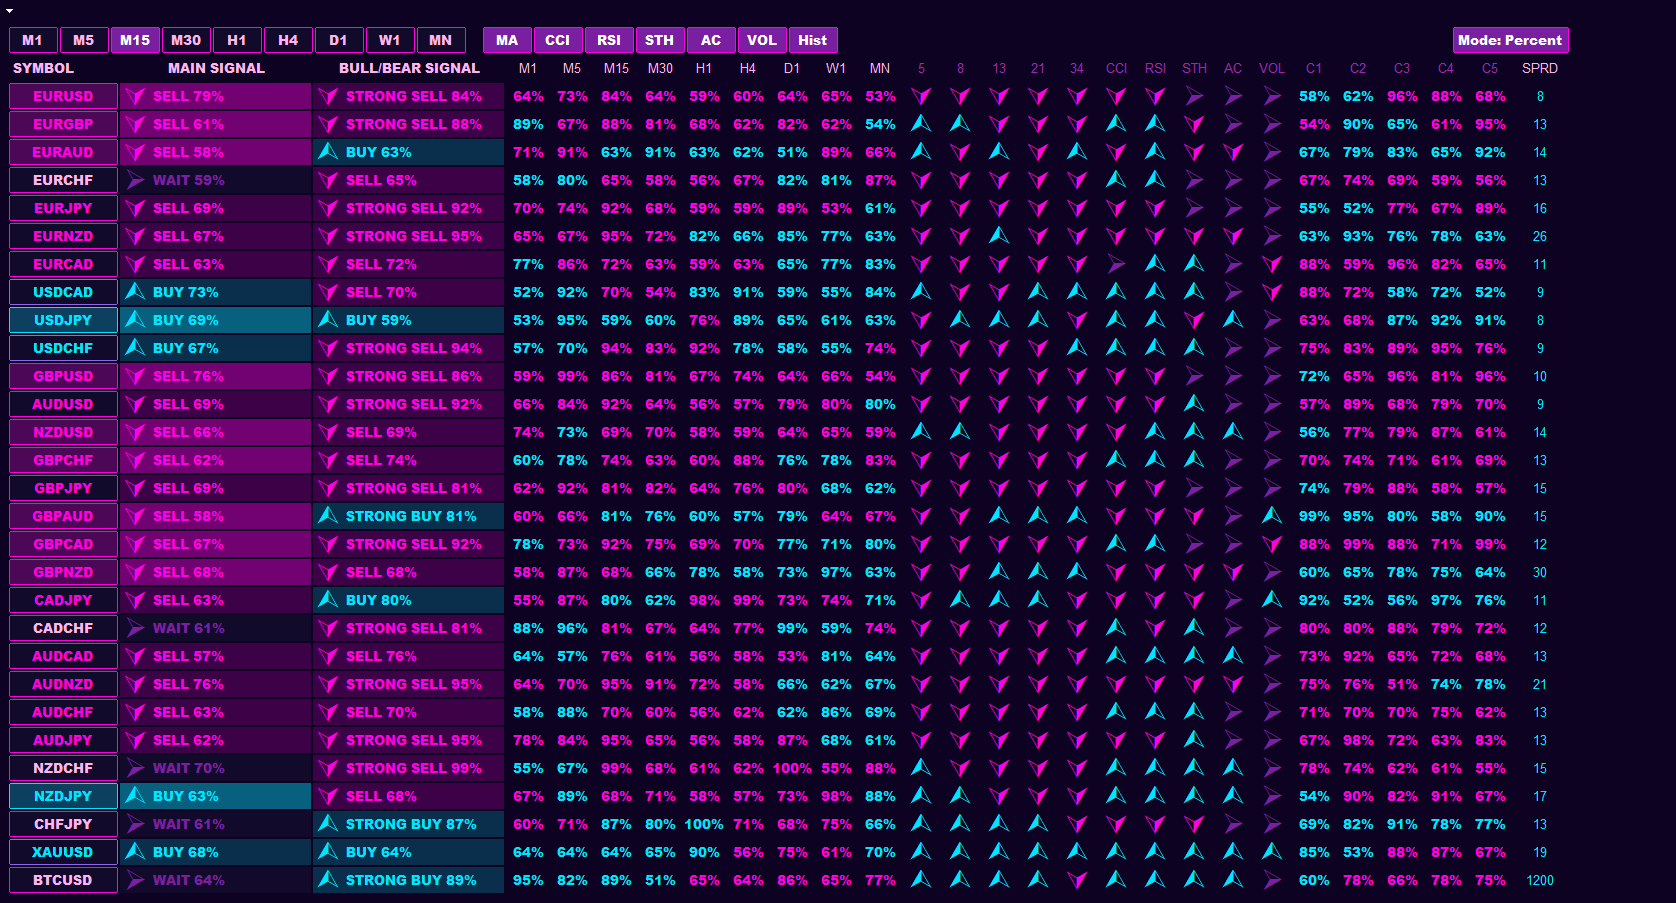
Candle Power Pro - Multisymbol Dashboard is finally taking shape.
One dashboard. All your symbols. All the candle strength data you need to read the market at a glance, no more jumping chart to chart trying to piece it together.
It's still under active development (not done yet, so be kind 😅), but it's at the point where I want to show it off and hear from you.
Here's my honest ask: take a look at this sneak peek and tell me what you think. What would make this a must-have on your charts? What's missing? Your feedback now actually shapes what ships.
Drop your honest review in the comments, good, bad, brutal. I read every one. 🙏
Follow to catch the release first.
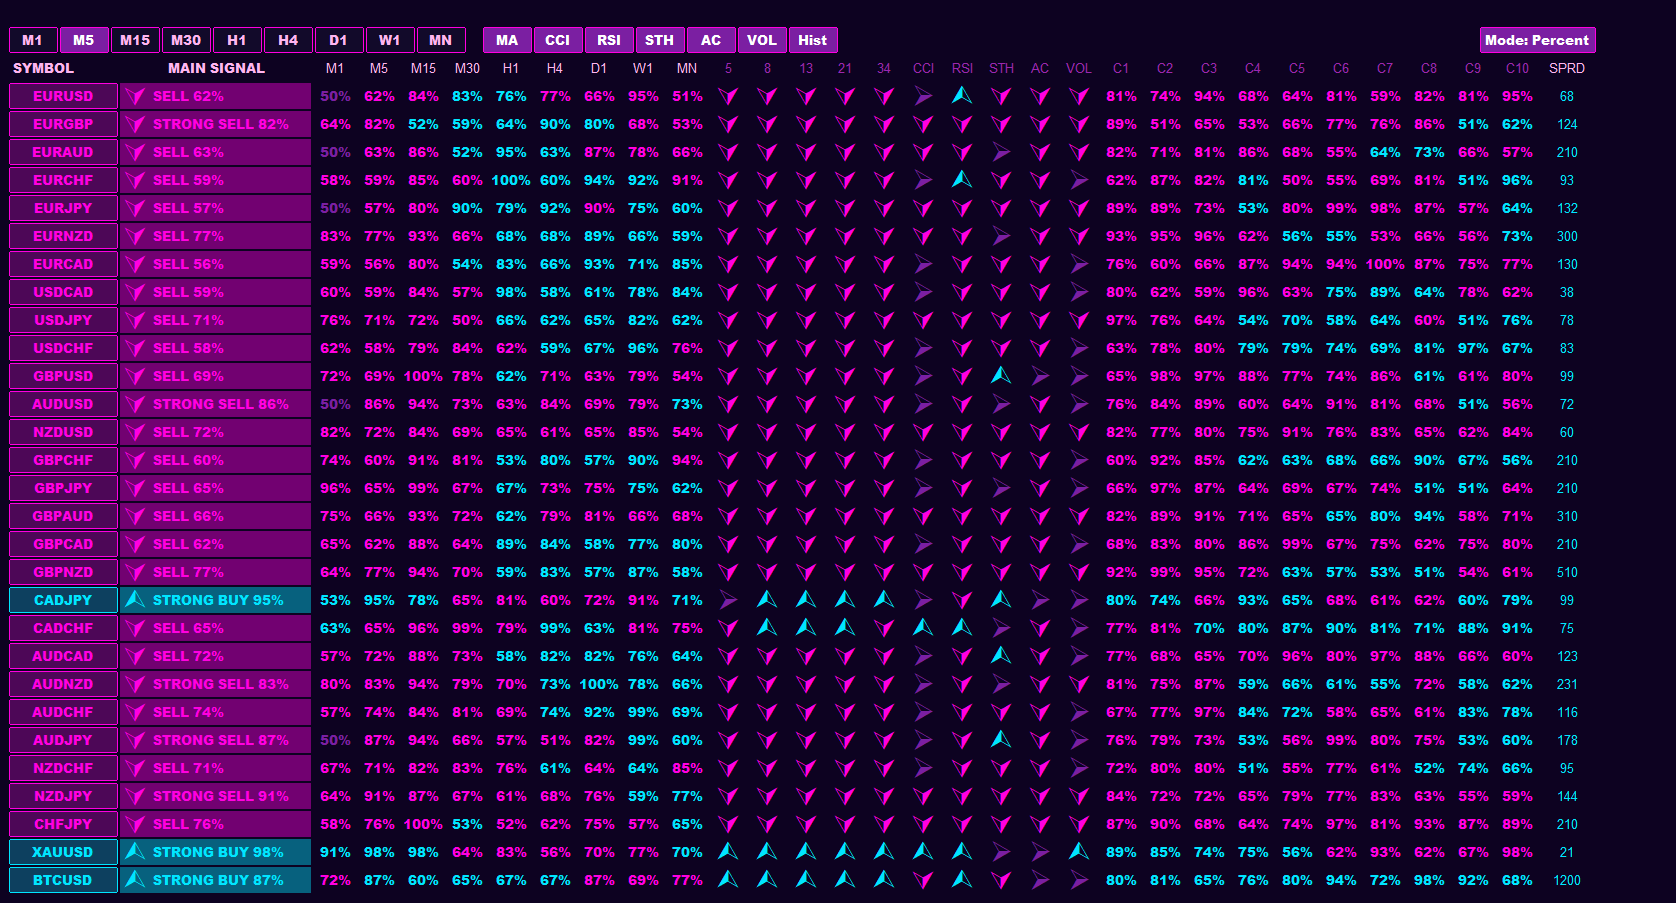
Entry Point Dashboard Ultimate è un indicatore di trading multi-timeframe per MT4 e MT5 progettato per semplificare l'analisi tecnica , l'analisi dei trend di mercato e l'identificazione dei punti di ingresso , combinando diversi strumenti di trading in un'unica dashboard visiva. L'indicatore analizza medie mobili , CCI , RSI , Stocastico , dati di momentum e volumi su timeframe
Triple MA Crossover Alert è un indicatore di incrocio di medie mobili progettato per analizzare la direzione del mercato utilizzando una combinazione di tre medie mobili: media mobile veloce , media mobile normale e media mobile lenta . L'indicatore aiuta i trader a identificare i cambiamenti nel trend di mercato , le potenziali condizioni rialziste e ribassiste e le aree di movimento dei prezzi importanti
Smart Daily Fibonacci is a Daily Fibonacci Indicator for MT4 and MT5 that automatically draws Fibonacci Retracement and Fibonacci Extension levels using the previous trading day's high and low. Designed for Forex traders , gold traders , index traders , cryptocurrency traders , scalpers , day traders , swing traders , and prop firm traders , it helps create a structured daily trading framework without the need to manually draw Fibonacci tools every session. By transforming the previous day's
Smart Daily Fibonacci is a Daily Fibonacci Indicator for MT4 and MT5 that automatically draws Fibonacci Retracement and Fibonacci Extension levels using the previous trading day's high and low. Designed for Forex traders , gold traders , index traders , cryptocurrency traders , scalpers , day traders , swing traders , and prop firm traders , it helps create a structured daily trading
IL Punto di ingresso indicatore è un cruscotto di segnalazione professionale che combina molteplici indicatori tecnici su un massimo di tre intervalli temporali per produrre un singolo Segnale di ingresso consolidato . Invece di dover gestire finestre separate per medie mobili, CCI, RSI, stocastico, acceleratore di Bill Williams e analisi del volume, i trader possono visualizzare tutte
IL Zona di protezione indicatore è un strumento di trading giornaliero progettato per evidenziare i punti chiave livelli di profitto da realizzare derivato da due periodi di intervallo calcolato sul Intervallo di tempo D1 . Identificando automaticamente il giorno zone di resistenza
IL Donchian Breakout Scanner Pro è un completo strumento di monitoraggio multi-simbolo che tiene traccia automaticamente Breakout del canale Donchian su vari strumenti di trading e intervalli di tempo. Questo scanner avanzato analizza continuamente l'andamento dei prezzi utilizzando il classico Metodologia del canale di Donchian , che
Il Donchian Time Sync Analyzer aggiunge una potente dimensione multi-timeframe all'analisi classica del canale di Donchian, consentendo ai trader di monitorare simultaneamente la forza del trend e i potenziali segnali di inversione su cinque diversi periodi del grafico. Questo indicatore avanzato calcola i massimi più alti e i minimi più bassi nei timeframe selezionati, generando chiari segnali visivi che aiutano a