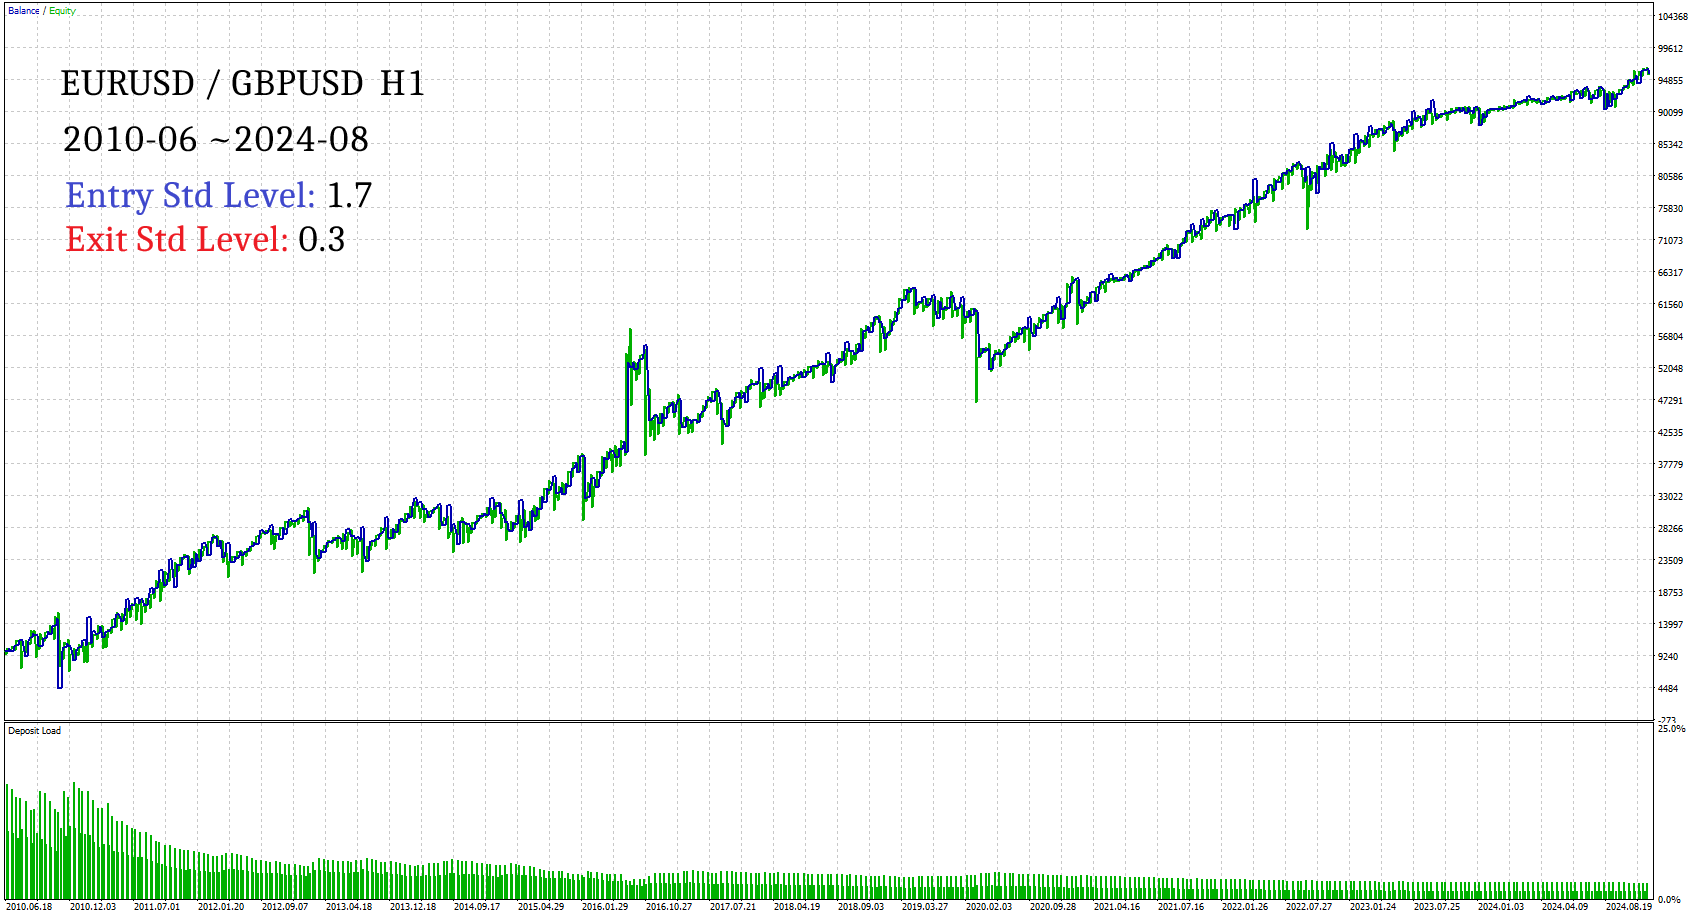
Rasoul Mojtahedzadeh / Profilo
- Informazioni
|
11+ anni
esperienza
|
14
prodotti
|
701
versioni demo
|
|
3
lavori
|
0
segnali
|
0
iscritti
|
This version improves the performance of the Pairs Trading algorithm by implementing Rolling Window Z-Score (Welford) calculations.
https://www.mql5.com/en/market/product/109181
RFX5 Bull Bear Powers indicator shows the absolute power of bulls and bears controlling the market. Both powers are shown simultaneously with red and green colors for bear and bull powers respectively. When red line goes over the green line it means that bears are controlling the market. When green line goes over the red line it means that bulls are controlling the market. The green/red horizontal symbol line at the bottom of the indicators shows which party has more strength. Time Frame
Profitable Statistical Arbitrage and M ean Reversion Algorithm This Expert Advisor implements the well-established Pairs Trading algorithm — a classic quantitative trading strategy based on statistical arbitrage and mean reversion . The EA identifies the optimal hedge ratio between two correlated trading symbols to construct a synthetic stationary spread . It continuously monitors the deviation of this spread from its mean value and opens
The RFX Forecast Bands indicator calculates the three significant confidence levels, 99%, 95% and 68% of price movement for a configurable number of bars in the future. The essence of calculations is based on statistical analysis of the asset's recent price changes. These levels can be used for many different purposes in trading systems. For example, one can use them for setting the target profit and stop loss levels effectively. The extreme upper and lower bands represent 99% confidence
Note: This indicator cannot be tested in the strategy tester. Please download the free demo version from https://www.mql5.com/en/market/product/48627 RFX Delta Volume is an indicator to show bullish and bearish volumes separately for each trading candle. The indicator uses history data of one minute (M1) to estimate the true bullish and bearish volumes in a sub-window. There are two modes of operations for this indicator. In mode "Delta Volume", the indicator shows the difference in
https://www.mql5.com/en/market/product/26592
https://www.mql5.com/en/market/product/13391
https://www.mql5.com/en/market/product/5580


