|
8+ anni
esperienza
|
32
prodotti
|
147
versioni demo
|
|
0
lavori
|
0
segnali
|
0
iscritti
|
👑 Fisico teorico, programmatore.
Faccio trading da quindici anni con un'enfasi sulla ricerca dei modelli matematici del mercato.
----------------------------------------------------------------------------------------------------------------------------------
💰 Prodotti presentati:
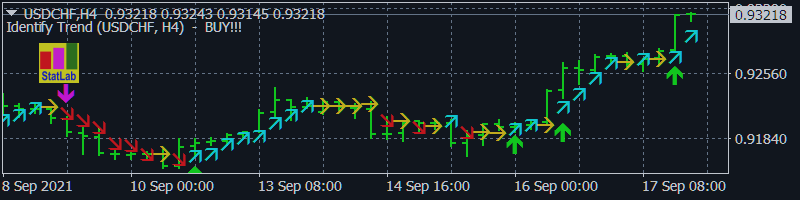
1) 🏆 Indicatori con filtraggio ottimale del rumore di mercato (per selezionare i punti di apertura e chiusura delle posizioni).
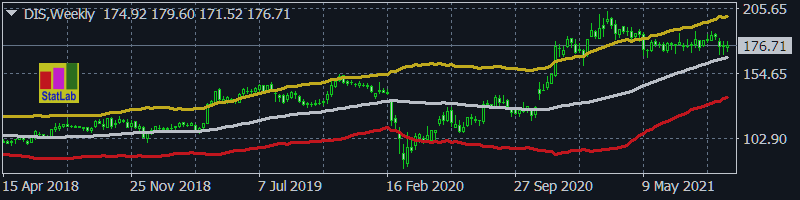
2) 🏆 Indicatori statistici (per determinare il trend globale).
3) 🏆 Indicatori di ricerche di mercato (per chiarire la microstruttura dei prezzi, costruire canali, identificare differenze tra inversioni di tendenza e pullback).
----------------------------------------------------------------------------------------------------------------------------------
☛ Maggiori informazioni nel blog https://www.mql5.com/en/blogs/post/741637
Faccio trading da quindici anni con un'enfasi sulla ricerca dei modelli matematici del mercato.
----------------------------------------------------------------------------------------------------------------------------------
💰 Prodotti presentati:
1) 🏆 Indicatori con filtraggio ottimale del rumore di mercato (per selezionare i punti di apertura e chiusura delle posizioni).
2) 🏆 Indicatori statistici (per determinare il trend globale).
3) 🏆 Indicatori di ricerche di mercato (per chiarire la microstruttura dei prezzi, costruire canali, identificare differenze tra inversioni di tendenza e pullback).
----------------------------------------------------------------------------------------------------------------------------------
☛ Maggiori informazioni nel blog https://www.mql5.com/en/blogs/post/741637