Lavoro terminato
Specifiche
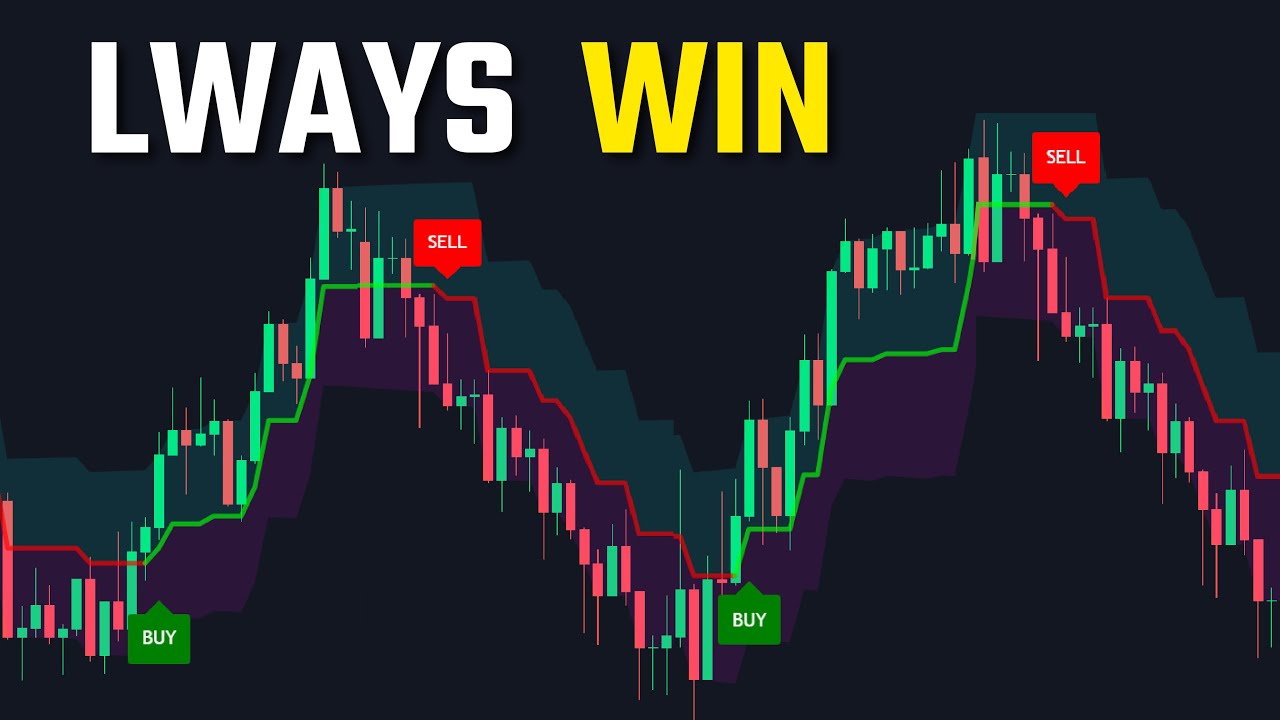
STEP INDEX & VOLATILITY INDICES SIGNAL INDICATOR/STRATEGY (3-4 DAILY SIGNALS)
BUY (BLUE COLOR) & SELL (RED COLOR) Signals must show on the chart on time with NO delays
Core Signal System (M15 Entries + H1 Analysis)
Primary Trend Direction (Mandatory)
- Analysis: H1 chart - 20-EMA vs 50-EMA trend direction
- Entry: M15 chart - Price position relative to H1 EMAs
- BUY: H1: 20-EMA over 50-EMA + M15: Price above H1 20-EMA level
- SELL: H1: 20-EMA below 50-EMA + M15: Price below H1 20-EMA level
Multi-Timeframe RSI (Key Component)
- Analysis timeframe: H1 RSI for trend bias
- Signal timeframe: M15 RSI for precise entries
- BUY: H1 RSI 35-65 + M15 RSI crosses above 35
- SELL: H1 RSI 35-65 + M15 RSI crosses below 65
MACD Momentum (M15 Signals)
- Settings: 8, 21, 5 on M15 chart
- Analysis: H1 MACD for trend confirmation
- BUY: H1 MACD bullish + M15 MACD line > Signal line
- SELL: H1 MACD bearish + M15 MACD line < Signal line
Bollinger Band Squeeze/Expansion
- Settings: BB(14, 2.0) optimized for step movements
- BUY: Price touches lower band + starts moving up
- SELL: Price touches upper band + starts moving down
Volume Surge Confirmation
- Threshold: Volume > 1.3x average (20-period)
- Purpose: Confirms algorithmic movement strength
Signal Generation Logic (3-4 Daily Signals)
BUY Signal Requirements (ALL 5 must be true):
- H1: 20-EMA > 50-EMA + M15: Price above H1 20-EMA level
- H1 RSI 35-65 + M15 RSI crosses above 35
- H1 MACD bullish + M15 MACD line > Signal line
- M15: Price at/near Bollinger lower band + reversal candle
- M15: Volume > 1.3x average (confirms entry timing)
SELL Signal Requirements (ALL 5 must be true):
- H1: 20-EMA < 50-EMA + M15: Price below H1 20-EMA level
- H1 RSI 35-65 + M15 RSI crosses below 65
- H1 MACD bearish + M15 MACD line < Signal line
- M15: Price at/near Bollinger upper band + reversal candle
- M15: Volume > 1.3x average (confirms entry timing)
Step Index Specific Adaptations
Price Movement Recognition
Step Index moves in fixed increments (0.1, 0.2, 0.5 points)
Step Size = 0.1 Adjust based on index type
Min Move = Step Size 3 Minimum 3-step move for signal validity
Movement confirmation
Valid Move = abs (Close - Close[3]) >= Min Move
Support/Resistance for Step Indices
Use round numbers and step multiples
Resistance Level = ceil (High/Step Size) Step Size
Support Level = floor(Low/Step Size) Step Size
Volatility Index Adaptations
Index-Specific Settings:
- Vol 10: Use 15-minute timeframe for signals
- Vol 25: Use 30-minute timeframe
- Vol 50: Use 1-hour timeframe
- Vol 75/100: Use 1-hour to 4-hour timeframes
Modified RSI Thresholds:
- High Vol (75/100): RSI 30/70 levels
- Medium Vol (25/50): RSI 35/65 levels
- Low Vol (10): RSI 40/60 levels
Enhanced Technical Implementation
Core Algorithm (M15 Entry + H1 Analysis)
H1 Trend Analysis
H1_EMA20 = EMA(H1_Close, 20)
H1_EMA50 = EMA(H1_Close, 50)
H1_TrendUp = H1_EMA20 > H1_EMA50
H1_TrendDown = H1_EMA20 < H1_EMA50
H1 Bias Indicators
H1_RSI = RSI(H1_Close, 14)
H1_MACD = EMA(H1_Close, 8) - EMA(H1_Close, 21)
H1_Signal = EMA(H1_MACD, 5)
H1_MACDBullish = H1_MACD > H1_Signal
H1_MACDBearish = H1_MACD < H1_Signal
M15 Entry Signals
M15_RSI = RSI(M15_Close, 14)
M15_MACD = EMA(M15_Close, 8) - EMA(M15_Close, 21)
M15_Signal = EMA(M15_MACD, 5)
M15_BB_Upper = SMA(M15_Close, 14) + (2 StdDev(M15_Close, 14))
M15_BB_Lower = SMA(M15_Close, 14) - (2 StdDev(M15_Close, 14))
Volume Confirmation
M15_AvgVol = SMA(M15_Volume, 20)
Volume Confirm = M15_Volume > (M15_AvgVol x 1.3)
Signal Generation Code
Score Count = 0
Similar logic for SELL signals
Visual Display (Optimized for Synthetic Markets)
Chart Signals
- Signal strength: 1-5 stars based on score
Information Panel
INDEX: STEP INDEX
SIGNALS TODAY: 5/6
TREND: BULLISH
RSI: 45 → 38 ✅
MACD: BULLISH ✅
BB: NEAR SUPPORT ⚡
SCORE: 4/5
NEXT SIGNAL: WAITING
Risk Management for Synthetic Indices
Position Sizing
- Risk per signal: 1-2% of account
- Step Index stops: 5-10 steps from entry
- Volatility Index stops: 0.5-1.0% of index value
Target Profits
- Conservative: 2:1 risk-reward
- Aggressive: 3:1 risk-reward
- Step Index: Target 15-30 steps profit
Daily Signal Distribution
Target: 3-4 Strong Signals Per Day
- Morning session: 1-2 signals (00:00-12:00 GMT)
- Afternoon session: 1-2 signals (12:00-24:00 GMT)
- Signal spacing: Minimum 2 hours between signals
- Maximum per index: 5 signals per day per index