I begin with some lines of introduction to let you understand what this indicator should be able to do:
Considering the last sequence of consecutive bullish heiken ashi, the relevant bullish ones are: third, fifth, eighth, tenth, eleventh, thirteenth, fifteenth, multiples of five (20, 25, 30, 35, and so on...);
Considering the last sequence of consecutive bearish heiken ashi, the relevant bearish ones are: third, fifth, eighth, tenth, eleventh, thirteenth, fifteenth, multiples of five (20, 25, 30, 35, and so on...) ;
The good bullish heiken ashi is chosen from a group of relevant bullish heiken ashi;
The good bearish heiken ashi is chosen from a group of relevant bearish heiken ashi;
One condition to choose the good bullish heiken ashi is: counting the number of consecutive bullish heiken ashi and choose the last relevant bullish one;
One condition to choose the good bearish heiken ashi is: counting the number of consecutive bearish heiken ashi and choose the last relevant bearish one;
The relevant bullish heiken ashi, to be chosen as good, should represent a max compared to the 48 (customizable value) previous heiken ashi;
The relevant bearish heiken ashi, to be chosen as good, should represent a min compared to the 48 (customizable value) previous heiken ashi;
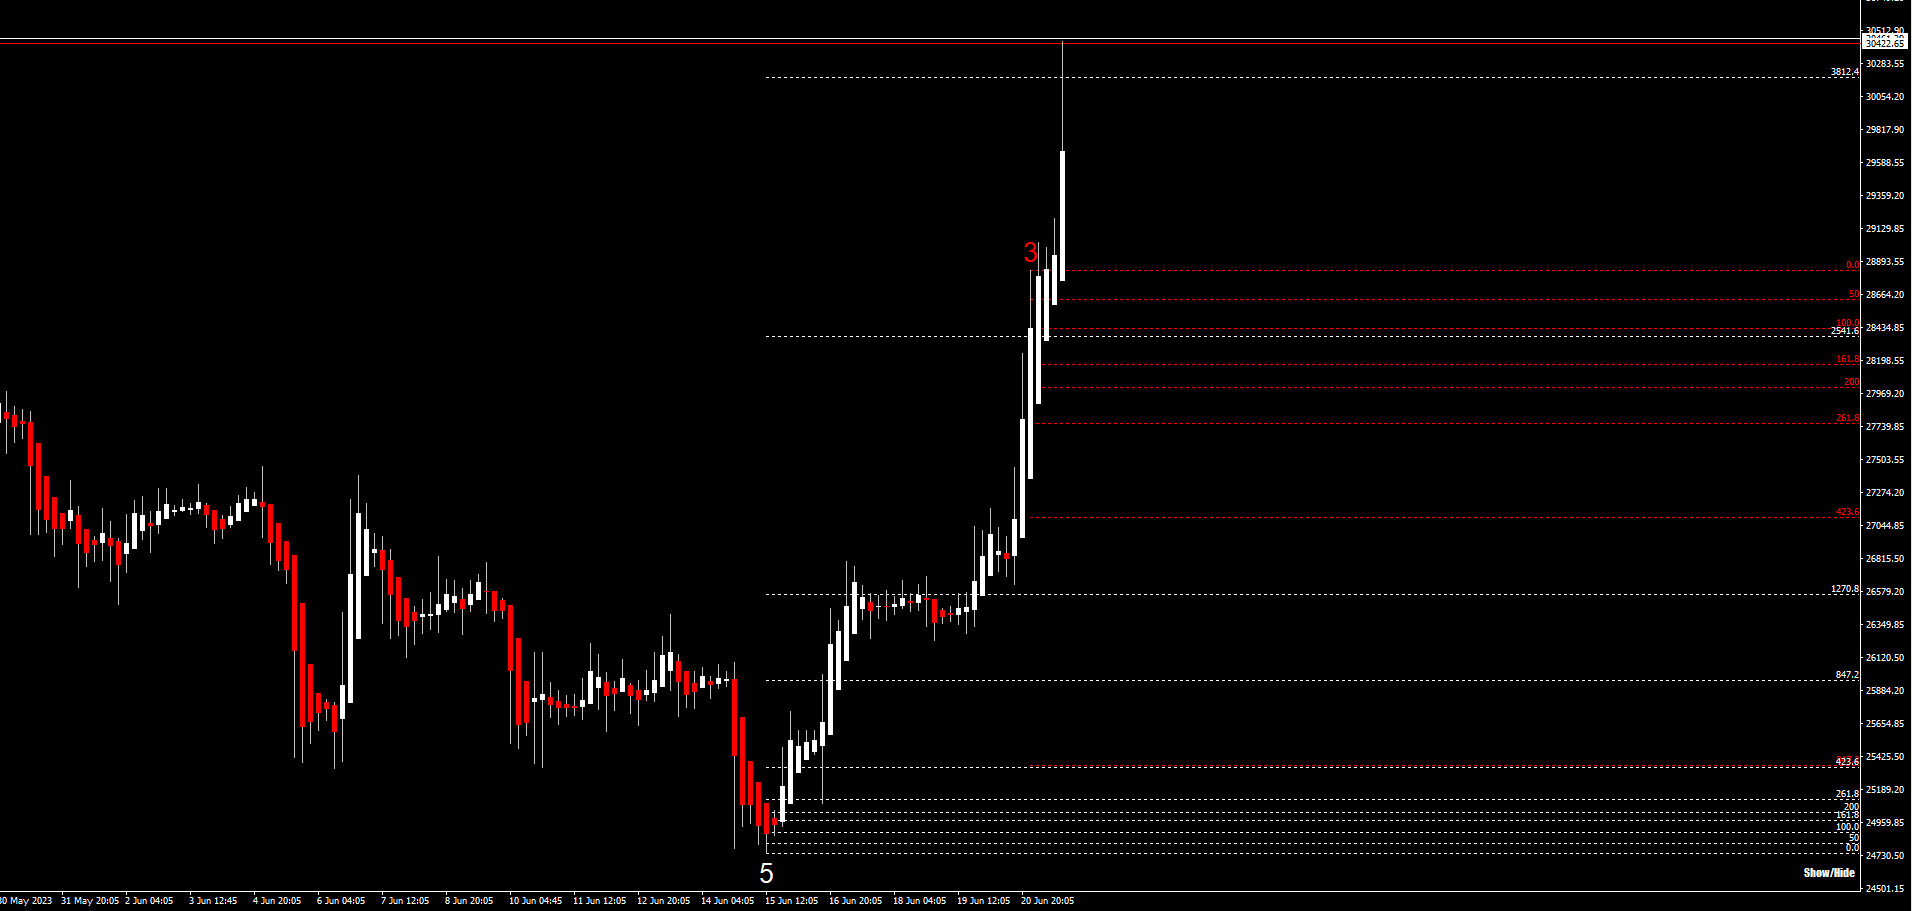
Indicator must create one bullish fibonacci retracement in the main chart, starting from beginning of the higher wick of the good bullish heiken ashi - ending at the top of the higher wick of the good bullish heiken ashi;
Indicator must create one bearish fibonacci retracement in the main chart, starting from beginning of the lower wick of the good bearish heiken ashi - ending at the bottom of the lower wick of the good bearish heiken ashi;
The bullish fibonacci retracement levels to be drawn are 0, 100, 161.8, 200, 261.8, 423.6, 847.2, 1270.8, 2541.6, 3812.4;
The bearish fibonacci retracement levels to be drawn are 0, 100, 161.8, 200, 261.8, 423.6, 847.2, 1270.8, 2541.6, 3812.4;
The indicator update the fibonacci retracements every new tick. I need the description for each level of its value (0, 100, 161.8, and so on...). I need to choose to show both (bullish + bearish) fibo retracement or only one. In addiction i would like customizable colors and line style and the consecutive heiken ashi number plotted above/below the good heiken ashi like in the following pic.
A picture worth more than 1000 words. (P.S. Between 0 and 100 levels you can see 50. I don't need that level)
Ordini simili
Create a bot that can trade and read indicators easy to read for first time users. Bot that can be used on a phone and connect to MT5. It should be easy to install or use on any device especially phone and laptop, preferably the bot that can run over night and controllable when needed
These are orderflow footprint indicator I would like to know if you can algorithmisie and build a stacked imbalance bot from them .. Kindlt let me know if you can do it and check the file before replying me
I have 2 trading view indicators by GainzAlgo that I want code to mt5 , could u advise? I need you to give me response if you can convert This
I DO NOT need any programming or strategy development. I already have a working NinjaTrader 8 automated strategy based on a 3/5 EMA crossover. I need you to run my existing strategy through NinjaTrader Strategy Analyzer/Optimizer, test the existing adjustable parameters, and find robust settings with the best profit factor and lowest reasonable drawdown. I will provide the existing NinjaScript ZIP. I do not want the
Platform: TradingView Programming Language: Pine Script v6 Type: Custom Indicator Project Name: Scalping Reaction Zones + Valid Order Blocks MAIN GOAL I need a custom TradingView indicator for scalping. The indicator must detect: 1. Reaction / Explosion Zones 2. Valid Order Blocks 3. Combined Reaction Zone + Order Block zones The indicator should NOT generate: Buy signals Sell signals TP SL Entry signals Trading
Project Description I am looking for an experienced MQL5/MT5 Expert Advisor developer to develop an automated trading EA for XAUUSD on the M3 timeframe , running on an Exness account . The EA will automate a manual strategy based on SNR/GAP zones , using two setup types: Price Rejection Price Correction The EA should identify valid BUY/SELL setups around predefined SNR/GAP areas, apply configurable RSI, SMA, EMA and
Indicador Maximas e Minimas + Super Trend O Indicador MAX/MIN é um indicador de análise técnica para o MetaTrader 5 , desenvolvido para ajudar você a identificar regiões importantes de preço e possíveis oportunidades de compra e venda. O que ele faz MAX/MIN: identifica máximas e mínimas relevantes do mercado e mostra os preços no gráfico. HH / HL / LH / LL: ajuda a visualizar a estrutura do mercado, mostrando quando
Hello Traders, Have a trading strategy or idea you want to automate? I specialize exclusively in MQL5 development, helping traders turn their concepts into professional trading solutions. Custom Expert Advisors — automate your strategy and reduce manual execution Custom Indicators — transform your market ideas into powerful trading tools Fix & Debug — identify errors and get your existing code working properly
I DO NOT need any programming or strategy development. I already have a working NinjaTrader 8 automated strategy based on a 3/5 EMA crossover. I need you to run my existing strategy through NinjaTrader Strategy Analyzer/Optimizer, test the existing adjustable parameters, and find robust settings with the best profit factor and lowest reasonable drawdown. I will provide the existing NinjaScript ZIP. I do not want the
I'm looking for an experienced developer to create an automated gold trading bot. The bot should be compatible with MetaTrader 4/5 and TradingView. Key Requirements: - Automated trading bot - Compatible with MetaTrader 4/5 and TradingView - Implement scalping and swing trading strategies Ideal Skills and Experience: - Proficiency in trading algorithms - Experience with gold trading - Familiarity with MetaTrader and
 Tutti gli ordini
 Regolamenti