 Tutti gli ordini
 Regolamenti
Lavoro terminato
Specifiche
This EA will execute and identify momentum by offering a visual representation of three line strike Engulfing candlestick bullish/Bearish patters overlayed with smoothed moving averages.
*I HAVE THE CODE AND WILL SHARE THE TRADINGVIEW SCRIPT*
1) this robot will execute engulfing key candlestick patterns - Engulfing candles and 3 Line Strikes.
Ex. bullish momentum at least 3 bullish candles followed by a CLOSING engulfing bearish candle *SIGNAL DOWN* and Trade taken with an automatic stop loss placed 100 pips above the closing bearish candle stop loss in place risking
Ex. Bullish positions are only taken when above the 200 EMA on given timeframe selected
Ex. Bearish Trades are only taken when the Pair is Below the 200 EMA on given timeframe selected
2) Make Alerts available upon criteria met.
- All Major Forex pairs/Crosses
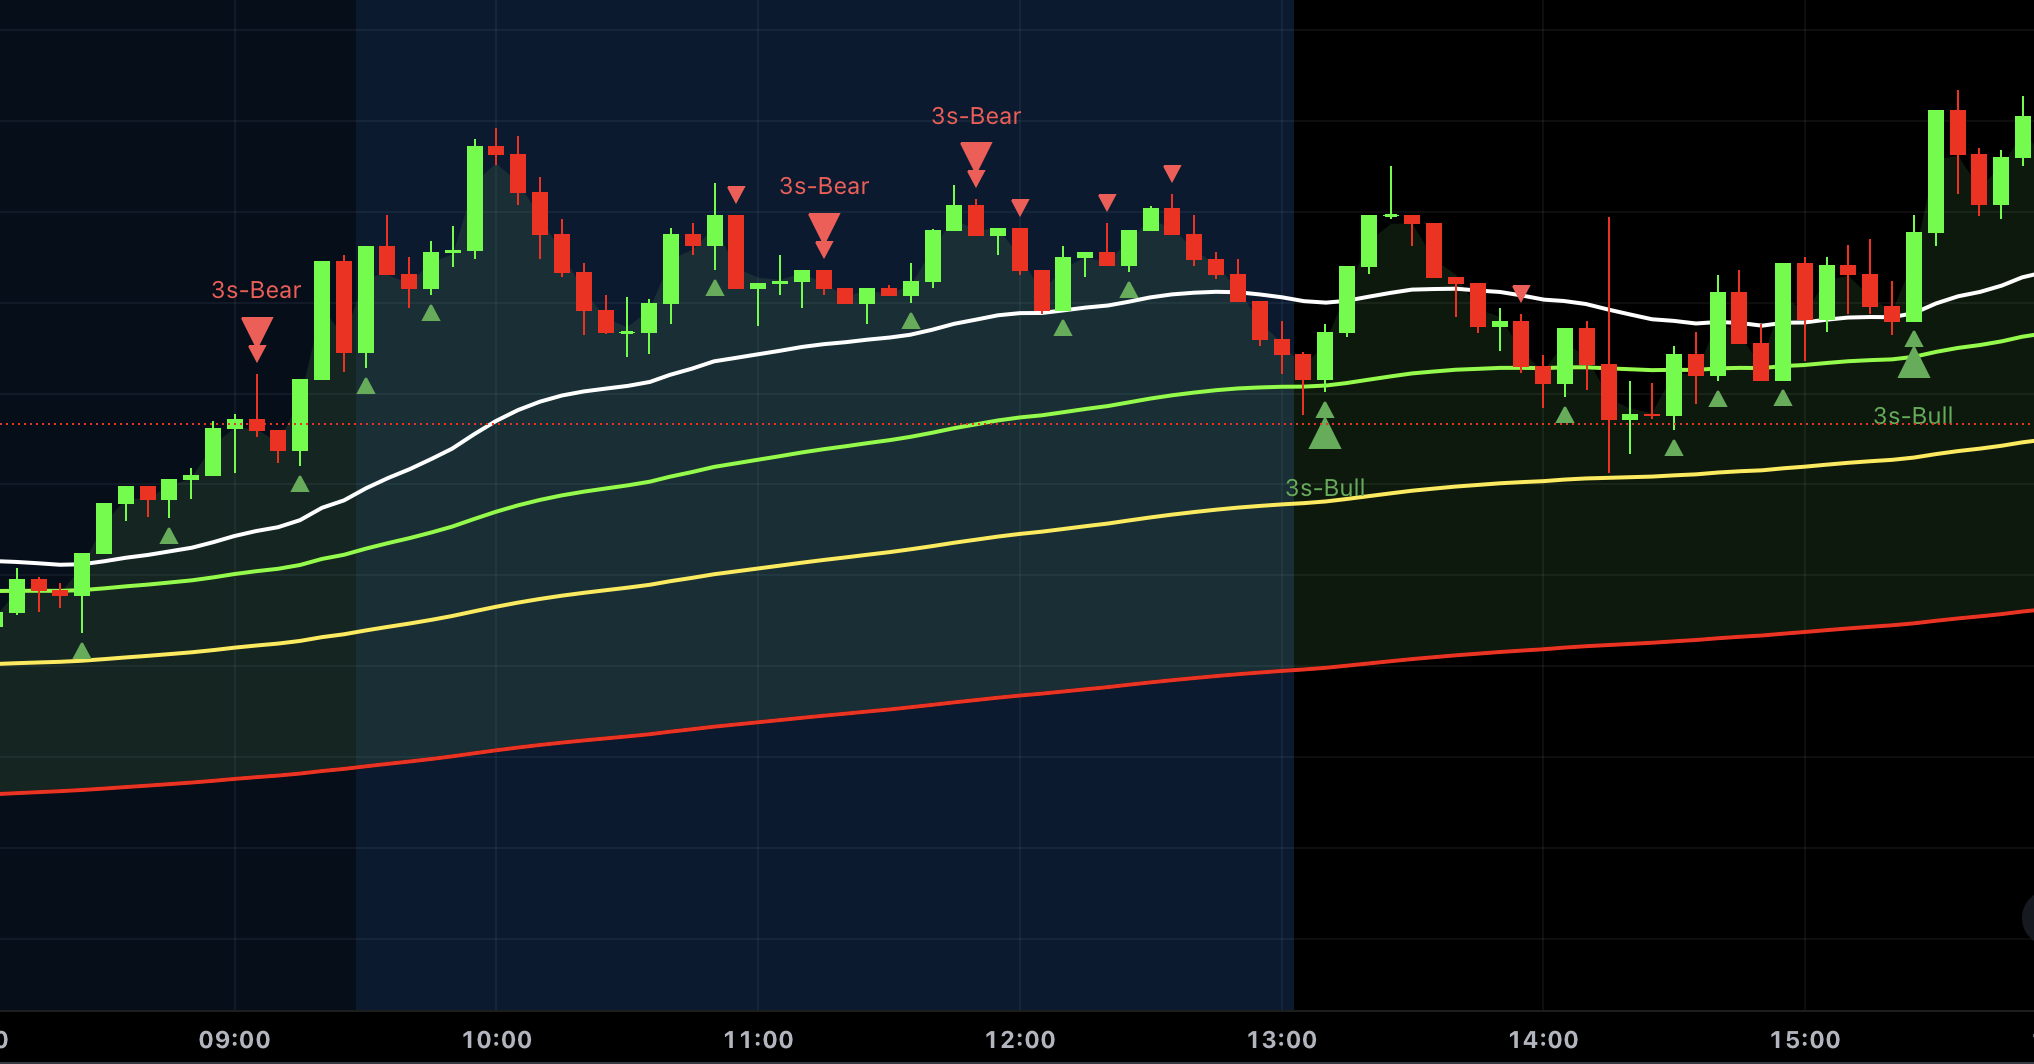
EXAMPLE BELOW TRADES TAKEN on 3s BEAR/BULL
// ### Four Smoothed Moving Averages

len1 = 21
//input(21, minval=1, title="Length 1", group = "Smoothed MA Inputs")
src1 = close
//input(close, title="Source 1", group = "Smoothed MA Inputs")
smma1 = 0.0
sma_1 = sma(src1, len1)
smma1 := na(smma1[1]) ? sma_1 : (smma1[1] * (len1 - 1) + src1) / len1
plot(smma1, color=color.white, linewidth=2, title="21 SMMA")

len2 = 50
//input(50, minval=1, title="Length 2", group = "Smoothed MA Inputs")
src2 = close
//input(close, title="Source 2", group = "Smoothed MA Inputs")
smma2 = 0.0
sma_2 = sma(src2, len2)
smma2 := na(smma2[1]) ? sma_2 : (smma2[1] * (len2 - 1) + src2) / len2
plot(smma2, color=color.new(#6aff00,0), linewidth=2, title="50 SMMA")

h100 = input(title="Show 100 Line", type=input.bool, defval=true, group = "Smoothed MA Inputs")
len3 = 100
//input(100, minval=1, title="Length 3", group = "Smoothed MA Inputs")
src3 = close
//input(close, title="Source 3", group = "Smoothed MA Inputs")
smma3 = 0.0
sma_3 = sma(src3, len3)
smma3 := na(smma3[1]) ? sma_3 : (smma3[1] * (len3 - 1) + src3) / len3
sma3plot = plot(h100 ? smma3 : na, color=color.new(color.yellow,0), linewidth=2, title="100 SMMA")

len4 = 200
//input(200, minval=1, title="Length 4", group = "Smoothed MA Inputs")
src4 = close
//input(close, title="Source 4", group = "Smoothed MA Inputs")
smma4 = 0.0
sma_4 = sma(src4, len4)
smma4 := na(smma4[1]) ? sma_4 : (smma4[1] * (len4 - 1) + src4) / len4
sma4plot = plot(smma4, color=color.new(#ff0500,0), linewidth=2, title="200 SMMA")

// Trend Fill

trendFill = input(title="Show Trend Fill", type=input.bool, defval=true, group = "Smoothed MA Inputs")
ema2 = ema(close, 2)
ema2plot = plot(ema2, color=#2ecc71, transp=100, style=plot.style_line, linewidth=1, title="EMA(2)", editable = false)

fill(ema2plot, sma4plot, color=ema2 > smma4 and trendFill ? color.green : ema2 < smma4 and trendFill ? color.red : na, transp=85, title = "Trend Fill")

// End ###

// ### 3 Line Strike

bearS = input(title="Show Bearish 3 Line Strike", type=input.bool, defval=true, group = "3 Line Strike")
bullS = input(title="Show Bullish 3 Line Strike", type=input.bool, defval=true, group = "3 Line Strike")

bearSig = close[3] > open[3] and close[2] > open[2] and close[1] > open[1] and close < open[1]
bullSig = close[3] < open[3] and close[2] < open[2] and close[1] < open[1] and close > open[1]

plotshape(bullS ? bullSig : na, style=shape.triangleup, color=color.green, location=location.belowbar, size = size.small,  text="3s-Bull", title="3 Line Strike Up")
plotshape(bearS ? bearSig : na, style=shape.triangledown, color=color.red, location=location.abovebar, size = size.small,  text="3s-Bear", title="3 Line Strike Down")

// End ###

//### Engulfing Candles

bearE = input(title="Show Bearish Big A$$ Candles", type=input.bool, defval=true, group = "Big A$$ Candles")
bullE = input(title="Show Bullish Big A$$ Candles", type=input.bool, defval=true, group = "Big A$$ Candles")

openBarPrevious = open[1]
closeBarPrevious = close[1]
openBarCurrent = open
closeBarCurrent = close

//If current bar open is less than equal to the previous bar close AND current bar open is less than previous bar open AND current bar close is greater than previous bar open THEN True
bullishEngulfing = openBarCurrent <= closeBarPrevious and openBarCurrent < openBarPrevious and
   closeBarCurrent > openBarPrevious
//If current bar open is greater than equal to previous bar close AND current bar open is greater than previous bar open AND current bar close is less than previous bar open THEN True
bearishEngulfing = openBarCurrent >= closeBarPrevious and openBarCurrent > openBarPrevious and
   closeBarCurrent < openBarPrevious

//bullishEngulfing/bearishEngulfing return a value of 1 or 0; if 1 then plot on chart, if 0 then don't plot
plotshape(bullE ? bullishEngulfing : na, style=shape.triangleup, location=location.belowbar, color=color.green, size=size.tiny, title="Big Ass Candle Up" )
plotshape(bearE ? bearishEngulfing : na, style=shape.triangledown, location=location.abovebar, color=color.red, size=size.tiny, title="Big Ass Candle Down")

alertcondition(bullishEngulfing, title="Bullish Engulfing", message="[CurrencyPair] [TimeFrame], Bullish candle engulfing previous candle")
alertcondition(bearishEngulfing, title="Bearish Engulfing", message="[CurrencyPair] [TimeFrame], Bearish candle engulfing previous candle")

// End ###

// ### Trading Session

ts = input(title="Show Trade Session", type=input.bool, defval=true, group = "Trade Session")

tz = input(title="Timezone", type=input.string, defval="America/Chicago", options=["Asia/Sydney", "Asia/Tokyo", "Europe/Frankfurt", "Europe/London", "UTC", "America/New_York", "America/Chicago"], group = "Trade Session")
label = input(title="Label", type=input.string, defval="CME Open", tooltip="For easy identification", group = "Trade Session")

startHour = input(title="analysis Start hour", type=input.integer, defval=7, minval=0, maxval=23, group = "Trade Session")
startMinute = input(title="analysis Start minute", type=input.integer, defval=00, minval=0, maxval=59, group = "Trade Session")

startHour2 = input(title="Session Start hour", type=input.integer, defval=8, minval=0, maxval=23, group = "Trade Session")
startMinute2 = input(title="Session Start minute", type=input.integer, defval=30, minval=0, maxval=59, group = "Trade Session")
endHour2 = input(title="Session End hour", type=input.integer, defval=12, minval=0, maxval=23, group = "Trade Session")
endMinute2 = input(title="Session End minute", type=input.integer, defval=0, minval=0, maxval=59, group = "Trade Session")

rangeColor = input(title="Color", type=input.color, defval=#1976d21f, group = "Trade Session")
showMon = input(title="Monday", type=input.bool, defval=true, group = "Trade Session")
showTue = input(title="Tuesday", type=input.bool, defval=true, group = "Trade Session")
showWed = input(title="Wednesday", type=input.bool, defval=true, group = "Trade Session")
showThu = input(title="Thursday", type=input.bool, defval=true, group = "Trade Session")
showFri = input(title="Friday", type=input.bool, defval=true, group = "Trade Session")
showSat = input(title="Saturday", type=input.bool, defval=false, group = "Trade Session")
showSun = input(title="Sunday", type=input.bool, defval=false, group = "Trade Session")

tzYear = year(time, tz)
tzMonth = month(time, tz)
tzDay = dayofmonth(time, tz)
tzDayOfWeek = dayofweek(time, tz)
startTime = timestamp(tz, tzYear, tzMonth, tzDay, startHour, startMinute)
endTime = timestamp(tz, tzYear, tzMonth, tzDay, endHour2, endMinute2)

active = if startTime <= time and time <= endTime and ts
    if tzDayOfWeek == dayofweek.monday and showMon
        true
    else if tzDayOfWeek == dayofweek.tuesday and showTue
        true
    else if tzDayOfWeek == dayofweek.wednesday and showWed
        true
    else if tzDayOfWeek == dayofweek.thursday and showThu
        true
    else if tzDayOfWeek == dayofweek.friday and showFri
        true
    else if tzDayOfWeek == dayofweek.saturday and showSat
        true
    else if tzDayOfWeek == dayofweek.sunday and showSun
        true
    else
        false
else
    false

bgcolor(color=active ? rangeColor : na, title = "Session Background")


startTime2 = timestamp(tz, tzYear, tzMonth, tzDay, startHour2, startMinute2)
endTime2 = timestamp(tz, tzYear, tzMonth, tzDay, endHour2, endMinute2)

active2 = if startTime2 <= time and time <= endTime2 and ts
    if tzDayOfWeek == dayofweek.monday and showMon
        true
    else if tzDayOfWeek == dayofweek.tuesday and showTue
        true
    else if tzDayOfWeek == dayofweek.wednesday and showWed
        true
    else if tzDayOfWeek == dayofweek.thursday and showThu
        true
    else if tzDayOfWeek == dayofweek.friday and showFri
        true
    else if tzDayOfWeek == dayofweek.saturday and showSat
        true
    else if tzDayOfWeek == dayofweek.sunday and showSun
        true
    else
        false
else
    false

bgcolor(color=active2 ? rangeColor : na, title = "Session Background")

// End ###

// eof