Specifiche
Build for MT4. Ask questions if rules don't make sense.
Source code is needed.
Developer must SEND OUR TEAM A SCREENSHOT OF EACH OF THE FOLLOWING: SAMPLE OF EXPERT ADVISOR CODE, DASHBOARD, AND SETTINGS.
Name: TIMENATOR EA ROBOT
Interface with existing MT4 code that does not allow trading (each pair separate setting) on certain days and specific weeks of the year.
The settings interface must be organized with categories in sections.
The settings interface must describe the options in a user-friendly way, describing exactly what will be changed.
Also use drop down menus whenever applicable.
Set this EA up with a high quality, professional look, to sell on the MQL5 store.
NOTE: The following settings are not in the best order and are not always grouped together properly. They should be organized when building the EAs.
Alert Options: Push, Pop Up, Sound off/on, Email
Alert Only Option (no trades placed)
Popup Alert must provide: Current Success Rate in % of USD (last known data), the FOREX pair or instrument, and the time of the alert.
Risk Management Rules
Each strategy has it's own independent risk management settings, but there needs to be an option to reset defaults to only the user's choice of one strategy or to all 3 strategies at the same time.
Trades will not be entered if condition is at 'max risk' in any of the following scenarios.
Maximum Draw down = default of 5.00% -
Maximum Exposure (Open Trades) = equals 3 choices - 1 Total Lots being traded (default = 1.0), 2 Total % of acct. balance (default = 5.00%), 3 Whichever of 1 and 2 hits first.
Maximum Risk Overall n% of Account Balance - NOT equity - TWO decimal places on all EA settings (default = 5.00% - manual or auto adjustable)
Maximum Risk per Trade default = 0.33% - manual entry or auto-adjustable, with the base = n (default is 0.25%)
If Auto is ON, use the following formulas
In real time, as the account grows (minimum growth of n% to activate rules - default of n = 3.00, the amount entered in trades grows by designated percentage of overall growth
The default of the % increased for each trade = 5.00% of the n in line above or a default value of 5.00% of 3.00% which is 0.15% of the CURRENT real time account balance (not equity)
In real time, after each loss, as the account draws down (NO minimum % required to activate rules), the amount entered in trades shrinks by a designated percentage of the last trade (loss)
NOTE: This 'last trade lost' must supersede the calculation of any gains or wins - first calculate the loss formula below
The default n% after a loss is calculated in a different way, where the amount of the current balance which is used to calculate the trades is artificially decreased by n % of the n of trades lost
The default for n% = 125.00% of the USD amount of the chosen number of most recent losses and the default for most recent n of trades-for-a-loss = 2 (they need not be consecutive... wins can be between the losses)
However, a loss cannot be counted twice, so no overlap should occur - once calculated, those losses cannot be used again.
Selection of Pairs Options: 28 pairs, 7 majors, High Tick Value, Custom (or manual entry, which can include any pair, metal, crypto, etc offered by user's broker)
High Tick Value Pairs = AUDCAD, AUDCHF, AUDUSD, CADCHF, EURCAD, EURCHF, EURGBP, EURUSD, GBPCHF, GBPUSD, NZDCAD, NZDUSD, USDCAD, USDCHF
Strategy One (buys - make sells the opposite of all below)
Options (drop down menu, whenever possible)
Only Buy, Only Sell, Buy or Sell (Manual)
Daily Time Frame - 50 is above 200 and separated by n pips = buy, 50 is below 200 and EMAs are separated by n pips = sell (default for n = 21)
Search for the following conditions simultaneously in any one or of all the time frames chosen by the user on all selected pairs - 1M, 5M, 15M, 30M, 1HR, 4HR, Daily, Weekly, Monthly
1. 200 EMA is flat (in price - fluctuating no more than n pips (default of n = 1) of price for n candles' closing price (default of n = 21)
2. Enter a buy:
when both the 20 EMA & 50 EMA cross above the recently flat 200 EMA after minimum number of n candles of the 'flat' 200 area (default of n = 7) OR
when the 50 and 20 EMAs (option A = cross within n pips option B = either EMA comes within) n pips of the flat 200 and stay above the 200 for n consecutive candles
(defaults are 7 pips and 10 candles) OR
when the 18 to 22 EMA band (default = 18,20) & the 50 EMA cross above...
(NOTE: user can choose to use one of these three or choose the "first method that "works" and initiates a trade)
n attempts are made for trade entry, because the market might be choppy (default = 4 attempts); only n trade(s) for each time frame is allowed to be open (default of n = 1)
3. Stop loss is n pips below the following a-d (default of n = 2):
a. the lowest low of the previous n candles (default of n = 5)
b. % of the ATR of the period traded -- independent of any open chart's current time frame. Example: 2.0 = 200%, 0.5 = 50%
c. the candle on which the trade was entered
d. whichever of a - c. occurs first
4. Take profit - choose to close trade when
a. the 20 crosses the 200 and remains below for n candles (default of n = 7) "Remains below" can be disabled.
b. the 50 crosses the 200 and remains below for n candles (default of n = 5)
c. both the 20 and 50 cross and both remain below for n candles (default of n = 10)
d. Factor of ATR (2.0 = 200%) is hit -- of the same time frame candle of the open trade (reminder - always independent of open charts)
5. RR Ratio factor n (default of n = 10)
Strategy Two (sells - create buy code as the opposite of all below)
Search for the following conditions simultaneously in any one or of all the time frames chosen by the user - 1M, 5M, 15M, 30M, 1HR, 4HR, Daily, Weekly, Monthly1. Enter a sell when price crosses the 800 EMA and all three, the 20, 50, and 200 are below the 800 in decreasing order - 20 is below 50 is below 200 is below 800
2. The stop loss choices are *move stop loss temporarily to breakeven, whenever n% of the following TP events have been reached (default of n = 70%)
a. ATR of a candle of the time frame being traded with variable factor entry (2.0 = 200% of the ATR, 0.5 = 50%) << Weekly and Monthly entries only use this ATR Config.
b. n pips above 800 EMA (default of n = 33.0)
c. n pips above the highest high of the last n candles (defaults: 5 pips, 30 candles)
d. whichever of the above a-c is hit first
e. whichever of the above a-c is hit second
3. Take profit when: * Weekly and Monthy trades use ATR% (default = 500.00% displayed in ATR setting as 5.00)
a. Yesterday's LOD is hit (only if n pips have been gained - default of n = > 40 for 1M, 5M, 15M, 80 for 1H, 240 for H4, 960 for Daily, - Do not use this feature for monthly or weekly trades)
b. n% of ATR for candle is reached (default = 95%, only if n pips gained on trade is min. = > 40 for 1M, 5M, 15M, 80 for 1H, 240 for H4, 960 for Daily, - Do not use this feature for monthly or weekly trades)
c. trade gains achieved in pips:40 for 1M, 5M, 15M, 80 for 1H, 240 for H4, 960 for Daily time-frame entry, - Do not use this feature for monthly or weekly trades)
d. trade rallies to n% of distance between today's HOD and the LOD so far for 1M, 5M, 15M, 30M
between today's HOW high of the week for 1H, 4H (default of n = 34%)
between today's HOM high of the month for W and M
e. whichever a-c,d is hit first
f whichever a-c,d is hit second
Strategy Three (same as 1 but entry is different - sell is opposite)
1. Enter buy limit order when bottom of green closing candle is n1 maximum pips away from 20 EMA, is n2 pips high and engulfs previous candle. Order is placed at the n3 % of candle (bottom = 0%), and the SL n4 pips below same candle.
Defaults:
n1 = 3
n2 = 3 for M1, 7 for M5 Charts, 16 for 15M, 35 for 1H Charts (I may need to change the code on these settings after I get the EA.)
n3 = 55%
n4 = 2
Default Template ON/OFF
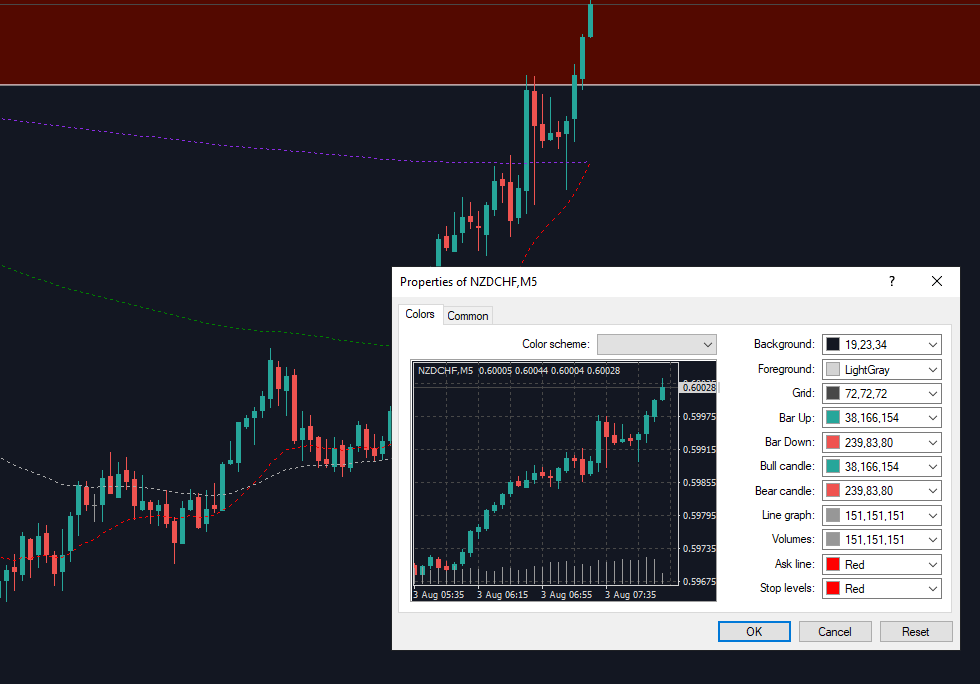
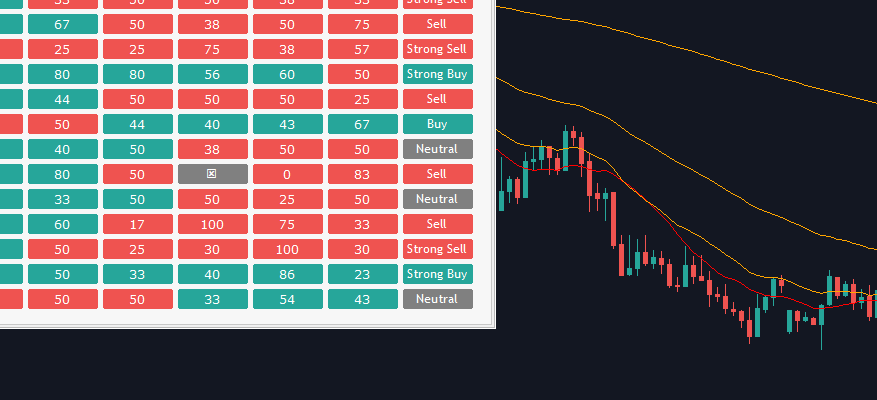
DASHBOARD (display all in real time and send to an organized log file... capable of exporting to Excel) The dashboard must be 'clean' and professional, using greens and reds that have been attached. A template will be provided for the programmer.
User can change colors of EMAs and switch to SMAs if they wish.
Dashboard Colors match default candles (see 2nd image)
RISK LEVEL is green box if no risk, yellow box if at n% of max any max. risk parameters (default of n = 75%), red box if any max risk is hit.
Current Increased % Adjustment of Trades for the Day | Decreased % Adjustment of Balance (Artificial) for the Day (cumulative from midnight to midnight New York Time)
Current Increased % Adjustment of Trades for the Week | Decreased % Adjustment of Balance (Artificial) for the Week (cumulative)
Last 25 trades
[for each strategy]
Win/Loss Ratio of today (midnight NY time), current week, and current month -- example Win/Loss: 5/2
Success Rates based on USD earned versus USD lost: today, current week, current month -- example: 72.0% Success Rate (= trades won amt. $720.00 / trades lost amt. $280.00)
Entry Lot Size | Entry Price Exit | Price Pips Lost/Gained - Red or Green -
Profit/Loss for the day (Midnight to Midnight New York Time) << for each strategy and the totals for all combined
Profit Loss for the week (regular market open close hours) << for each strategy and the totals for all combined
Display the Current Time Windows for each trade to open (4 windows of time per day for each of the 3 strategies)
Dashboard can be move with a mouse on the screen or 'pop' to one of the 4 corners of choice (default = bottom left), along with distance from edges x and y settings (default = 5)
Reset Dashboard Button
-----------------------------------------------
A few tweaks possible during final discussion before work begins.
It's important that the programmer not do work contrary to the instructions if they are not qualified to do the work in the manner requested. Instead, admit that the work is beyond their ability to prevent a misunderstanding and willingness to work it out.