 Tutti gli ordini
 Regolamenti
Lavoro terminato

Specifiche
Please use version of indicator (Price action candle, Pin bar) which was delivered in https://www.mql5.com/en/job/123652
***Area to Trade:
Input: Time frame (1w/1d/4hr) Drop down menu
Zig zag parameter is used (default 5,3,2),
From last closed price, Scan back for two zig zag low/high above last closed candle price. Among two zig zag low/high identified, considered one close to last closed candle price as resistance
From last closed price, Scan back for two zig zag low/high below last closed candle price. Among two zig zag low/high identified, considered one close to last closed candle price as support
Other important point while drawing area of trade.
When an inverted V is formed with zigzag, then it will be considered as zigzag high
When an V is formed with zigzag, then it will be considered as zigzag Low
While marking zigzag low as area of trade, make zig zag candle tail (lower shadow ) as area of trade
While marking zigzag low as area of trade, make zig zag candle nose (Upper shadow ) as area of trade
Resistance price area to be marked with RED colour till current candle.
Support Price area to be marked with Green Colour till current candle.
Mark R1,R2 in chart for considered zig high/low for resistance
Mark S1,S2 in chart for considered zig high/low for Support
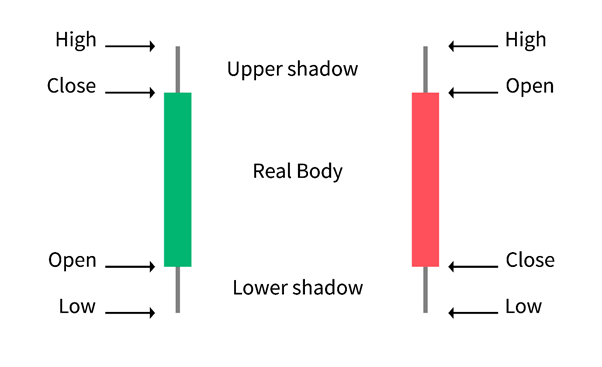
**As part of this job, please use attached Indicator for ATR_Trailing_Overlay. This must be applied for trade initiation logic. Use this indicator in trade initiation timeframe.
Area of trade -its own time frame , usually higher timeframe
All other indicator -use trade initiation timeframe.
EA Logic:
Indicator to use: Zig Zag,ATR, ATR_Trailing_Overlay
Parameters: Timeframe to trade (1hr/1 day,1 week etc) - Drop down, Volume to trade ,Zig Zag input, ATR input , ATR_Trailing_Overlay
Trade initiation
Sell Trade:
Rule 1: Last Closed candle should be traded in trade zone and closed below trade zone.
Rule 2: Last closed candle should be bearish pin bar candle or sell price action candle.
***Rule 3: ATR_Trailing_Overlay must be sell ( above current candle)
Rule 4: Risk (current trade price to Stoploss)< n times of reward (reward = first Zig zag High or low below Trade price by scanning 30 candles(input -30 default))
if there is no Zig zag found below trade price after scanning 30 candles, Considered Rule 3 is met/true.
Stop loss line:
We draw two stop loss as per below logic:
When a Sell price action candle or bearish pin bar is formed, high of that candle is marked as stoploss. This line needs to be checked at close of each candle and need to redraw till trade is active. This stoploss line is called End of day stoploss.
** Intraday stoploss is calculated as end of day stoploss + n times of ATR value of last closed candle) n here is input
***New parameter added for end of day : Shift Stop line:
Example: shift stoploss: 1
When a Sell price action candle is formed , previous candle (just one candle) from price action candle high is marked as stoploss.
shift stoploss: 2
When a Sell price action candle is formed, second last candle (one candle prior) from price action candle high is marked as stoploss.
Stoploss logic Execution.
When a candle is closed above End of day stoploss or when a price reach is intraday stoploss , whichever happens first is stoploss.
Trade closure.
Risk is calculated when trade is opened , only once for a trade
Risk = Absolute ( trade open price -Stoploss price )
Tarde closure Price =trade price - n times of risk
Buy Trade :
Rule 1: Last Closed candle be traded in trade zone and closed above trade zone.
Rule 2: Last closed candle should be bullish pin bar candle or Buy price action candle.
**Rule 3: ATR_Trailing_Overlay must be Buy (below current candle)
Rule 4: Risk (current trade price to Stoploss)< n times of reward (reward = first Zig zag High or low above Trade price by scanning 30 candles(input -30 default))
if there is no Zig zag found below trade price after scanning 30 candles, Considered Rule 3 is met/true.
Stop loss line:
We draw two stop loss as per below logic:
When a Buy price action candle or bullish pin bar is formed, Low of that candle is marked as stoploss. This line needs to be checked at close of each candle and need to redraw till trade is active. This stoploss line is called End of day stoploss.
** Intraday stoploss is calculated as End of day stoploss price - n times of ATR value of last closed candle) n here is input
***New parameter added : Shift Stop line:
Example: shift stoploss: 1
When a buy price action candle is formed , previous candle low (just one candle) from price action candle is marked as stoploss.
shift stoploss: 2
When a Buy price action candle is formed, second last candle low (one candle prior) from price action candle is marked as stoploss.
Stoploss logic Execution.
When a candle is closed below End of day stoploss or when a price reach is intraday stoploss , whichever happens first is stoploss.
Trade closure.
Risk is calculated when trade is opened , only once for a trade
Risk = Absolute ( trade open price -Stoploss price )
Tarde closure Price =trade price + n times of risk
Chart visualization:
For Buy price action candle, Mark upper arrow mark in green.
For Sell price action candle, Mark Down arrow mark in Red.
For bullish pin bar candle, Mark upper arrow mark in green(make a differnt arrow mark ).
For bearish pin bar candle, Mark Down arrow mark in Red(make a differnt arrow mark ).
Both Stop loss lines should be drawn on chart.
Reward line should be drawn on chart(blue color)
Last closed Candle analysis:
Time :
Price Action : Buy/Sell/Nil
Pinbar : Bullish/Bearish/Nil
**Risk Reward: Met/Not Met
**ATR : Sell/Buy
Breakout of Area of Trade : Buy/Sell/Nil
Trade Analysis:
Trade Entry Time:
Trade Entry Price:
Risk :
Reward:
Risk to Reward:
Candle Formation:
Breakout of Trade Area:
Intial EOD Stoploss:
Intial intraday Stoploss:
Current EOD Stoploss:
Intial EOD intraday Stoploss:
Trade Closure price:
.