 MetaTrader 5
 Sistemi Esperti
 Indicatori
 Script
 Librerie
 Archiviazione
Unisciti alla nostra fan page

VSA Glossary - indicatore per MetaTrader 5

- Visualizzazioni:
- 154
- Valutazioni:
- Pubblicato:
-
 Ti stai perdendo delle opportunità di trading:
- App di trading gratuite
- Oltre 8.000 segnali per il copy trading
- Notizie economiche per esplorare i mercati finanziari
Registrazione AccediAccetti la politica del sito e le condizioni d’uso
Se non hai un account, registrati -
 Hai bisogno di un robot o indicatore basato su questo codice? Ordinalo su Freelance
Vai a Freelance
Hai bisogno di un robot o indicatore basato su questo codice? Ordinalo su Freelance
Vai a Freelance
-
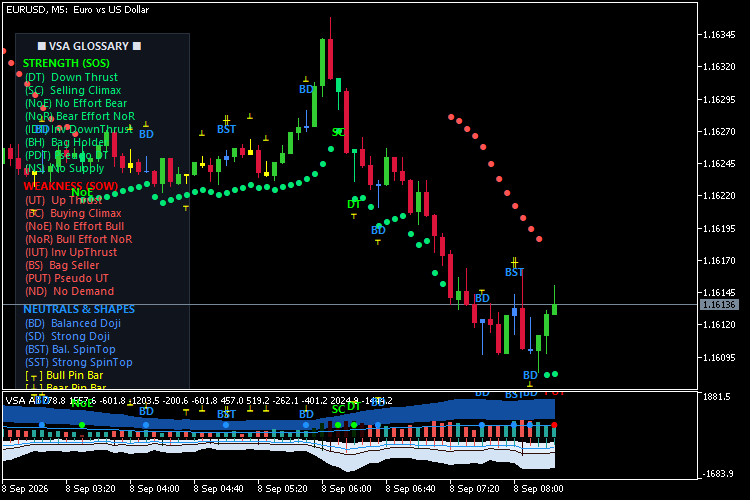
Codifica cromatica nativa delle candele: colorazione diretta delle barre sul grafico principale in base alla conferma del volume istituzionale:
-
Verde (SOS): Segno confermato di forza (ad es. Down Thrust / Spring, Selling Climax, Bag Holder, No Supply).
-
Rosso (SOW): Segno confermato di debolezza (ad es. Up Thrust, Buying Climax, Bag Seller, No Demand).
-
Blu (Neutro): Doji e Spinning Top che indicano equilibrio / consolidamento.
-
Giallo (forme pure): classici pattern di price action senza estremi di volume.
-
-
Punti di tendenza dinamici in stile VSA SAR: punti di trend/trailing stop che seguono l’andamento come un SAR parabolico, ma si invertono, si restringono o accelerano dinamicamente in base all’esaurimento degli acquisti e delle vendite istituzionali.
-
Tooltip al passaggio del mouse (solo barre chiuse): passando il mouse su qualsiasi etichetta di segnale viene visualizzato il contesto istituzionale (tempo della barra, volume esatto rispetto al moltiplicatore della media mobile, spread e reazione di mercato prevista).
-
Glossario nella torre a sinistra: un HUD verticale sul grafico che mostra il nome abbreviato e quello completo di ogni pattern.
-
Layout a doppia direzione:
-
Barre di volume: colonne con gradazione di colore che salgono verso l’alto partendo da zero, con nuvole di riempimento dello sfondo di colore blu scuro che vanno da “High” a “Ultra”.
-
Barre dello spread: linee di intervallo invertite che si proiettano verso il basso a partire da zero con nuvole di riempimento in azzurro ghiaccio chiaro, ridimensionate automaticamente in base al volume.
-
-
Punti di segnale sulla linea di base: indicatori visivi tracciati lungo la linea dello zero per indicare a colpo d’occhio i tipi di segnale.
-
Badge di previsione delle barre in tempo reale: etichette dinamiche color verde-azzurro posizionate a circa 1 pollice dalla candela in tempo reale, che mostrano la percentuale di tempo trascorso dalla barra e il volume/spread previsto rispetto alla media mobile attiva.
Tradotto dall’inglese da MetaQuotes Ltd.
Codice originale https://www.mql5.com/en/code/77119
 Portfolio Allocation Planner — budget-to-lots dashboard and CSV
Before configuring a basket, see which target weights fit your broker's minimum lots. Portfolio Allocation Planner turns an explicit hypothetical notional budget and percentages into a chart table: minimum-lot notional, lots rounded down, calculated allocation, target shortfall and row status. Recalculate on demand, inspect row tooltips, paginate longer lists, and optionally export the displayed snapshot to CSV. No trades are sent and no account balance, equity or positions are read.
 Broker Basket Preflight — read-only contract and minimum-volume diagnostics
Read-only MT5 script for exact Market Watch symbols: contract and volume rules, quote age and spread, isolated BUY/SELL margin, one-tick price moves and spread-only results in account currency. MIT source; Experts journal output.
Session Manipulation and Algorithmic Reaction Tracker
Sessione ICT/SMC con barra chiusa – scanner di liquidità per tre simboli, con MSS confermati, ritest FVG, proiezioni rischio/rendimento e contesto macroeconomico opzionale.
Risk-Based Lot Size Calculator Script with On-Chart Panel
Calculates the lot size for a chosen risk percent and stop loss distance, and shows the result in a clean panel on the chart.