|
5+ years
experience
|
30
products
|
56
demo versions
|
|
0
jobs
|
0
signals
|
0
subscribers
|
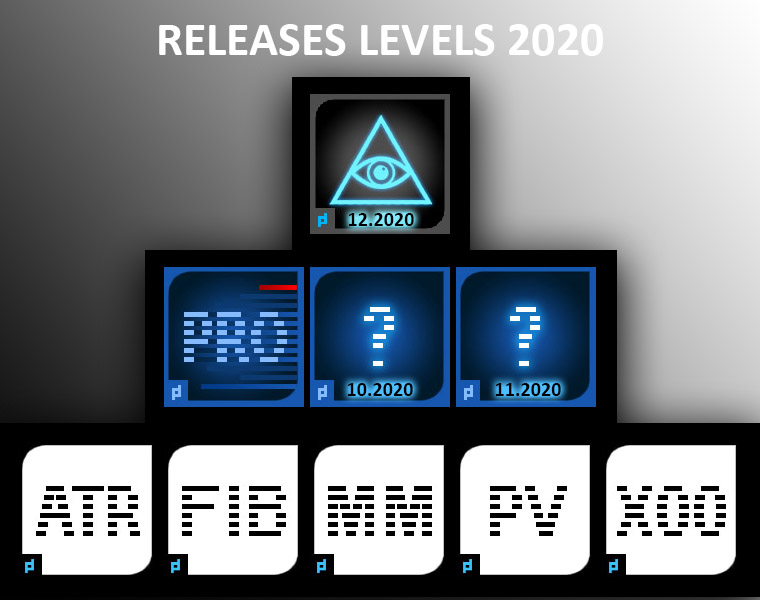
UPD1 MT4 Indicators - https://www.mql5.com/en/market/mt4/indicator?filter=UPD1
Levels
Patterns
Volume
Money Management
__________________
The grail is out there
I want to believe
Levels
Patterns
Volume
Money Management
__________________
The grail is out there
I want to believe


Vitaliy Kuznetsov


· 2
dbenie2
2021.11.18
Can I pay you to make a multi-pair and multi timeframe (H1,H4,D1) dashboard for this impulse channel?