Young Ho Seo / Profil
- Bilgiler
|
10+ yıl
deneyim
|
62
ürünler
|
1182
demo sürümleri
|
|
4
işler
|
0
sinyaller
|
0
aboneler
|
Harmonic Pattern Indicator - Repainting + Japanese Candlestick Pattern Scanner + Automatic Channel + Many more
https://www.mql5.com/en/market/product/4488
https://www.mql5.com/en/market/product/4475
https://algotrading-investment.com/portfolio-item/harmonic-pattern-plus/
Non Repainting and Non Lagging Harmonic Pattern Indicator – Customizable Harmonic + Japanese Candlestic Pattern Scanner + Advanced Channel + Many more
https://www.mql5.com/en/market/product/41993
https://www.mql5.com/en/market/product/41992
https://algotrading-investment.com/portfolio-item/profitable-pattern-scanner/
Supply Demand Indicator – Multiple Timeframe Scanning Added + Non Repainting + Professional Indicator
https://www.mql5.com/en/market/product/40076
https://www.mql5.com/en/market/product/40075
https://algotrading-investment.com/portfolio-item/ace-supply-demand-zone/
Momentum Indicator – Path to Volume Spread Analysis
https://www.mql5.com/en/market/product/30641
https://www.mql5.com/en/market/product/30621
https://algotrading-investment.com/portfolio-item/excessive-momentum-indicator/
Elliott Wave Indicator for the Power User
https://www.mql5.com/en/market/product/16479
https://www.mql5.com/en/market/product/16472
https://algotrading-investment.com/portfolio-item/elliott-wave-trend/
Forex Prediction - Turn Support and Resistance to the Advanced Strategy
https://www.mql5.com/en/market/product/49170
https://www.mql5.com/en/market/product/49169
https://algotrading-investment.com/portfolio-item/fractal-pattern-scanner/
MetaTrader 4 and MetaTrader 5 Product Page: https://www.mql5.com/en/users/financeengineer/seller#products
Free Forex Prediction with Fibonacci Analysis: https://algotrading-investment.com/2020/10/23/forex-prediction-with-fibonacci-analysis/
Free Harmonic Pattern Signal: https://algotrading-investment.com/2020/12/17/harmonic-pattern-signal-for-forex-market/
============================================================================================================================
Here are the trading education books. We recommend reading these books if you are a trader or investor in Forex and Stock market. In the list below, we put the easy to read book on top. Try to read the easy to read book first and try to read the harder book later to improve your trading and investment.
First Link = amazon.com, Second Link = Google Play Books, Third Link = algotrading-investment.com, Fourth Link = Google Books
Technical Analysis in Forex and Stock Market (Supply Demand Analysis and Support Resistance)
https://www.amazon.com/dp/B09L55ZK4Z
https://play.google.com/store/books/details?id=pHlMEAAAQBAJ
https://algotrading-investment.com/portfolio-item/technical-analysis-in-forex-and-stock-market/
https://books.google.co.kr/books/about?id=pHlMEAAAQBAJ
Science Of Support, Resistance, Fibonacci Analysis, Harmonic Pattern, Elliott Wave and X3 Chart Pattern (In Forex and Stock Market Trading)
https://www.amazon.com/dp/B0993WZGZD
https://play.google.com/store/books/details?id=MME3EAAAQBAJ
https://algotrading-investment.com/portfolio-item/science-of-support-resistance-fibonacci-analysis-harmonic-pattern/
https://books.google.co.kr/books/about?id=MME3EAAAQBAJ
Profitable Chart Patterns in Forex and Stock Market (Fibonacci Analysis, Harmonic Pattern, Elliott Wave, and X3 Chart Pattern)
https://www.amazon.com/dp/B0B2KZH87K
https://play.google.com/store/books/details?id=7KrQDwAAQBAJ
https://algotrading-investment.com/portfolio-item/profitable-chart-patterns-in-forex-and-stock-market/
https://books.google.com/books/about?id=7KrQDwAAQBAJ
Guide to Precision Harmonic Pattern Trading (Mastering Turning Point Strategy for Financial Trading)
https://www.amazon.com/dp/B01MRI5LY6
https://play.google.com/store/books/details?id=8SbMDwAAQBAJ
http://algotrading-investment.com/portfolio-item/guide-precision-harmonic-pattern-trading/
https://books.google.com/books/about?id=8SbMDwAAQBAJ
Scientific Guide to Price Action and Pattern Trading (Wisdom of Trend, Cycle, and Fractal Wave)
https://www.amazon.com/dp/B073T3ZMBR
https://play.google.com/store/books/details?id=5prUDwAAQBAJ
https://algotrading-investment.com/portfolio-item/scientific-guide-to-price-action-and-pattern-trading/
https://books.google.com/books/about?id=5prUDwAAQBAJ
Predicting Forex and Stock Market with Fractal Pattern: Science of Price and Time
https://www.amazon.com/dp/B086YKM8BW
https://play.google.com/store/books/details?id=VJjiDwAAQBAJ
https://algotrading-investment.com/portfolio-item/predicting-forex-and-stock-market-with-fractal-pattern/
https://books.google.com/books/about?id=VJjiDwAAQBAJ
Trading Education Book 1 in Korean (Apple, Google Play Book, Google Book, Scribd, Kobo)
https://books.apple.com/us/book/id1565534211
https://play.google.com/store/books/details?id=HTgqEAAAQBAJ
https://books.google.co.kr/books/about?id=HTgqEAAAQBAJ
https://www.scribd.com/book/505583892
https://www.kobo.com/ww/en/ebook/8J-Eg58EDzKwlpUmADdp2g
Trading Education Book 2 in Korean (Apple, Google Play Book, Google Book, Scribd, Kobo)
https://books.apple.com/us/book/id1597112108
https://play.google.com/store/books/details?id=shRQEAAAQBAJ
https://books.google.co.kr/books/about?id=shRQEAAAQBAJ
https://www.scribd.com/book/542068528
https://www.kobo.com/ww/en/ebook/X8SmJdYCtDasOfQ1LQpCtg
About Young Ho Seo
Young Ho Seo is an Engineer, Financial Trader, and Quantitative Developer, working on Trading Science and Investment Engineering since 2011. He is the creator of many technical indicators, price patterns and trading strategies used in the financial market. He is also teaching the trading practice on how to use the Supply Demand Analysis, Support, Resistance, Trend line, Fibonacci Analysis, Harmonic Pattern, Elliott Wave Theory, Chart Patterns, and Probability for Forex and Stock Market. His works include developing scientific trading principle and mathematical algorithm in the work of Benjamin Graham, Everette S. Gardner, Benoit Mandelbrot, Ralph Nelson Elliott, Harold M. Gartley, Richard Shabacker, William Delbert Gann, Richard Wyckoff and Richard Dennis. You can find his dedicated works on www.algotrading-investment.com . His life mission is to connect financial traders and scientific community for better understanding of this world and crowd behaviour in the financial market. He wrote many books and articles, which are helpful for understanding the technology and application behind technical analysis, statistics, time series forecasting, fractal science, econometrics, and artificial intelligence in the financial market.
If you are interested in our software and training, just visit our main website: www.algotrading-investment.com
Young Ho Seo
USDJPY Market Outlook - 9 Nov 2017
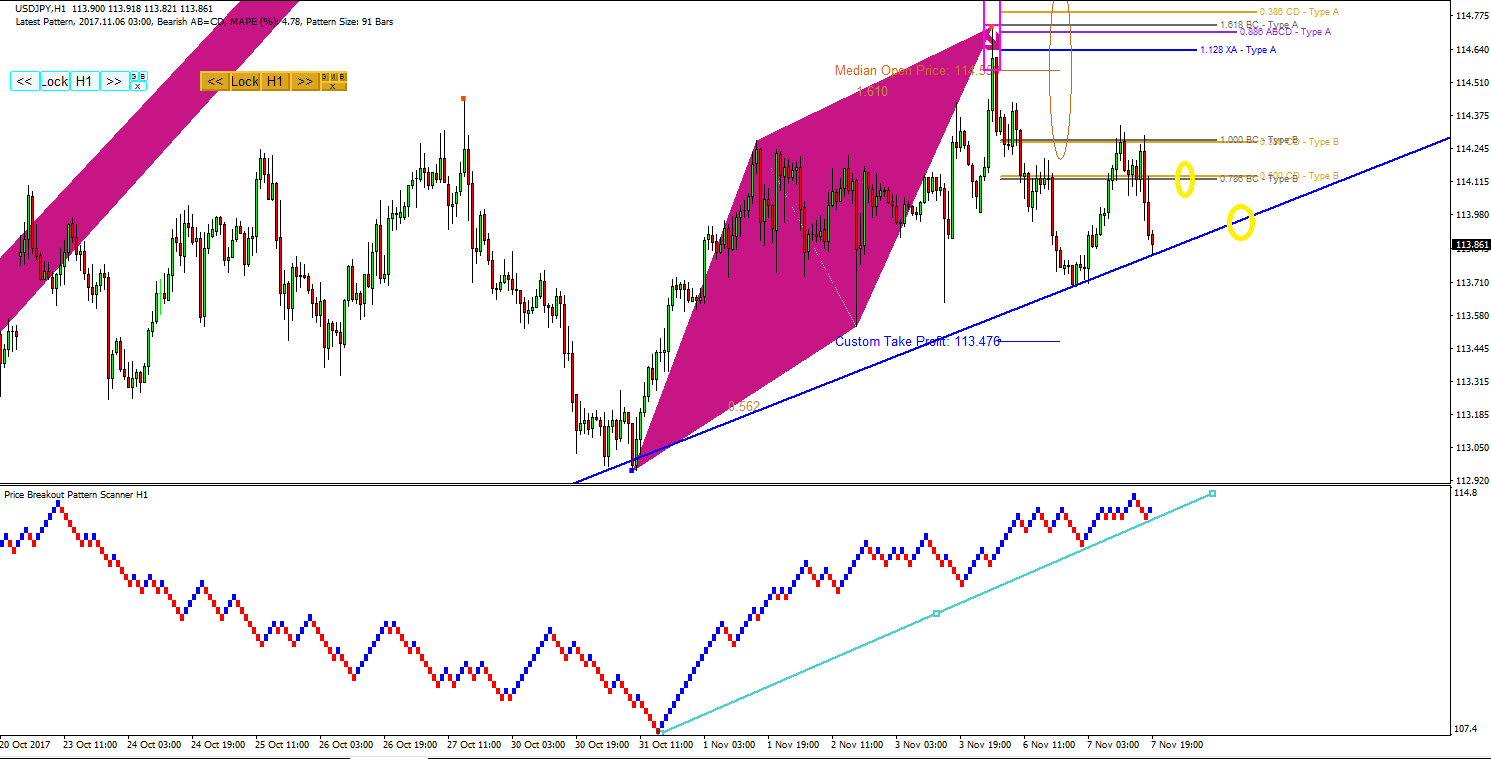
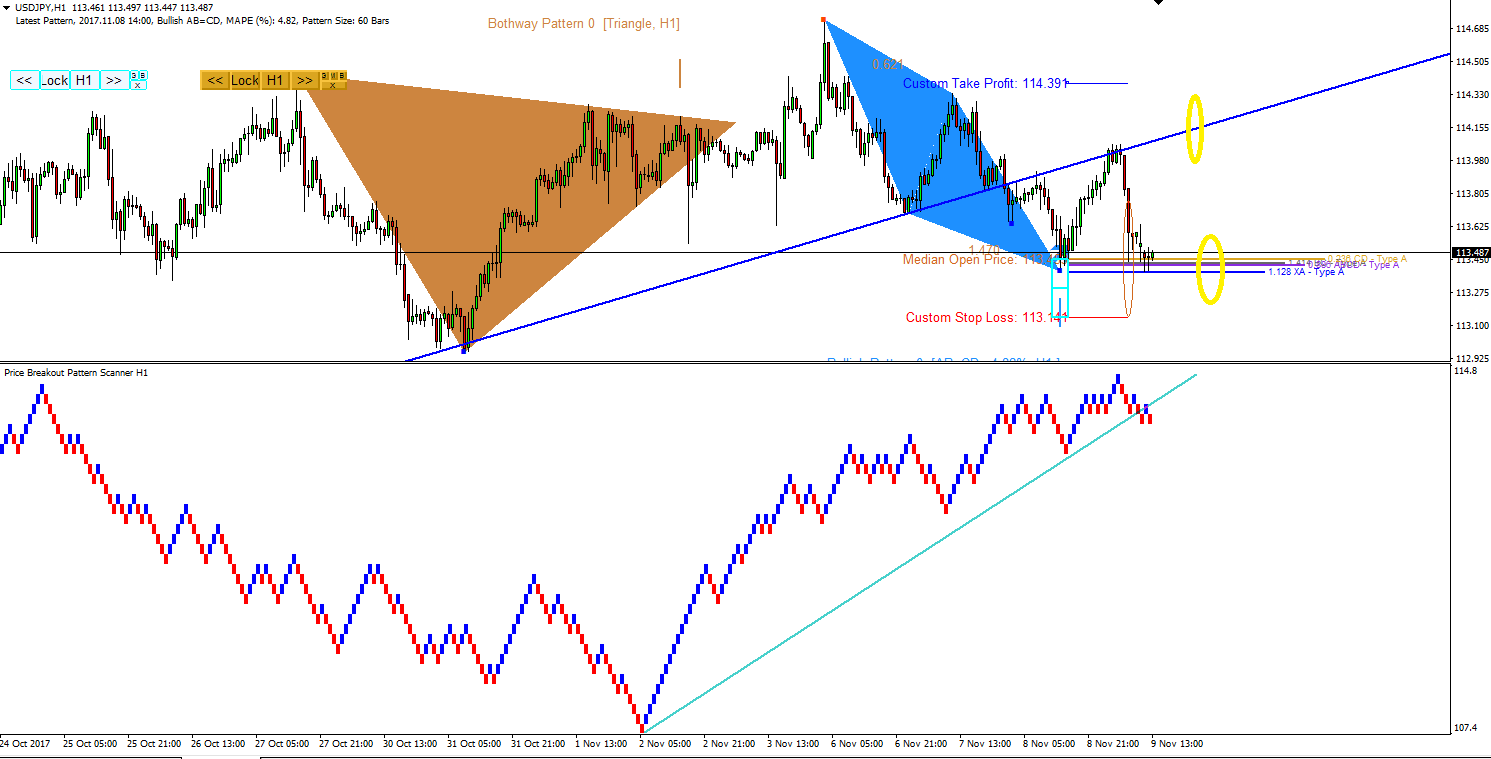
USDJPY made a beautiful turn today at the slope we have mentioned earlier. Currently it is testing the PRZ Type A level for the ABCD pattern formed earlier. Please note that the PRZ Type A can always act as an important support and resistance levels just like PRZ Type B level. Current analysis was done with harmonic pattern plus and price breakout pattern scanner together. In terms of renko view, we are having one bearish brick.
http://algotrading-investment.com/portfolio-item/harmonic-pattern-plus/
http://algotrading-investment.com/portfolio-item/price-breakout-pattern-scanner/
https://www.mql5.com/en/users/financeengineer/seller#products

Young Ho Seo
Price Breakout Pattern Scanner and Smart Renko
In the last post, we have shown you how to switch on and off many features in our Smart Renko.
https://algotradinginvestment.wordpress.com/2017/07/15/simple-instruction-on-smart-renko/
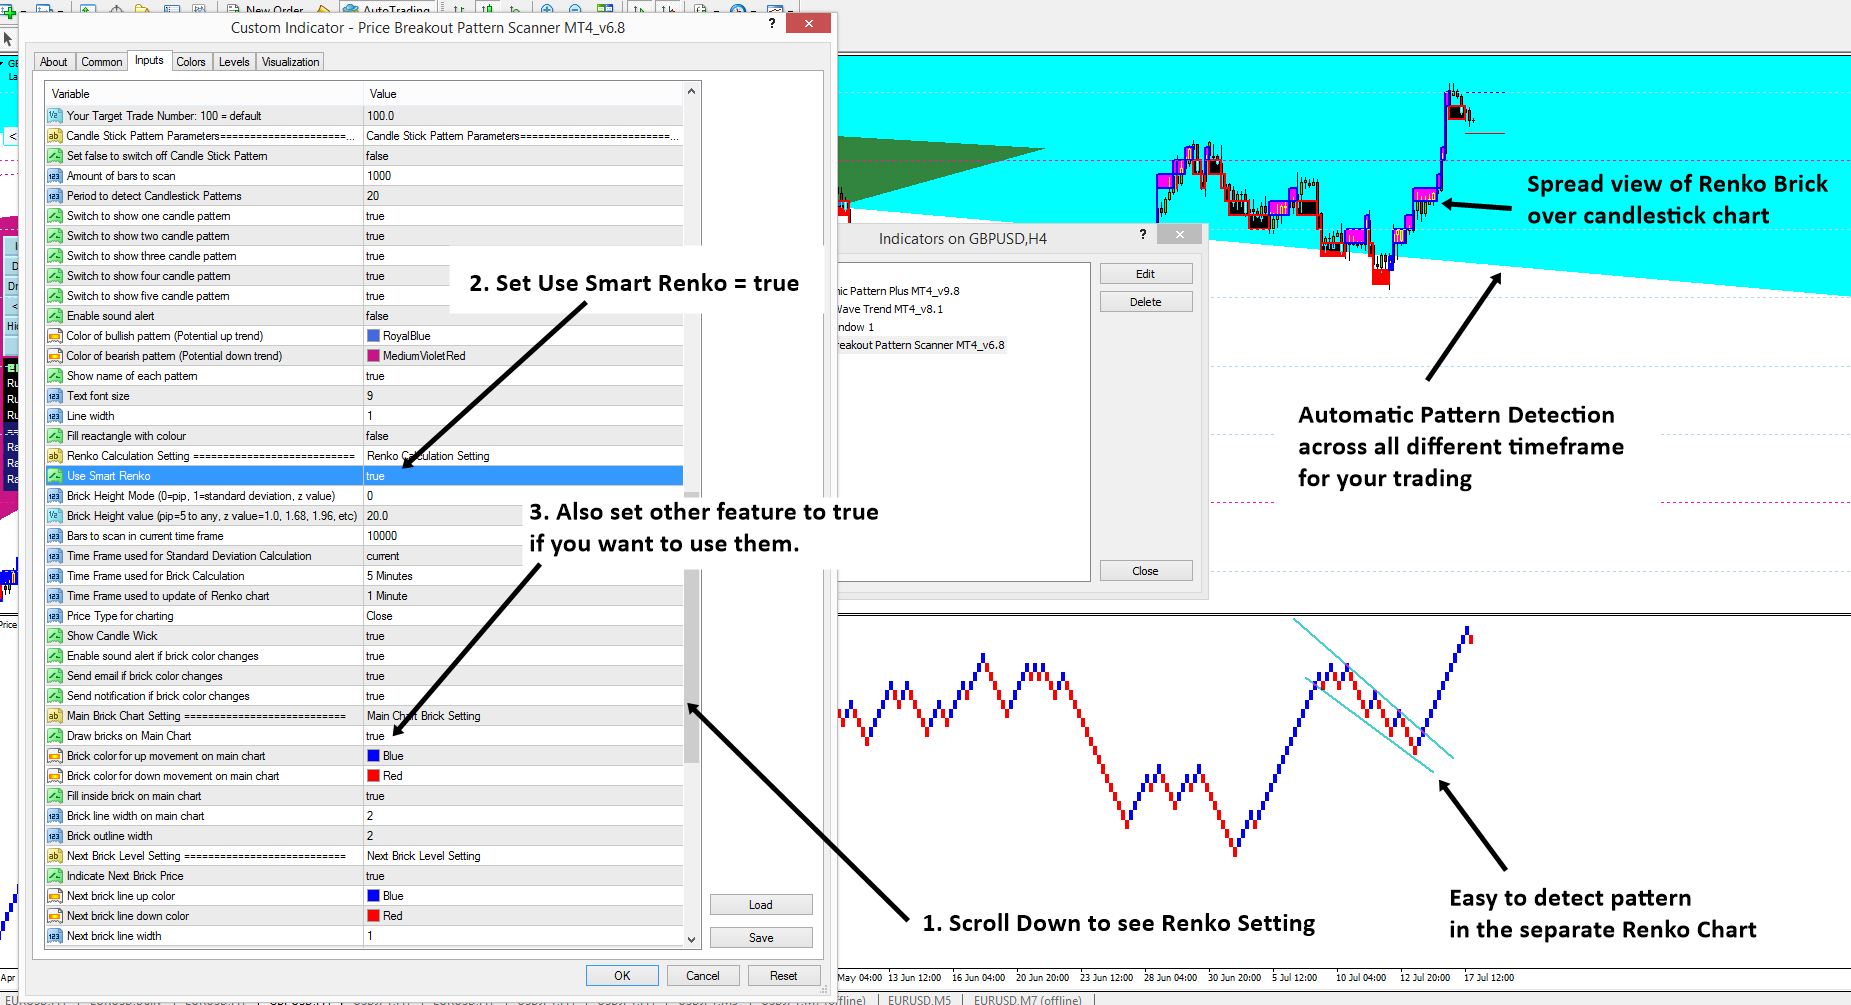
Our Price breakout pattern scanner is very unique tool in the market because it have built in feature for Smart Renko inside. There is reason for that. Smart Renko is really helpful for any pattern detection in the separate window. So they will rainforce your trading decision. Imagine that in the candlestick chart, Price Breakout Pattern Scanner is automatically detecting the patterns for you. In the indicator window, you can also detect any other important patterns readily. If you can collect evidence for your trading from both candlestick chart and renko chart, you can make very powerful trading decision.
In this post, let us show how to switch on and off the smart Renko chart from your price breakout pattern Scanner. Before you are using Smart Renko feature enabled, you might download sufficient history in your chart first. Once you have done it, set Use “Smart Renko = true” from your indicator setting. See the screenshots for your better understanding. Some of our customer know that there is great way of trading with Price breakout pattern scanner and our Harmonic Pattern Plus (or Harmonic Pattern Scenario Planner) If you are curious, you migh check our ebook. We have described the trading principle in details in this book: Price Action and Pattern Trading Course.
http://algotrading-investment.com/portfolio-item/price-breakout-pattern-scanner/
Here are the links for the Price Breakout Pattern Scanner
https://www.mql5.com/en/market/product/4859
https://www.mql5.com/en/market/product/4858
http://algotrading-investment.com/portfolio-item/price-breakout-pattern-scanner/

Young Ho Seo
GBPUSD Market Outlook 8 Nov 2017
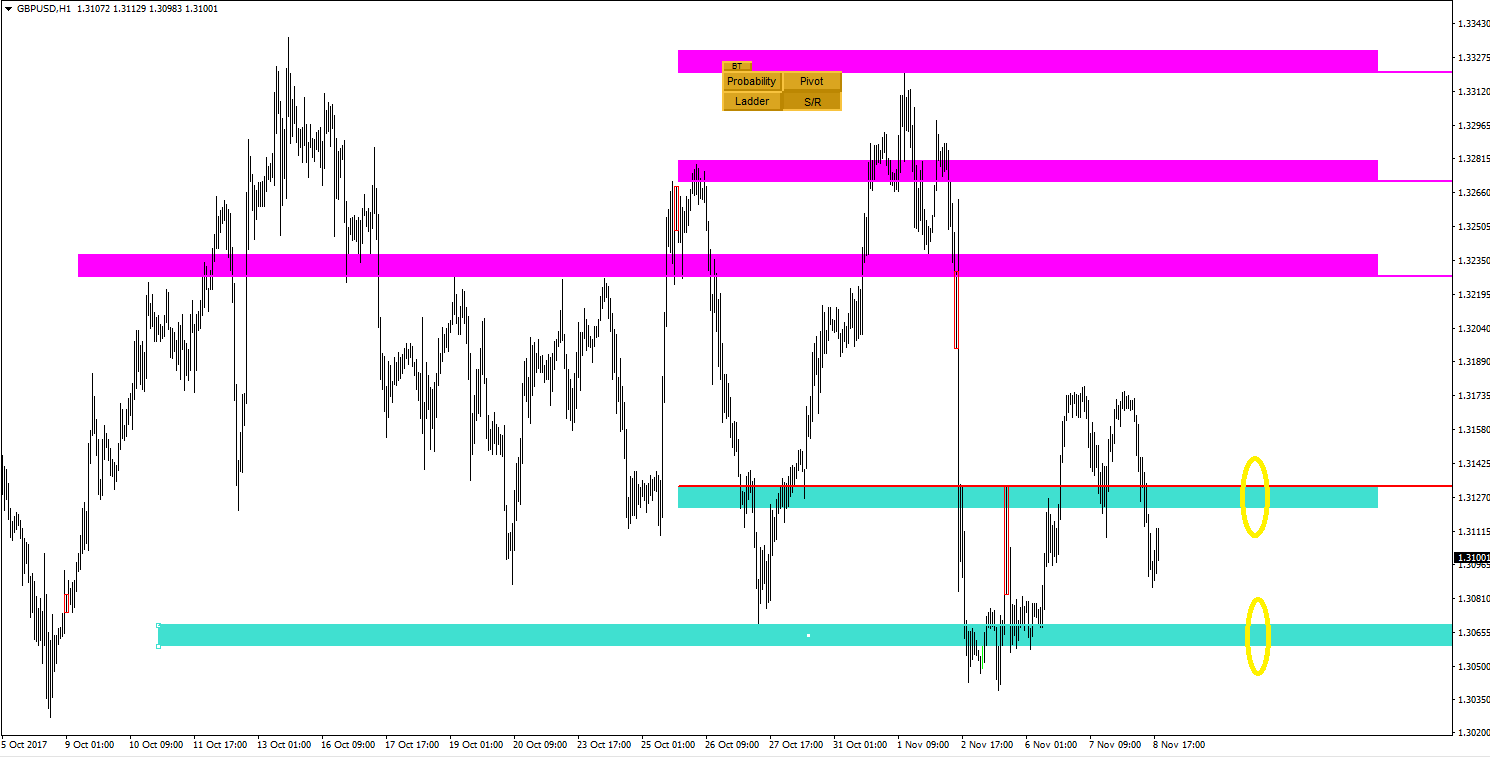
Here are what was happening in GBPUSD today. So finally GBPUSD broke down the support (resistance level) we have mentioned earlier. It took two attempts at its second attempts. Currently it is down by 50 pips. We have outlined two important support resistance level for your trading. Check the screenshot. All the analysis was done simply in Precision Support Resistance.
http://algotrading-investment.com/portfolio-item/precision-support-resistance/
http://algotrading-investment.com

Young Ho Seo
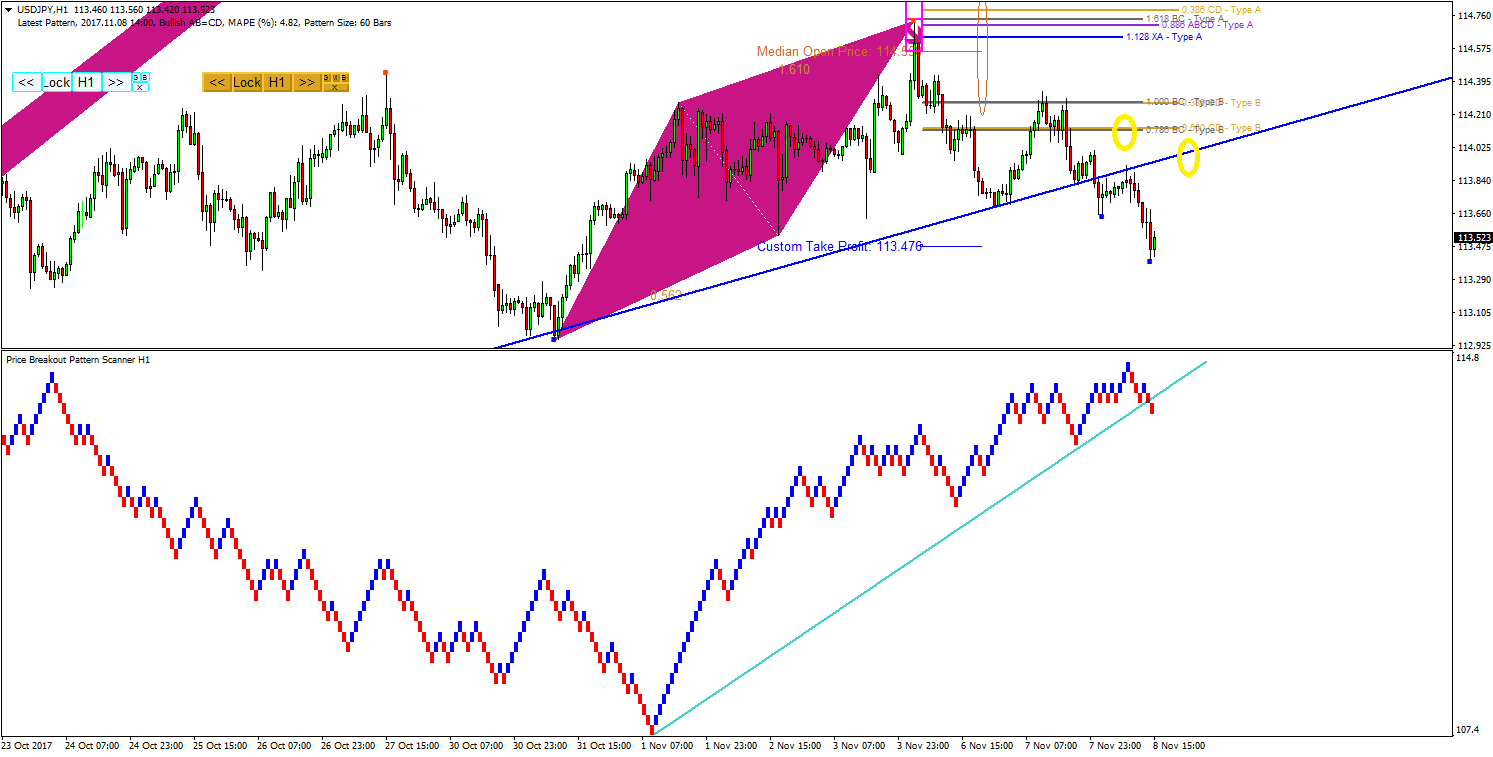
USDJPY Market Outlook 8 Nov 2017 Wednesday
In regards to our last analysis, USDJPY have been broke down the critical level and currently it is down by nearly 50 pips. You still need to watch out the two critical levels for your future trading.
http://algotrading-investment.com
https://www.mql5.com/en/users/financeengineer/seller#products
In regards to our last analysis, USDJPY have been broke down the critical level and currently it is down by nearly 50 pips. You still need to watch out the two critical levels for your future trading.
http://algotrading-investment.com
https://www.mql5.com/en/users/financeengineer/seller#products

Young Ho Seo
Tactical Use of Pattern Completion Interval
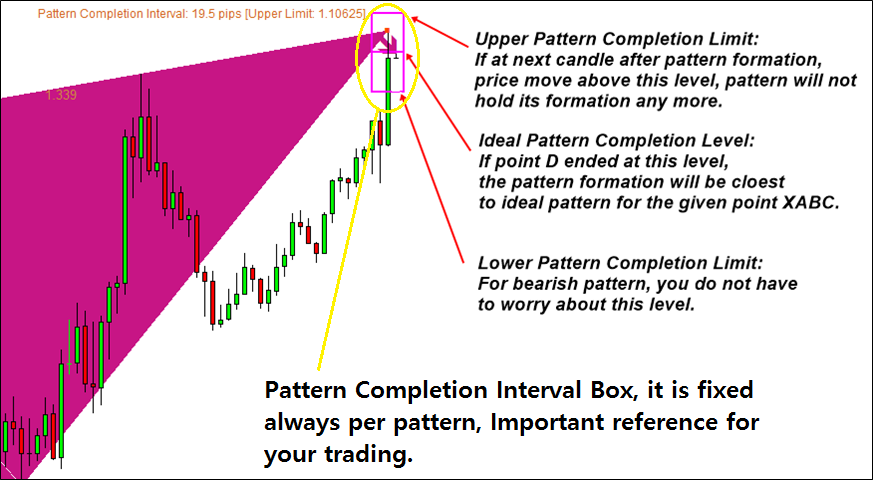
Our Harmonic Pattern Plus and Harmonic Pattern Scenario Planner exclusively uses the Pattern Completion Interval for your tactical trading.
Sounds complicated but not. Simply, if the price is inside the PCI box, then the pattern will stay alive. If the price move outside the PCI box, then the pattern is invalid. (We barrowed this concept from prediction interval or confidence interval from multiple regression techniques).
Maybe it is the view you need to see not the technical language. It is the PCI box that you will calculate your entry + your risk management. Inside PCI, your will pick up the good timing for your entry based on your risk management. Everything should be happen inside PCI. Otherwise, your reward/risk does not have too much merit.
Secondly you might need to use some secondary confirmation for final buy and sell decision. Remember the very advantage of manual trading is about combining information. It does not have to be fundamental data for this purpose. In our case, we exclusively uses geometric based tools and we have nearly got rid of all the technical indicator for trading. But you can use some technical indicator like RSI, Bollinger bands and Fibonacci retracement etc.
Once you are sure about the trading and entry and risk management, then you will lock the pattern for your trading. Just click the lock button in your chart to do so.
Visit our site for powerful trading system and strategy.
http://algotrading-investment.com/
https://www.mql5.com/en/users/financeengineer/seller#products

Young Ho Seo
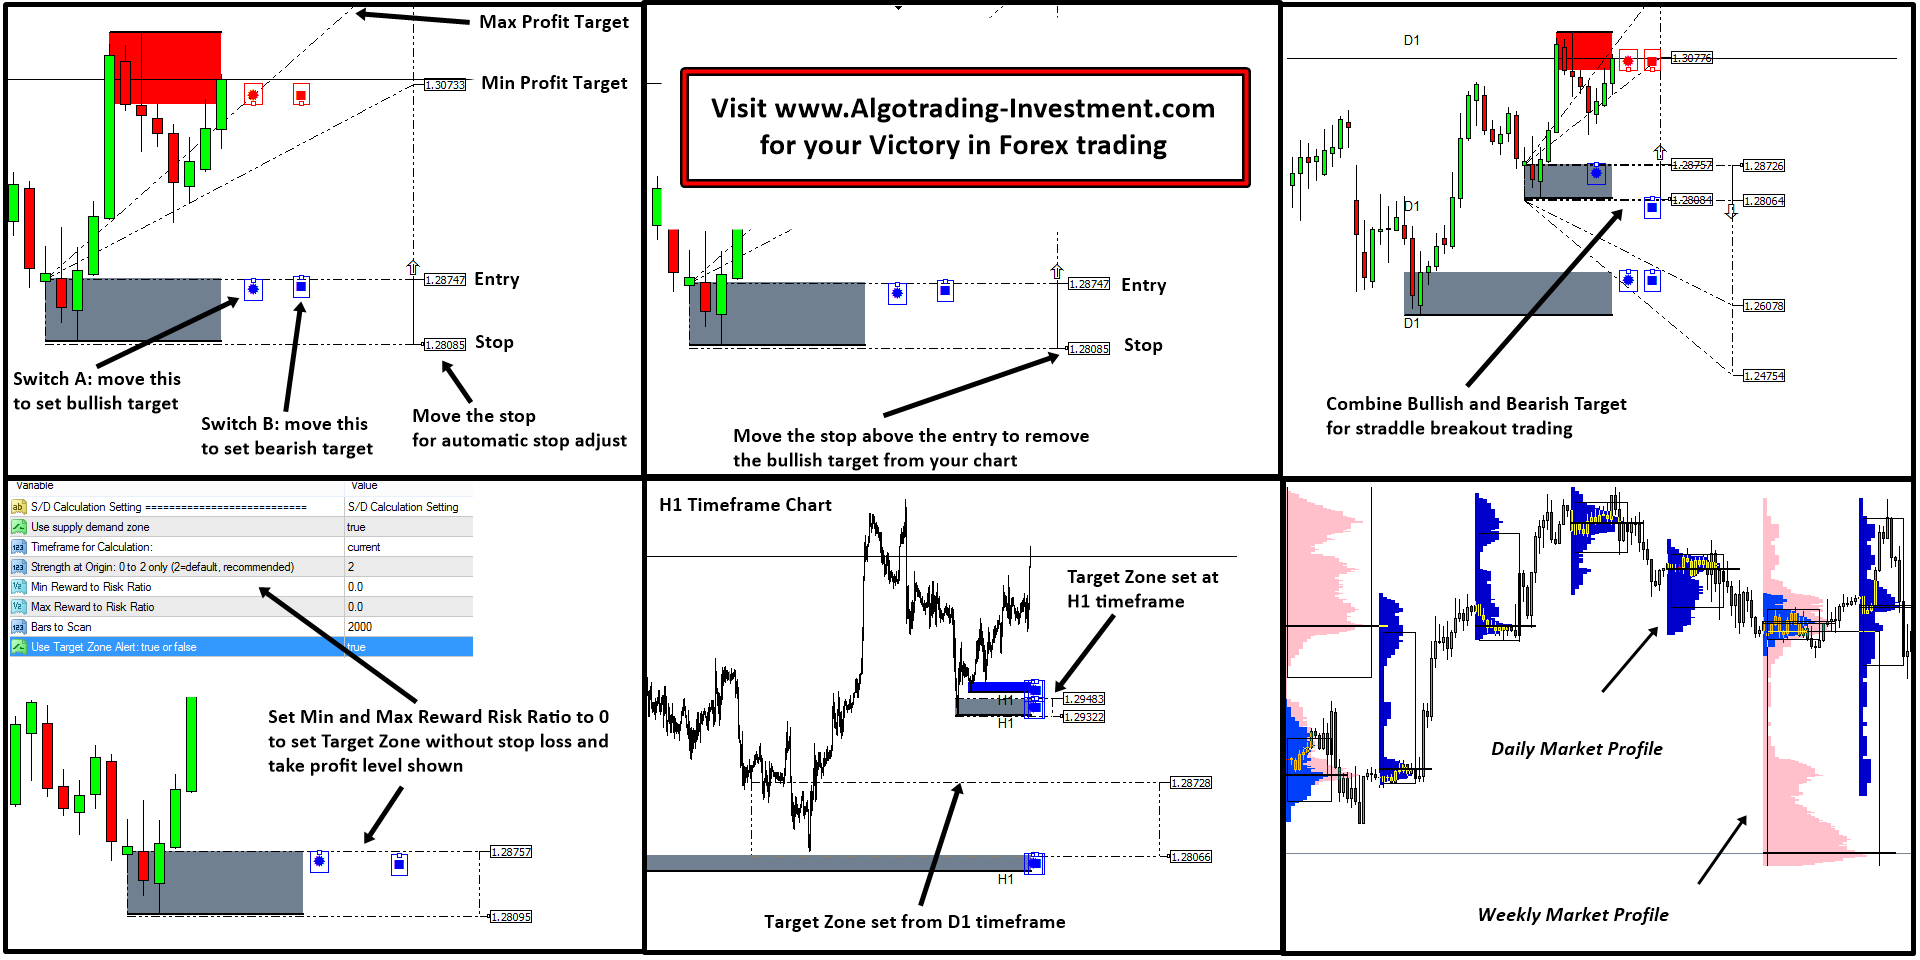
Mean Reversion Supply Demand Intro
We have many sophisticated trading system to construct the sound portfolio of your investment and trading.
Mean Reversion Supply Demand is one of those powerful tool you can add in your collection. With the built in Market Profile indicator, the tool provide flexible and accurate control of your entry and risk management especially around the significant trading zone in your chart.
Highly automated feature can help you to readily set your profit target and even more sophisticated analysis in your chart.
http://algotrading-investment.com/portfolio-item/mean-reversion-supply-demand/
Meet the unique and powerful trading system at our sites:
http://algotrading-investment.com/
https://www.mql5.com/en/users/financeengineer/seller#products

Young Ho Seo
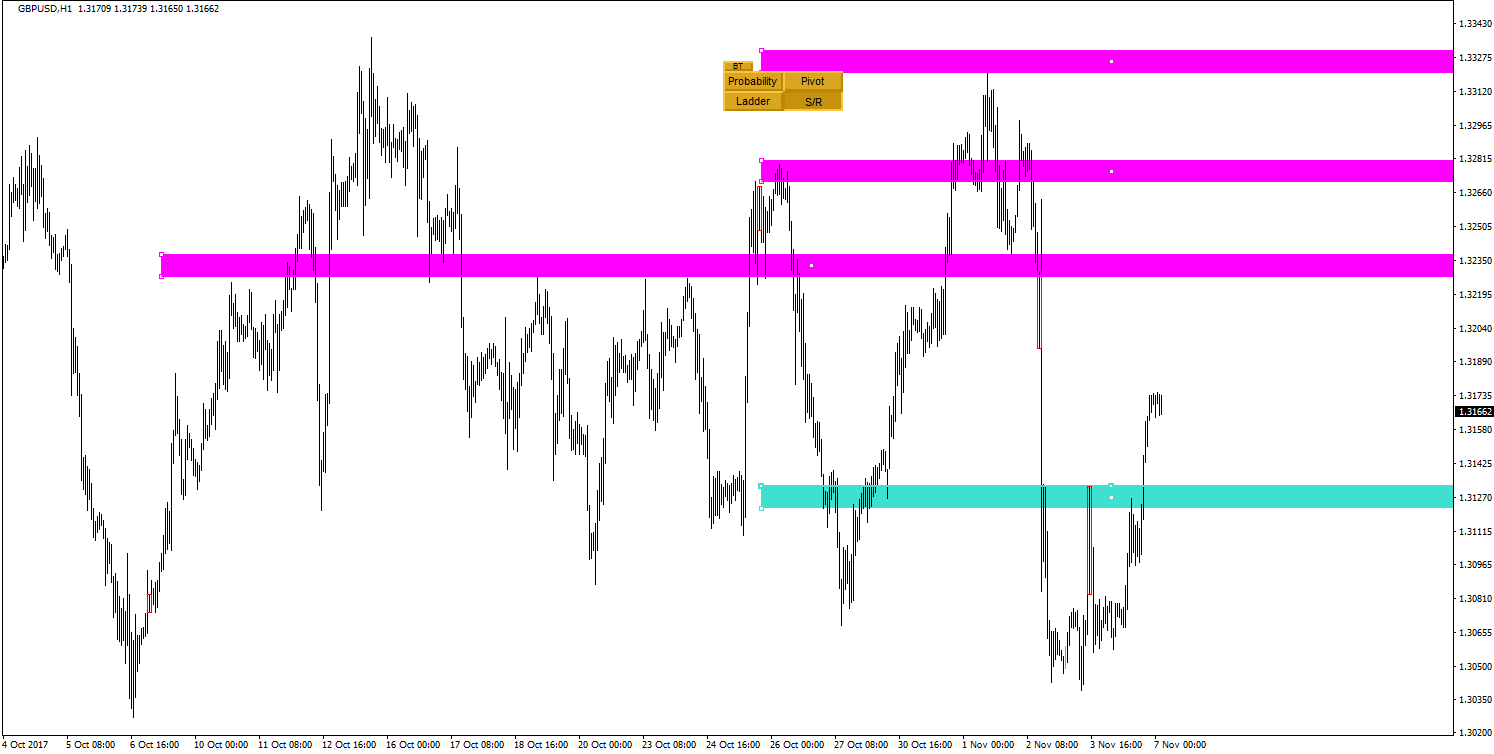
GBPUSD Market Outlook 7 Nov 2017
Here are some critical support and resistance levels detected by Precision Support Resistance. These critical support and resistance levels were simply extended as trading zone by double clicking over the levels.
Hope this is helpful for your trading today.
Plus you can also use our Precision Support Resistance with Harmonic pattern Plus (and with harmonic pattern Scenario planner) for perfect trading.
Visit our website for many powerful trading system and strategy:
http://algotrading-investment.com/
https://www.mql5.com/en/users/financeengineer/seller#products

Young Ho Seo
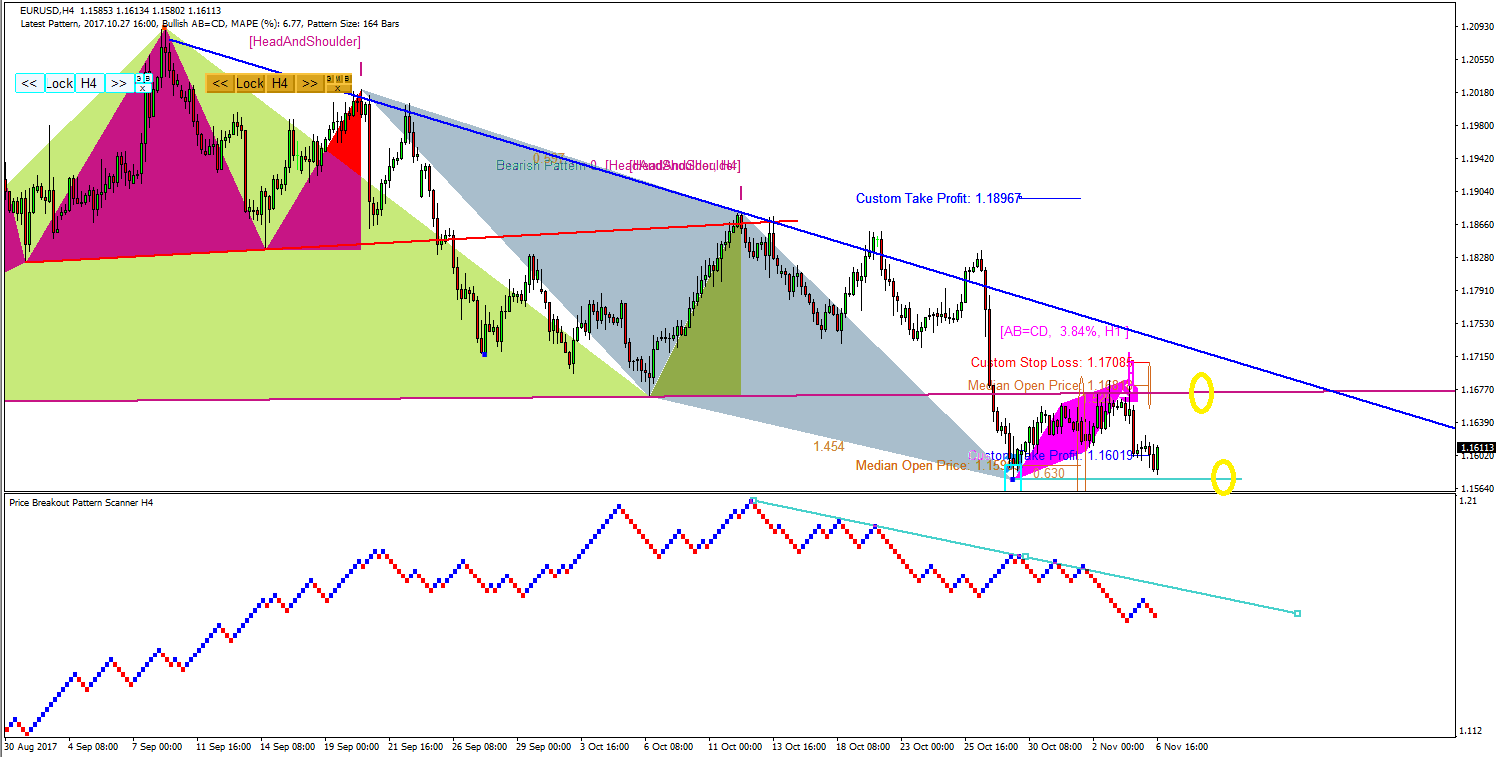
EURUSD Market Outlook on 6 Nov 2017
Last week, we had a bearish pressure for the continuing correction with ABCD pattern formation. Monday, EURUSD started slowly. EURUSD tested the critical level at 1.1575. However it did not make the clear touch around the level in fact. EURUSD might come back again to retest the level 1.1575 in the future. I have marked two critical levels for trading for now. Please see the screenshots.
Visit our website for Powerful trading system and strategy for your winning trading.
http://algotrading-investment.com/
https://www.mql5.com/en/users/financeengineer/seller#products

Young Ho Seo
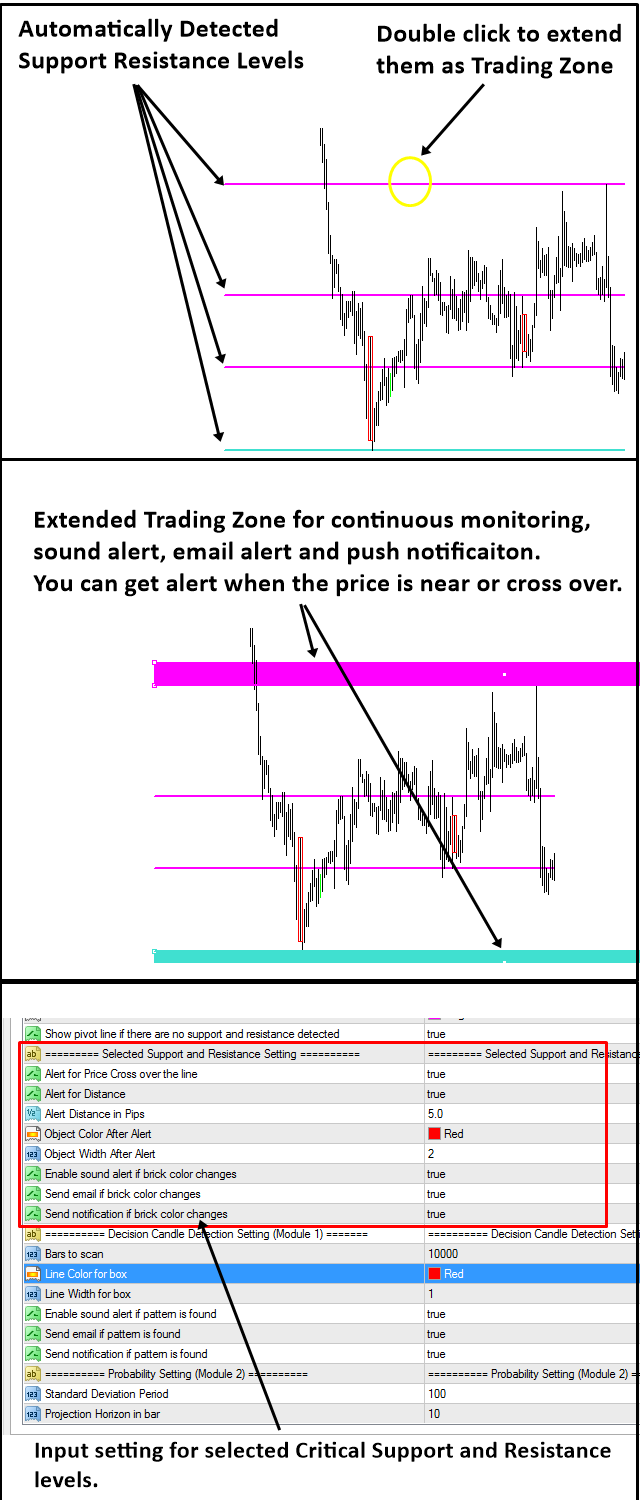
Version 7.1 of Precision Support Resistance Tool available on 6 Nov 2017
As we have mentioned in our previous post, we added many powerful feature to our Precision Support Resistance Tool. In version 7.1, you can choose critical support and resistance levels to mark up as the trading zone. You can continuously monitor the critical trading zone for your trading. You can also set sound alert, email, push notification when the price touches near the critical level or cross the critical levels.
Enjoy the powerful new feature on the Precision Support Resistance.
http://algotrading-investment.com/portfolio-item/precision-support-resistance/
Now you can rent this powerful tool with as low as 5 dollar only.
How to download new version is extremely simple. Just click Download button on the Product License Viewer. The instruction is here.
http://algotrading-investment.com/how-to-update-your-products/

Young Ho Seo
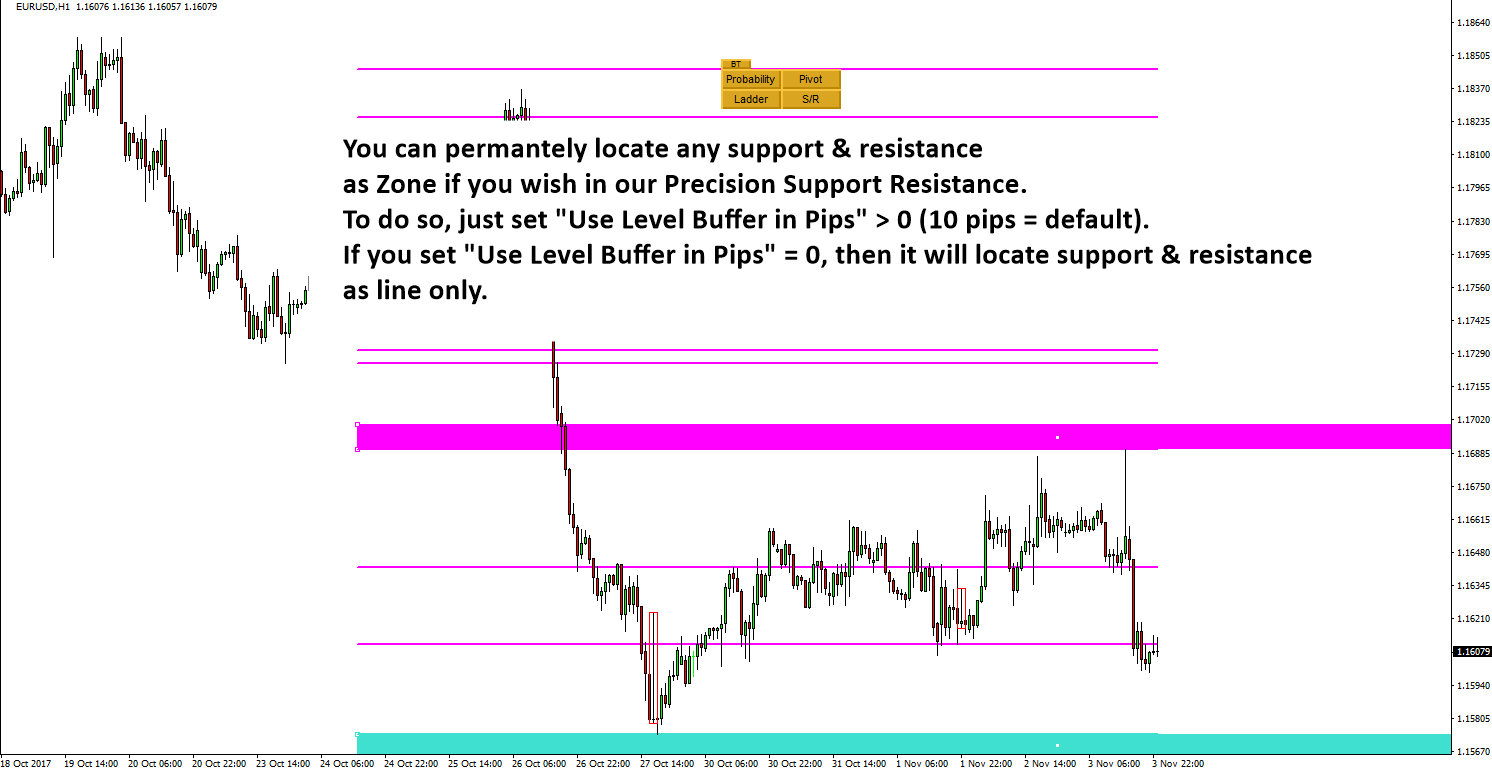
New Feature for Precision Support Resistance tool 3 – 5 Nov 2017
So here is some more news about our Precision Support Resistance tool. In newer version, you can choose to permanently locate your support and resistance levels as Zone instead of line. See the screenshot for better understanding. So all this powerful feature will be available in pretty soon.
Here are the links for all the other update news if you wish to check them.
http://tradeinvestsmart.com/2017/11/new-feature-for-precision-support-resistance-tool-5-nov-2017/
http://tradeinvestsmart.com/2017/11/new-feature-for-precision-support-resistance-tool-2-5-nov-2017/
Also visit our website where Precision Support Resistance is hosted.
http://algotrading-investment.com
https://www.mql5.com/en/users/financeengineer/seller#products

Young Ho Seo
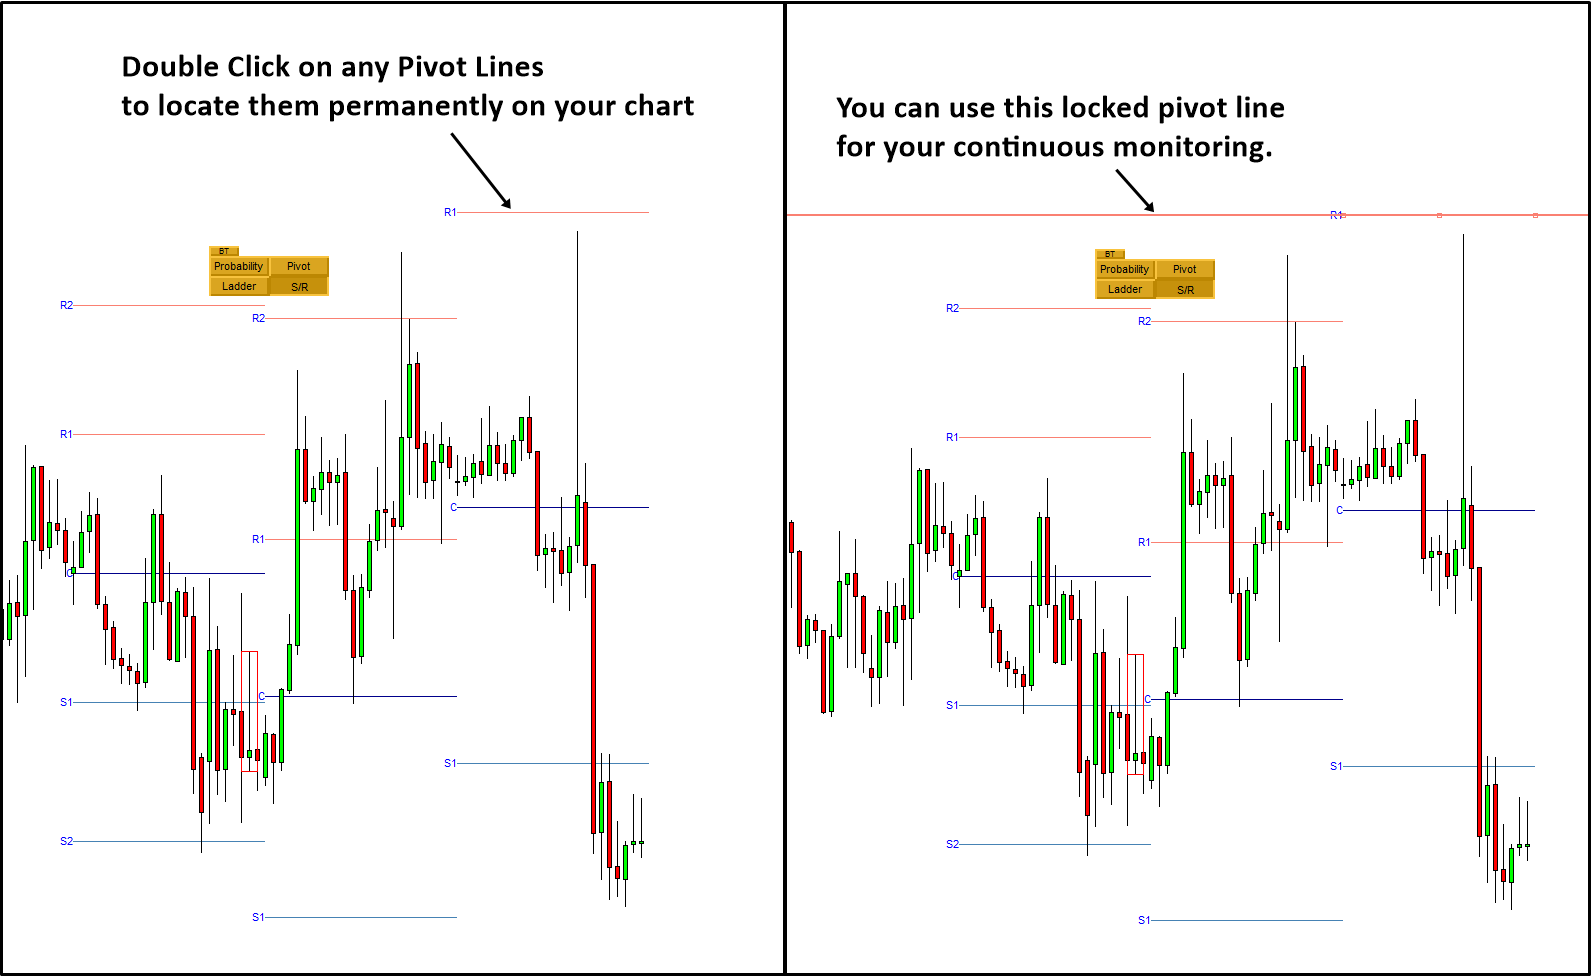
New Feature for Precision Support Resistance tool 2 – 5 Nov 2017
In regards to our previous post, we are in the process of adding automatic locking and unlocking feature to our Precision Support Resistance Tool. The same feature goes for the automatic pivot analysis. You can check the new feature in details in the following link:
http://tradeinvestsmart.com/2017/11/new-feature-for-precision-support-resistance-tool-5-nov-2017/
If you are looking for powerful Support Resistance tool, then precision support resistance is the right choice for your trading.
http://algotrading-investment.com/portfolio-item/precision-support-resistance/
https://www.mql5.com/en/users/financeengineer/seller#products

Young Ho Seo
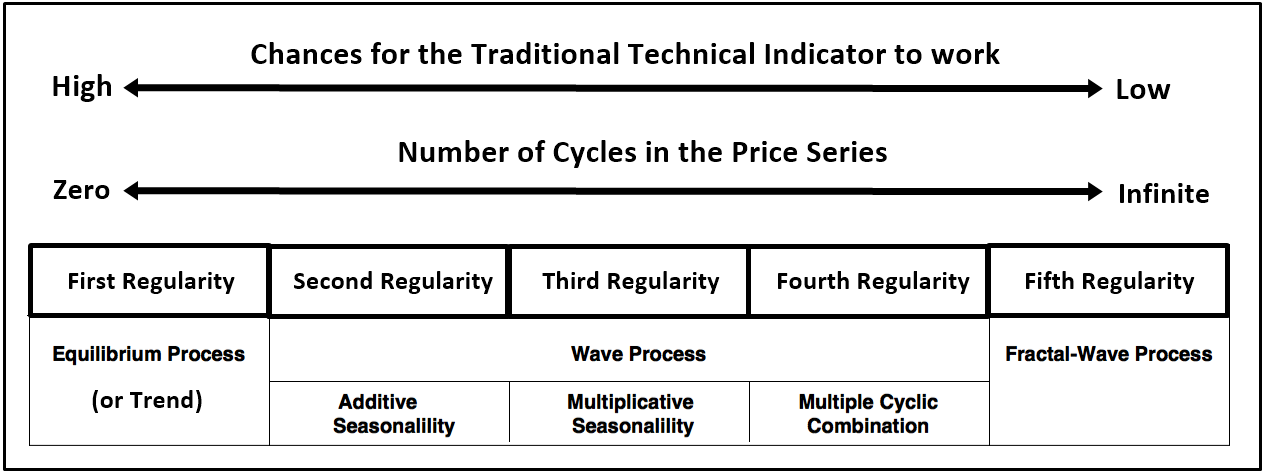
Further explanation on Price Pattern Table for Trading and Investment
Now I got many questions from traders about the Price pattern table for trading and investment posted last time. Here is the link to the last post.
http://tradeinvestsmart.com/2017/10/price-pattern-table-for-trading-and-investment/
What do the Price Pattern Table really means ? How can you relate them to your trading ? Since I have created the price pattern table, here are some further explanation in plain language. Five regularities are the major price patterns in the financial price series. It is difficult to think of any financial price series without these five regularities really except when the market is purely random. If the market is purely random, then we will not trade the random market anyway. So we can assume cycle always exists as we have shown in our Price Pattern Table. But the questions are how many cycles exists and how to deal with them for our trading ?
We have to think about what tools we are using for our trading and investment. One of them are those traditional technical indicators like moving average, RSI, Bollinger bands, etc. Many of the traditional technical indicators based its working principle on the signal processing and noise filtering topics. For this reason, they assume that price series have the finite number of cycles in it. For example, many technical indicator like moving average, RSI, MACD, CCI, etc operates with the period input as you know. The period input is indeed cyclic operator for many technical indicators.
However, as we have shown in our Price Pattern Table, the financial market could be dominated with fifth regularity which is characterized by the infinite cycle. Surely the financial market is not like chemistry or physics where many substitutes making up the object can be measured in nano or micro levels. In fact, it is far away from nano or micro level due to the human psychological factors but we can only tell them roughly using math or some quantitative techniques. It is possible that we can still get the intuition or logic behind this.
This is not necessarily that traditional technical indicators can not be used for your trading. Depending on what regularities are dominating in the price series, you will find some market can work with traditional technical indicators but some market will not.
However, one thing could be clear from the price pattern table. Using too many of them at the same time will likely to kill the valuable information in the price series. Therefore, it is not the recommended practice to build your trading strategy with technical indicators alone. To give you further idea about the logic, see the screenshot. If the market is dominated more with fifth regularity, the chance for the traditional technical indicator to work is low because technical indicator assumes that market have the finite number of cycles.
For this reason, traditional technical indicators work better when the market have finite or limited number of cycles as in first, second, third and fourth regularities. Hope this clears your questions. At the same time, do not forget that technical indicator and technical analysis are two different things in our discussion. Fortunately trading is not rocket science and I think any one can learn well. Just you need some time to discipline yourself but many skips this phase.
If you are interested in digging deeper with Price Action and Pattern Trading, then you can read the book here:
https://www.amazon.com/dp/B073T3ZMBR
http://algotrading-investment.com/
https://www.mql5.com/en/users/financeengineer/seller#products

Young Ho Seo
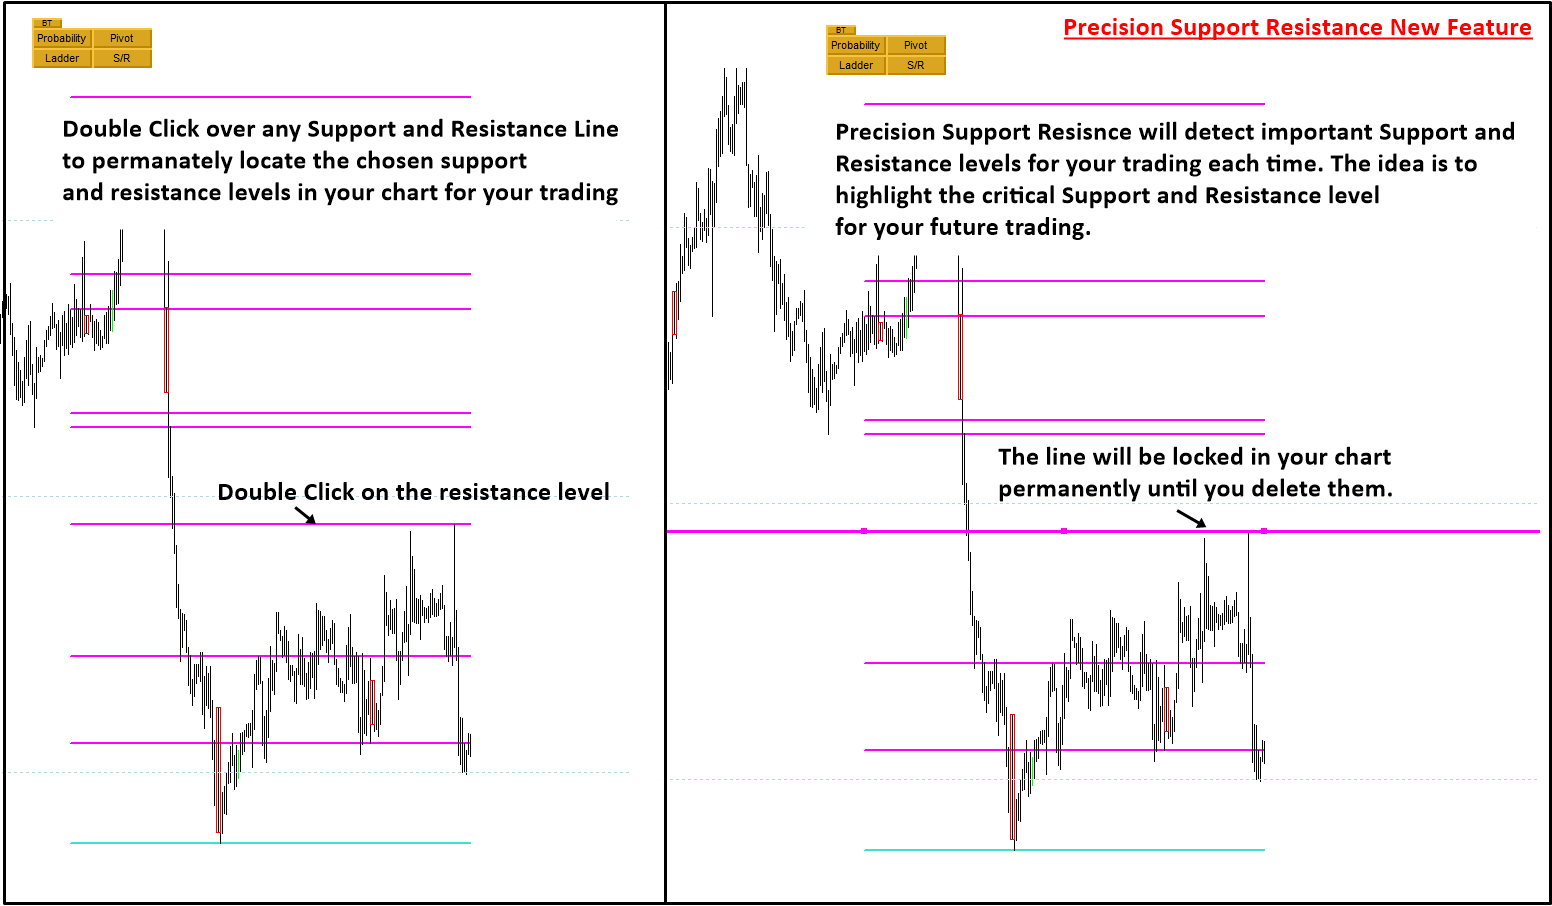
New Feature for Precision Support Resistance tool – 5 Nov 2017
So here are some interesting but powerful feature will be added to our Precision Support Resistance. This would improve your profitability marginally.
So you could lock (or highlight) any support and resistance levels detected by Precision Support Resistance levels in your chart for your future trading. Check the screenshot for better understanding.
http://algotrading-investment.com/portfolio-item/precision-support-resistance/
http://algotrading-investment.com/
https://www.mql5.com/en/users/financeengineer/seller#products

Young Ho Seo
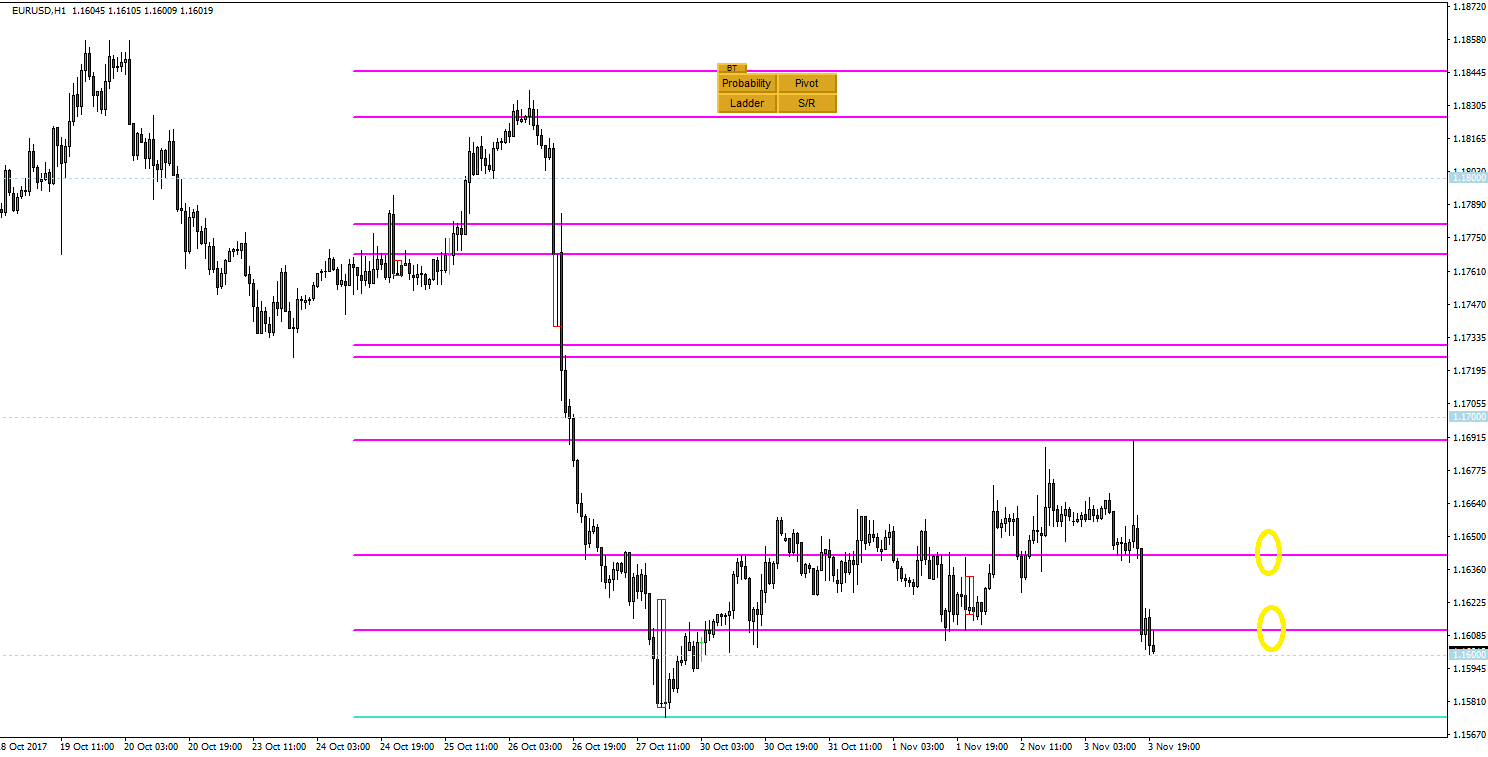
New Update coming for Precision Support Resistance - 5 Nov 2017
Our Precision Support Resistance was loved by many traders using support and resistance everyday for its accurate support resistance detection.
Just let you know that we are adding some new powerful feature on our Precision Support Resistance. We are hoping to release new version in next few days.
We think that using Precision Support Resistance + Time Box indicator (free) can provide you the robust results for your trading. So we will make both indicator more compatible. This means that Precision Support Resistance will be more compatible with our other Price Action and Pattern Trading tools like Harmonic Pattern Plus, Price Breakout Pattern scanner, Advanced Price Pattern Scanner, Elliott Wave Trend, etc.
So stay tuned for further news on New Update coming for Precision Support Resistance
You can get the Time Box indicator for free here.
http://algotrading-investment.com/product-category/free/
or here
https://www.mql5.com/en/users/financeengineer/seller#products
http://algotrading-investment.com/portfolio-item/precision-support-resistance/

Young Ho Seo
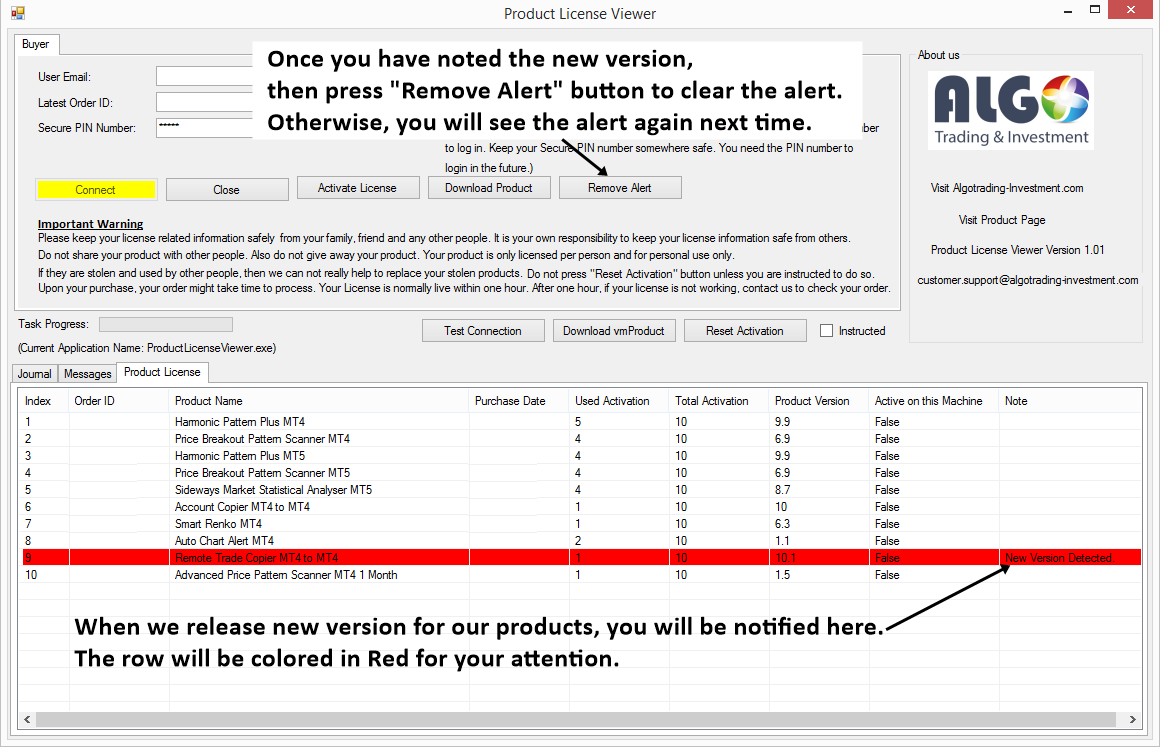
Getting Newer version of Our Products (Recommended Method)
Our MetaTrader 4/MetaTrader 5 products include free future update. This is a great feature from our customer's point of view. When we release new version of our products, the easiest way to get the new version of product is using Product License Viewer because our Product License Viewer was designed for such a purpose. You can download the Product License Viewer for free always in this page: http://algotrading-investment.com/product-installation-guide/.
Now once you have downloaded the Product License Viewer, just start the Product License Viewer. When the newer version is available to download, the Product License Viewer will highlight the product with newer version in red color (alert). To download newer version, select the product from the list, then click "Download Product" button. Once you have downloaded, click "Remove Alert" button to dismiss the Red highlighted row from the Product License Viewer. That is it. Getting newer version of our product is as simple as ABC. Then enjoy the new update of our powerful trading tools and system.
Visit our website for powerful trading system and strategies:
http://algotrading-investment.com
https://www.mql5.com/en/users/financeengineer/seller#products

Young Ho Seo
EURUSD Market Outlook on Friday 3 Nov 2017
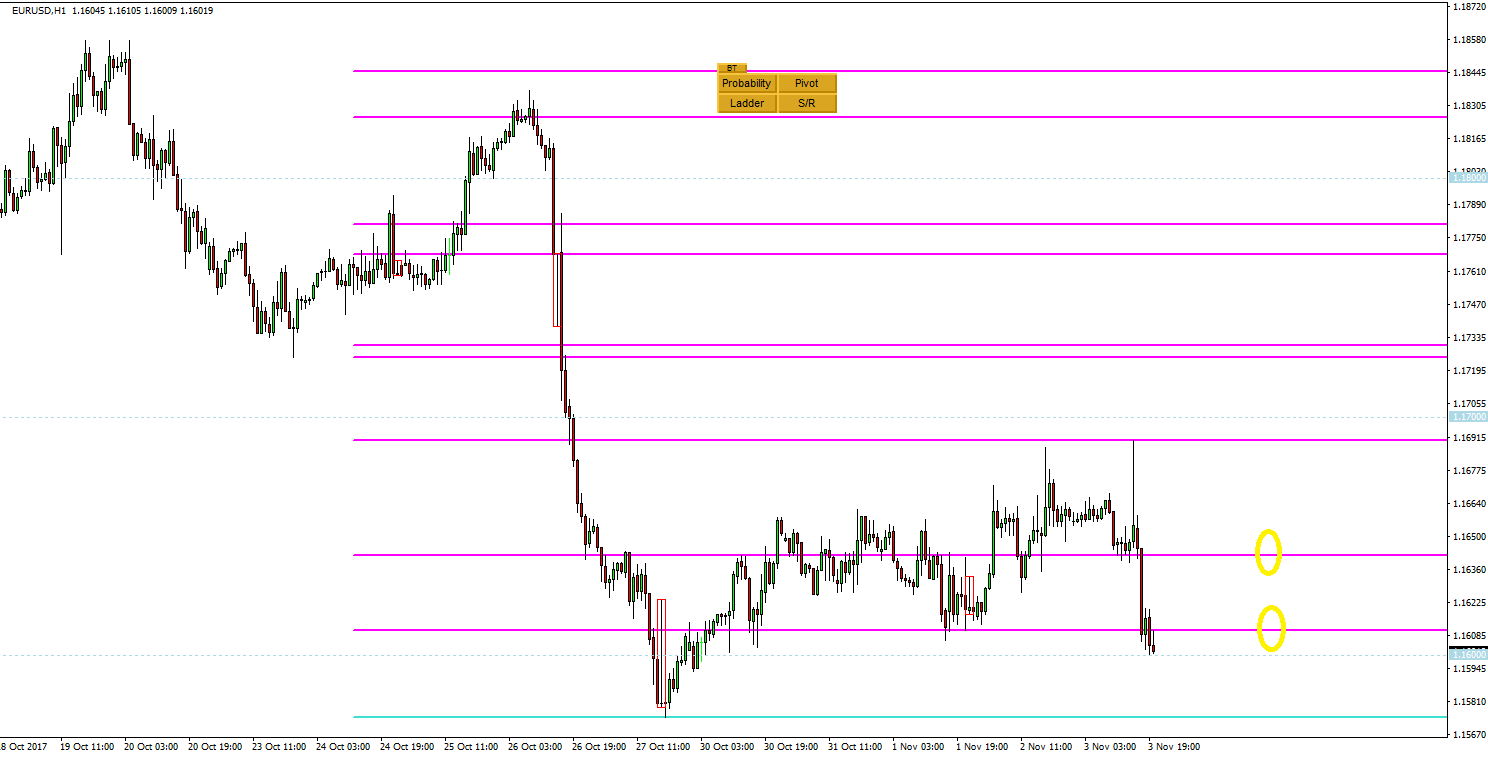
It did not take long for EURUSD to run down new support level since our last post. EURUSD went down nearly 40 pips since our last post. Currently it broke another support level down at 1.1610.
All the support and resistance levels are detected automatically by our precision support resistance indicator, which is powerful automatic support resistance detector.
Visit our site if you are looking for powerful trading system.
http://algotrading-investment.com/portfolio-item/precision-support-resistance/
https://www.mql5.com/en/users/financeengineer/seller#products

Young Ho Seo
EURUSD Support Resistance Levels on Friday 3 Nov 2017
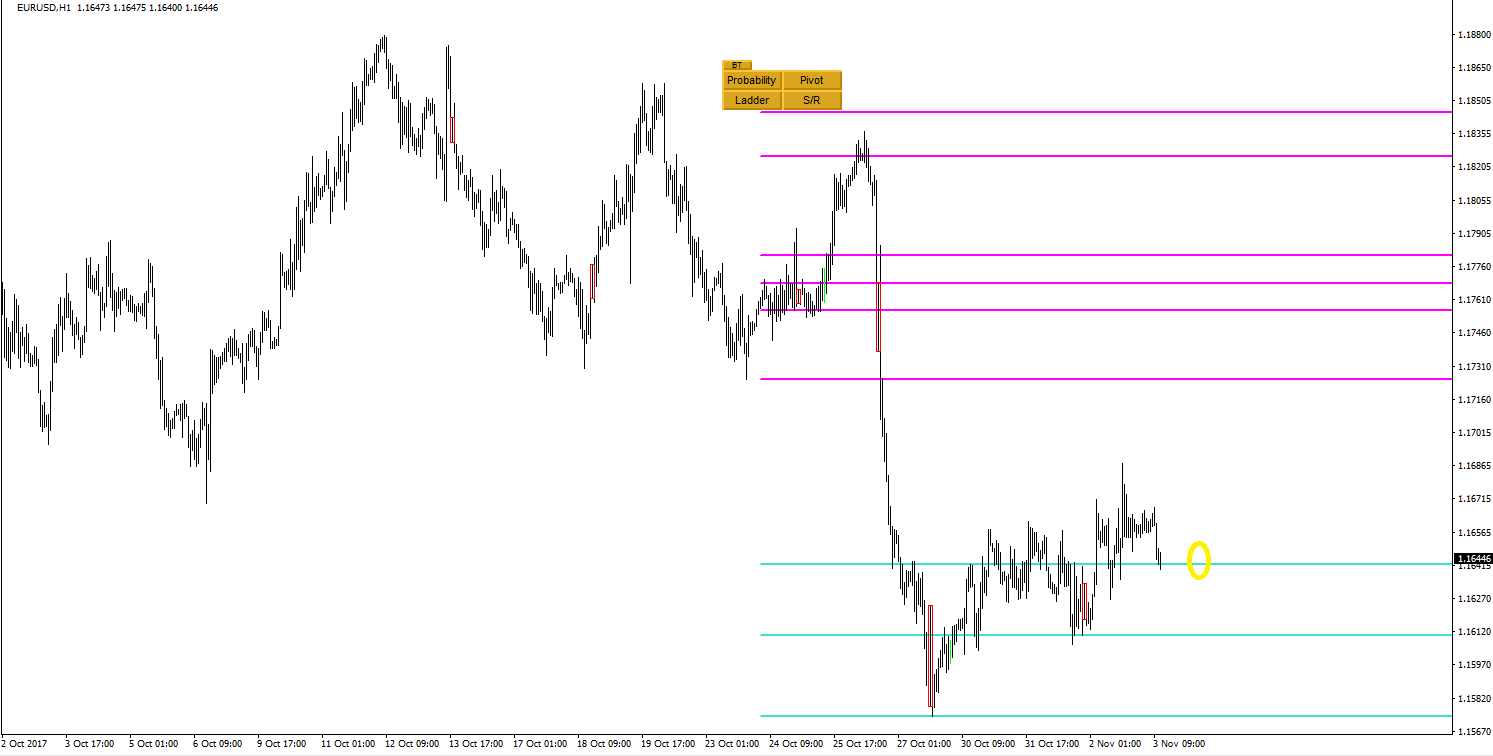
Here are the detected support and resistance levels for EURUSD today. The support and resistance levels are automatically detected by our Precision Support Resistance tool.
We hope this is helpful for your trading together with our pattern analysis earlier.
We offer many powerful trading system and strategy on our website, Visit:
http://algotrading-investment.com
https://www.mql5.com/en/users/financeengineer/seller#products

Young Ho Seo
GBPUSD Market Outlook 2 November 2017 Thursday
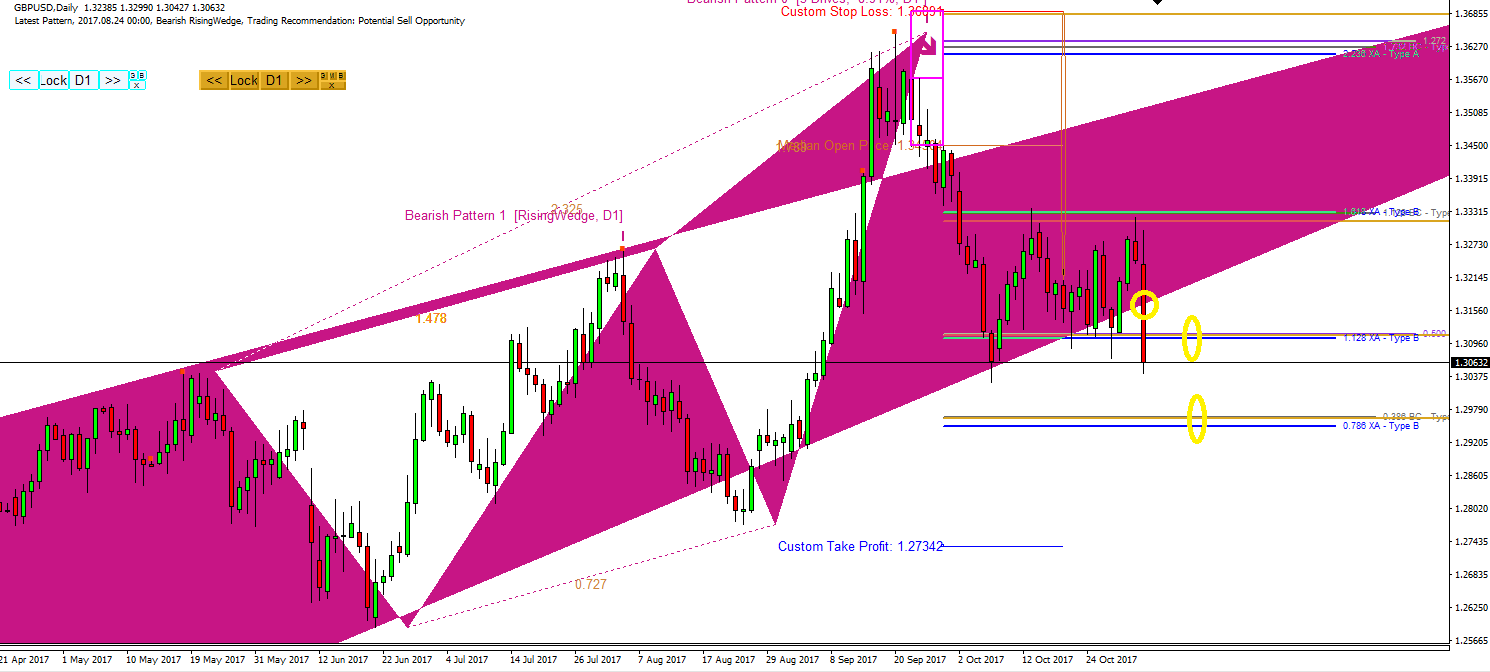
GBPUSD had a bullish start this week. On Wednesday, GBPUSD tested the PRZ Type B levels (1.3320) of the Bearish 3 drive pattern, then it went straight down by 250 pips in two days. Both bottom of the rising wedge pattern and the lower PRZ Type B level (1.3100). GBPUSD can come back to test the lower PRZ Type B level (1.3100) again. At the same time, its most probable bearish land mark is the PRZ Type B level at 1.2960.
Visit our website for range of powerful trading systems and indicators.
http://algotrading-investment.com
and
https://www.mql5.com/en/users/financeengineer/accounting
Kind regards.

Young Ho Seo
EURUSD Market Outlook on 2 Nov 2017 Wednesday
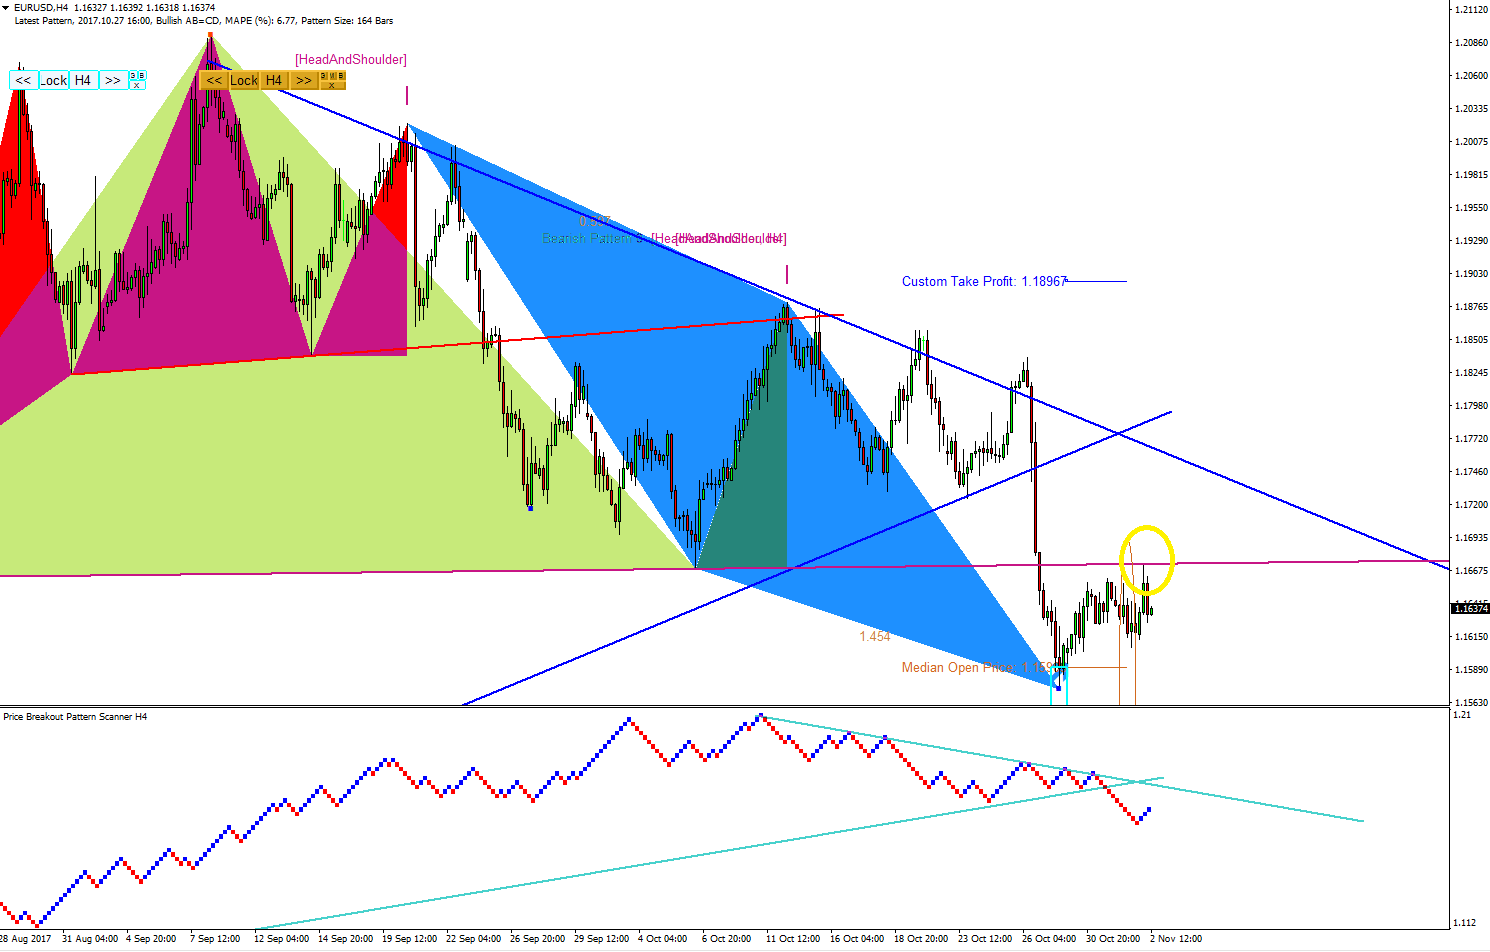
It did not take long for EURUSD to touch the neck line of head and shoulder again because we only mentioned that it would test the neckline in yesterday. EURUSD did not have the enough momentum and it dropped down around 40 pips.
Stay with us. We will announce more exciting and great news in the future pretty soon. :)
Here is the link to our website.
http://algotrading-investment.com/
and
https://www.mql5.com/en/users/financeengineer/seller#products

:
