Nuevos indicadores técnicos para MetaTrader 4 - 92

The indicator calculates the saturation levels of the price chart. A signal to exit the resale area is a buy signal. A signal to exit the overbought area is a sell signal. Usually, you need to set relative values for the overbought and oversold levels of Bottom and Top - for this indicator.
Most often, a good trend is visible on the price chart visually. But an experienced trader must clearly understand the current balance of power in the market before entering. And the indicator will help

This indicator can track the steady price movement in a certain direction. In this case, the movement itself can be downward, upward or lateral, when the market movement does not have a pronounced focus. The indicator works on the basis of two moving average as well as an oscillator. Using the signal search algorithm, the indicator generates signals in the form of arrows.
Benefits. Allows you to determine the current trend. You can quickly enough understand which particular trend is currently

Average Daily Weekly Monthly Range Alerts.
The most complete multi-period dynamic range indicator with full alert options. Visually displays the Average Range lines on chart + real time distances to the Range Highs and Lows. Notifications are sent when the average ranges are hit. An essential tool for any serious trader! Average period ranges, especially the ADR (Average Daily Range) for day traders, are one of the most useful and consistently reliable indicators available to traders. Always a

This is a hybrid trend indicator, as it is based on the signals of elementary indicators and a special algorithm for analysis. The smart algorithm of the indicator determines the trend, filters out market noise and generates input signals. The indicator uses a color alarm: blue - when changing from descending to ascending, and red - on the contrary, to descending. You can use the indicator as the main indicator for determining the trend. The indicator can work both for entry points and as a filt
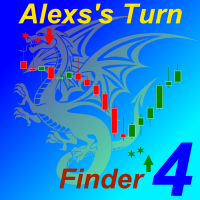
This indicator finds local extremes and indicates the beginning of a new short-term trend. A great tool for intraday and short-term trading.
The indicator finds the likely pivot points of the price and shows them on the chart with asterisks. After confirming the reversal, arrows are displayed on the chart that serve as Buy and Sell signals.
Both asterisks and arrows are formed only after the candle or bar closes. This reduces the number of false signals and significantly increases the a
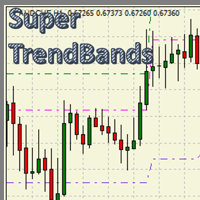
Super Trend Bands Un indicador basado en MaSuperTrend , aprovechando los cálculos obtenidos para así distribuir de forma lógica una serie de canales que acompañan el precio durante su recorrido, facilitando así zonas de comercio con un riesgo y objetivo calculado. Con gran adaptabilidad en cualquier tipo de activo financiero y con un potencial de simplificación visual en el gráfico, que hará del gráfico una simple mesa de trabajo. Un indicador creado a la medida: - Para plataforma de escritorio

The RSI Arrows MTF indicator is based on the RSI indicator. Represents input signals in the form of arrows. It has 6 types of calculation. All signals are generated on the current bar of the selected period.
Signals do not redraw in the first 4 modes! But it is possible to redraw in cases of a sharp change in market movement.
All signals in MTF mode correspond to signals of the period specified in MTF. It is maximally simplified to use both for trading with only one indicator and for using
FREE

The indicator shows entry points with Risk-Reward-Ratio 1 to 5. Main timeframe H1. Works on every pair. The main logic - is to find a reversal level, and then track the price reaction to this level. Doesn't need any settings. As a standard, it paint 5 levels of the same take-profit (red / blue for sellers and buys) and 1 stop-loss level - orange. ATTENTION! Test version of the indicator. Works only on the USDCAD pair! The full version can be bought here https://www.mql5.com/en/market/product/61
FREE

Candle Pattern Alert indicator alerts when the last price closed candle matches the set input parameters. You can choose to scan through all the symbols in Market Watch or enter your favorite symbols and also you can enter time frames you need to scan. --------- Main settings- ------- Select all symbols from Market Watch? - if Yes the program scans through all the symbols displayed in Market Watch, if No - only selected in next input symbols are scanned
Enter symbols separated by commas - enter
FREE

This indicator is based on Guppy's GMMA Strategy. And shows arrows when GMMA lines cross up or down. To have this indicator and get alerts for Multiple Timeframes and multiple Pairs you can check out the demo of this GMMA Trend Scanner indicator: https://www.mql5.com/en/market/product/38747
About GMMA In Brief:
GMMA attempts to identify trends by combining two groups of moving averages with differing time periods: The long-term EMAs (30, 35, 40, 45, 50, and 60) the behaviors of investors tha
FREE

Dolphin Bands indicator works equally well on any timeframes. For medium-duration trends, it is recommended to use the standard setting. To study long-term trends, it is recommended to use an indicator value greater than the standard. To analyze short-term trends, it is better to use a lower indicator value. Most often, an exponential method is used to calculate the indicator, but other varieties can also be used.
Dolphin Bands is a collection of lines. The two center lines of the indicator a

Special Volume - Volume indicator, in the Forex market volumes are peculiar (teak). Why is Forex not possible to track normal volumes? The fact is that it is an OTC market. Therefore, it is practically not realistic to calculate the volume of purchases and sales by one instrument. Many Forex traders completely abandon volume indicators in their work. But for those who want to use them, there are some interesting tools, and one of them is Special Volume. The Special Volume indicator shows the ave

BeST_ Classic Pivot Points is an MT4 Indicator that is based on the widely known and definitely classic Pivot Point of a market prices activity. A pivot point is calculated as an average of significant prices (high,low,close) from the performance of a market in the prior trading period. If the market in the following period trades above the pivot point it is usually evaluated as a bullish sentiment, whereas trading below the pivot point is seen as bearish. A pivot point and the associated suppo
FREE

Lift off! This Indicator will take your trading into new heights! This Forex Indicator Scalper is great for all time frame. It works by incorporating the Double MACD strategy and the Ichimoku Cloud. They both work as an excellent signal confirmation and filters for each other. The there is specific Ichimoku setting that seem to work nicely by shifting the Kumo Cloud during my research. This is the secret sauce for Sclaping with Ichimoku
How to use: 1. Wait for arrow signal to show. (IT DOES
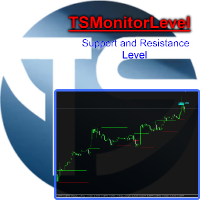
Indicator, which draws supports and resistances. Algorithm that calculates the entry zone of the position and the possible target. The benefits you get: Never redesigns, does not retreat, never recalculates. Works on forex and CFD, timeframe from M1 to Weekly. Integrated pop-up, push notification and sound alerts. Easy to use.
Parameters: SENSIBILITY = indicates the importance of levels, we recommend a minimum value of 1.0
PERIOD_BAR = indicates how many bars are considered for volatility,
Панель предназначена для быстрого визуального нахождения и отображения ложных пробоев по всем периодам и на любых выбранных валютных парах одновременно . Цвет сигнальных кнопок , указывает на направление возможного движения . По клику на сигнальную кнопку , осуществляется открытие графика с данным паттерном . Отключить не используемые периоды , можно кликом по его заголовку . Кнопка "All" открывает графики всех сигналов по данному периоду . Имеется поиск в истории ( по предыдущим барам ). Прокру
the best indicator to put your own fingerprint on your products, put your signature and protect your rights easily and simply. You can customize any program (indicator, Expert or script) by choosing your own signature and your favorite color, adjust the indicator properties to suit your needs, and change your signature at any moment you want with this wonderful indicator.

The indicator marks bars with a simple trend definition“ each subsequent high above/below the previous one and each subsequent low above/below the previous one ”. Charles Dow
Formula:
Max – The current maximum Min – The current minimum MaxK – Maximum per period MinK – Minimum per period Min>MinK & Max>=MaxK – Symbol on top Max<MaxK & Min<=MinK – The symbol on the bottom
Input parameter:
Number of bars in the calculated history Period for current timeframe The distance to the symbo
FREE
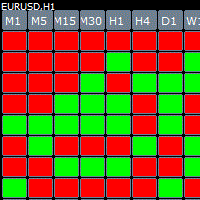
Cube indicator represents the original candle stick chart but in a top down cube form in order to see previous patterns in the markets more easy. The indicator has build in alert once there is a consecutive 3,4,5 bars in a row you get an message.
Parameters Bars_Limit = total visible cubes
TF_M1 = true; TF_M5 = true; TF_M15 = true; TF_M30 = true; TF_H1 = true; TF_H4 = true; TF_D1 = true; TF_W1 = true; TF_MN1 = true; Table_Position_X = 20; Horizontal shift Table_Position_Y = 40; Vertica
Mars 12 is a Pullback indicator is a powerful indicator of Pullback trade for any par and any timeframe. It doesn't requires any additional indicators for the trading setup.The indicator gives clear signals about opening and closing trades.This Indicator is a unique, high quality and affordable trading tool. Can be used in combination with other indicators Perfect For New Traders And Expert Traders Low risk entries. Never repaints signal. Never backpaints signal. Never recalculates signal.
How To Trade
Execute your trades in 3 Easy Steps!
Step 1: Trade Setup Entry Buy in Signal price and TP1 in price indicator, You can use trailing stop in TP1. Entry Sell in Signal price and TP1 in price indicator, You can use trailing stop in TP1. Success Rate ≥ 75% 100:25 Step 2: Set Stop Loss Stop loss BUY ----> You can set stop loss on Line Order SELL. Stop loss SELL ----> You can set stop loss on Line Order BUY. Step 3: Set Take Profit Option 1: Take profit on TP1. Option 2: Partial take
FREE

This indicator draws regular bullish and bearish divergences in real-time onto the charts. The algorithm to detect those divergences is based on my 10+ years experience of detecting divergences visually. The divergences are drawn as green and red rectangles on the charts. You can even do forward testing in the visual mode of the strategy tester.
Parameters Fast EMA Period: The period of the fast EMA of the MACD. Default value is 12.
Slow EMA Period: The period of the slow EMA of the MACD. Def

This indicator draws regular bullish and bearish divergences in real-time onto the charts. The algorithm to detect those divergences is based on my 10+ years experience of detecting divergences visually. The divergences are drawn as green and red rectangles on the charts. You can even do forward testing in the visual mode of the strategy tester. This FREE Version is restricted to EURUSD and GBPUSD. The full version without restrictions is here: https://www.mql5.com/en/market/product/42732
Para
FREE
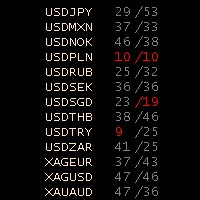
Panel del Oscilador Estocástico Presentamos el Panel del Oscilador Estocástico, una representación exhaustiva del oscilador estocástico para todas las divisas (hasta 75 pares). Esta poderosa herramienta opera dentro del marco de tiempo actual, utilizando el promedio móvil simple y basándose en los precios más bajos (Low) y más altos (High). El panel consta de tres columnas: Nombre de la divisa MODE_MAIN (línea principal) MODE_SIGNAL (línea de señal) El Panel del Oscilador Estocástico proporciona
FREE

KT MA Crossover draws the buy and sell arrows based on the crossover of chosen moving averages. Moreover, it also generates the appropriate alerts and displays the MFE (Most Favorable Excursion) for each successive signal. The moving average crossover is one of the primary strategies followed by traders around the world. Usually, it consists of a fast and slow moving average to find a buy and sell entry signal according to the crossover direction. Buy signal - when fast MA crosses above the slo
The proposed indicator is based on the ZigZag Mini Extra indicator ( https://www.mql5.com/ru/market/product/42632 ).
Unlike the prototype can be built at the price of Close or High-Low with the established timeframe.
The prices of the current timeframe will be used when calculating the indicator on the highest timeframes at Close price, .
Indicator parameters:
ZigZag TimeFrame = PERIOD_CURRENT - operating time frame (must be equal or more than current timeframe);
Depth = 12 - depth of

This indicator allow you to measure Profit/Loss of current, closed or future trade in account currency and estimate margin level at the trade close point. Profit/Loss indicator is based on MT4 native Crosshair instrument and has following inputs: Trade Direction = Buy/Sell Lot size = 0.1 Font size = 8 Font color = DeepSkyBlue Offset horizontal Offset vertical
FREE

How To Trade
Execute your trades in 3 Easy Steps!
Step 1: Trade Setup Entry Buy in Line color Blue Touch on line color Red. Entry Sell in Line color Blue Touch on line color Green. Success Rate ≥ 80% 100:20 depend your experience and fast your take. Step 2: Set Stop Loss Stop loss BUY ----> You can not put stoploss with a fixed price, your speed in determining the closing request------>Line color Blue Touch on line color Green. Stop loss SELL ----> You can not put stoploss with a fixed price,
FREE

Indicator RS 24 Titanium is a multi-currency and multi-timeframe signal indicator created by the author's algorithm. Designed to quickly assess the trend (the mood of market participants) on all timeframes simultaneously, for a specific financial instrument. RS 24 Titanium scans readings from all timeframes for one financial asset and displays data in the form of a visual table. The indicator can be used with any broker (with 4/5-digit quotes). The received trading signals can and should be used
FREE
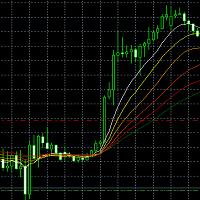
This is an indicator based on PBX .It can show the current trend clearly.Anything you want do not hesitate to contact me Waterfall Line (PBX) is a main method of analyzing the trend of stock prices in the financial field, which was widely used in Europe and America in the early 1990s. Therefore, it is named as a waterfall when it converges and diverges downward. It belongs to the traditional trend line of general trend price. Its real name is the non-linear weighted moving average. It

This index can be traced back to historical transactions, and can clearly see the trading location, trading type, profit and loss situation, as well as statistical information.
Showlabel is used to display statistics. Summy_from is the start time of order statistics. This parameter is based on the opening time of the order.
Backtracking can help us to correct the wrong trading habits, which is very important for beginners to learn manual transactions.
This index is suitable for each time
How To Trade
Execute your trades in 3 Easy Steps!
Step 1: Trade Setup Entry Buy = If daily open market Above Line PIVOT or can Price has touched and closed the candle above Resistance1. Entry Sell = If daily open market Under Line PIVOT or can Price has touched and closed the candle above Support1. Step 2: Set Stop Loss Stop loss BUY ----> You can set stop loss on Line Pivot or Support1. Stop loss SELL ----> You can set stop loss on Line Pivot or Resistance1. Step 3: Set Take Profit Take pro
FREE
How To Trade
Execute your trades in 3 Easy Steps!
Step 1: Trade Setup Entry Buy in Signal Arrow color DodgerBlue. Entry Sell in Signal Arrow color RED. Success Rate ≥ 75% 100:25 Step 2: Set Stop Loss Stop loss BUY ----> You can set stop loss on Line RECTANGEL color DodgerBlue. Stop loss SELL ----> You can set stop loss on Line RECTANGEL color RED. Step 3: Set Take Profit Take profit BUY on RECTANGEL color RED. Take profit SELL on RECTANGEL color DodgerBlue. Strategy SIMPLE Day trading / Swi
FREE

EZT Trade History This is a great tool to analyze past trades or follow current ongoing trades, especially when you using an EA to manage your transactions. You will see the exact candle where the trade was opened and closed. Collapsible floating panel on the chart, free to move anywhere with your mouse. When you using multiple EA’s with different magic numbers, you have 5 options to separate those trades, so you will know which EA opened specific transactions. You can set the day limits how fa
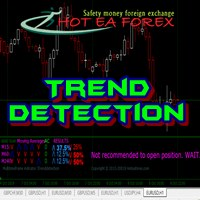
Recognizing trends is one of the most important analytical skills in trading. Not only technical traders, those who are fundamentally leaning to make the forex trend as the basis of analysis to determine entry trading. However, learning how to look at forex trends is not as simple as it seems. If you want signal accuracy to estimate the direction of the next price, then there are advanced methods in learning how to look at forex trends that you need to know. Strategy SIMPLE HOw to read trend mar
FREE
True Pattern - индикатор автоматически ищет и анализирует фигуры технического анализа на графике такие как Флаг, Вымпел, Клин, Двойная вершина/дно. Отображает фигуру паттерном 1-2-3 и показывает потенциальные цели. Данный индикатор является хорошим помощником для торговли как новичку так и профессионалу. Помогает анализировать рынок, благодаря данному индикатору проще находить фигуры на графике. Определение момента входа и выхода производится самим трейдером, индикатор в данном вопросе может пр

KT Heiken Ashi Smoothed is a smoothed version of the standard Heiken Ashi. Moreover, it also plots buy/sell arrows on a trend change. A buy arrow is plotted when it change to a bullish state from bearish state. A sell arrow is plotted when it change to a bearish state from bullish state. Mobile notifications, Email, Sound and Pop-up alerts included.
What exactly is Heiken Ashi Smoothed? It filters out the false signals and noise in the standard Heiken Ashi. It applies the set of two moving a

KT Round Numbers plots the round number levels which are also commonly known as psychological levels in the Forex world. In the context of Forex trading, round number levels are those levels in which there are two or more zeroes at the end. They are named as 00 levels on the chart.
Some traders also consider the halfway points as a valid round number level. They are named as 50 levels on the chart.
Use of round number levels in trading Round number levels work as strong support and resistan

This is a convenient tool if you are used to trading on a clean chart, but sometimes you need to look at this indicator. If you are not sure how to determine the inflection point of a trend and are concerned about how to draw trend lines, then this indicator is for you. From now on, you do not need to sit near the computer and analyze the price, use this indicator carefully.

Trading system for scalping. The indicator shows the direction of the price, the amplitude (channel) of its movement and the pivot point. The system automatically analyzes the market using the tick volume averaging algorithm for a certain period of time. After that, Scalper Thunder compares the data with other analysis indicators to identify potential pivot points. As soon as such a point is found, the indicator shows the price reversal and its current direction on the chart. The essence of trad

This is a multicurrency and multitimeframe indicator that calculates the angle between two points. Points for measuring the angle can be taken from the ZigZag (the last two points), or from the Moving Average (between two given bars), or it can be the closing prices of bars.
Angle measurement is possible in degrees or in radians. You can select the scale for the calculation. For a better understanding of the indicator, you can study the free Angle High Low indicator. In the parameters you can
Not a logical continuation of the ZigZag indicator series is an indicator cut to an absolute minimum.
An important property of this indicator is that it will never redraw the value of a completed bar.
Based on previous indicator algorithms, e.g. ( https://www.mql5.com/ru/market/product/37975 ). Parameters: Depth - is depth of search of a local extremum in bars; On minute calc - is switching ON/OFF of calculation on minute bar (it is switched off - calculation on each tic).
Th3Eng signals wave is a very good indicator to read the trend. But you need to filter the main trend direction with your own strategy. Because this indicator signals are repainted. So for example: Use Moving average 21 to find the trend and if the price is above the moving on higher TF or the current >> open only buy signals from the indicator. Also you can use it on option trading, Not only on forex.
Works with all time-frames. works with all pairs, CFD and cryptocurrency. Sending all alerti
FREE

Индикатор показывает максимальное отклонение от скользящей средней за заданный период. Границы канала могут послужить своего рода зонами перекупленности/перепроданности, от которых может произойти откат цены к центру канала. За этими уровнями и стоит искать дополнительные сигналы для входа в сделку. В настройках индикатора всего 2 параметра - период, за который будет расчитываться индикатор и метод усреднения скользящей средней.
FREE
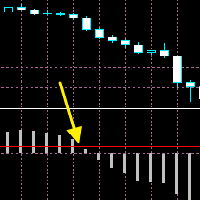
The moment when the MACD line crosses the signal line often leads to a significant price movement and trend changes. MACD Cross Prediction is an indicator that uses OSMA(MACD oscillator) and a red line. You can change the level of the red line on the indicator setting popup(and the red line moves up and down). The alerts(email, mobile push, sound, MT5 alert) will be sent when the MACD histogram touches the red line, which means the alerts can be sent just before/around the time when the MACD lin

KT CCI Divergence shows the regular and hidden divergence created between the price and CCI oscillator. Divergence is one of the vital signals that depicts the upcoming price reversal in the market. Manually spotting the divergence between price and CCI can be a hectic and ambiguous task.
Limitations of KT CCI Divergence
Using the CCI divergence as a standalone entry signal can be risky. Every divergence can't be interpreted as a strong reversal signal. For better results, try to combine it
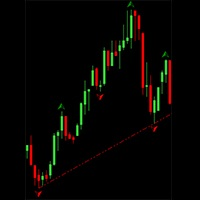
Классический фрактал отличается от остальных тем, что в бычьем фрактале экстремумы предыдущих баров последовательно растут, а экстремумы следующих баров последовательно снижаются. В медвежьем фрактале экстремумы предыдущих баров последовательно снижаются, а экстремумы следующих баров последовательно растут. На основании этих фракталов строятся трендовые линии, где сплошная линия является новой трендовой линией, а пунктирная, "пробитой" трендовой линией.
Параметры: История - Количество баров в

«SMART EXIT» - уникальный индикатор высокой точности, созданный для профессиональной торговли на рынке Forex. Индикатор может работать на более чем 20 валютных парах и обеспечивает до 85% успешных сделок ежедневно. В среднем около 30 точных сигналов в неделю, никаких перерисовок или запаздываний. В своей стратегии индикатор использует лучший профессиональный алгоритм с уникальной логикой, который является эксклюзивной авторской разработкой среди всех существующих алгоритмов. Это торговая методик

Nuestro objetivo es brindar un servicio accesible y de calidad, permitir a los participantes del mercado, comerciantes y analistas por igual, las herramientas necesarias para tomar decisiones comerciales informadas y oportunas.
El indicador de analista DYJ Trend más optimizado, altamente robusto y fácil de usar.
El analista de tendencias DYJ intenta medir las fuerzas alcistas y bajistas en el mercado utilizando dos medidas separadas, una para cada tipo de presión direccional.
El BearsInde

Al tomar decisiones comerciales, es útil confiar no solo en datos históricos, sino también en la situación actual del mercado. Para que sea más conveniente monitorear las tendencias actuales en el movimiento del mercado, puede usar el indicador AIS Current Price Filter . Este indicador solo tiene en cuenta los cambios de precios más significativos en una dirección u otra. Gracias a esto, es posible predecir tendencias a corto plazo en el futuro cercano; no importa cómo se desarrolle la situació

El Indicador Moonwalker MT4 es una poderosa herramienta que puede revolucionar tu estrategia de trading de tendencias en gráficos Renko al rastrear las tendencias del mercado, filtrar las fluctuaciones repentinas y el ruido del mercado con algoritmos avanzados, y proporcionar una fiabilidad única. Esto te permite operar con facilidad y confianza sin el estrés de monitorear constantemente los mercados. Moonwalker no repinta y viene con alertas de sonido y notificaciones push. Si estás buscando l

Se pueden utilizar distribuciones sostenibles para suavizar las series financieras. Dado que se puede usar un historial bastante profundo para calcular los parámetros de distribución, tal suavizado, en algunos casos, puede ser aún más efectivo en comparación con otros métodos.
La figura muestra un ejemplo de la distribución de los precios de apertura del par de divisas EUR-USD en el marco temporal H1 durante diez años (Figura 1). Se ve fascinante, ¿no?
La idea principal que subyace a este i

El indicador MTF Qristalium Arrows es un sistema de comercio semiautomático terminado. Funciona en todos los pares de divisas.
En el indicador están involucrados tres reglas: 1) operar sólo por la tendencia, 2) "comprar, cuando todo el mundo vende y vender, cuando todo el mundo compra", 3) el Precio siempre va en contra de la multitud.
El indicador MTF Qristalium Arrows filtra los datos de la regla en varios Marcos de tiempo con indicadores integrados. Si coincide con la tendencia en la

El indicador "Elvis A" está diseñado para una definición de reversión muy estricta. Con la configuración de autor se establece en el gráfico D1. Saltará muchas señales y elegirá solo las más confiables. Por lo tanto, es mejor instalarlo en varios pares de divisas.
La captura de pantalla muestra un ejemplo de la operación de este indicador como un asesor en un par de divisas con un spread muy grande.
FREE

The indicator ignores sharp fluctuations and market noise and tracks market trends with absolute reliability. It is suitable for trading on small timeframes and on large ones, it ignores sudden price spikes or price movement corrections due to the reduction of market noise around the average price value. For calculations, the indicator uses indicators: iLow, iHigh, iMA, iATR. Since the output signal relies on reliable indicators, it is also reliable. You can configure both a sound signal and se

Note: This is an Arrows Only Indicator. Get paid scanner or free TDI extra indicators here: https://abiroid.com/product/tdi-sharkfin-arrows-and-scanner/
About:
This is a TDI Arrow Indicator for finding the Shark Fin Pattern. It will show an arrow in the current bar if RSI sharkfin is finished forming in previous bar.
What is Shark Fin TDI Pattern?
Upper Shark Fin: In TDI Indicator when Green RSI breaks above a certain level and also breaks upper Volatility band and then breaks below that
FREE

CyberZingFx Volume Indicator is designed to help traders find market reversals with ease. This powerful tool uses a unique strategy that combines both volume and historical price to provide accurate signals for potential market reversals. The indicator displays volume BUY and SELL power values on the right side of the chart for both BUY and SELL. With customizable settings, you can set alerts at different levels to suit your trading style. The most recent alert value is displayed as Alert High,
FREE

Indicator SR levels true in small time frames is very useful for scalping while in bigger ones it is good for day or position trading.
SR levels true can draw 4 support/resistance levels based on defined maximum rebouds from price level. Indicator scans defined number of bars in time axis and defined number of pips in price axis (both sides - up and down) and calculates how much times price was rejected from scanned price levels. At the price levels where maximum rebounds are counted, support
FREE

Indicador de Tamaño de Lote Descubre el tamaño adecuado de lote para utilizar en tus operaciones basado en el margen disponible. Este indicador proporciona información valiosa para la gestión del riesgo. Si el indicador muestra un valor de 0, significa que tu saldo o margen disponible es insuficiente para operar. Es importante mantener niveles de margen adecuados para prácticas de trading seguras. Este indicador está diseñado exclusivamente para la plataforma MT4, una plataforma de trading popul
FREE

One of the disadvantages of the ZigZag indicator when working with advisers is the need to find the latest extremes. For this purpose, various algorithms of history analysis in indicator buffers are used. However, the indicator itself knows these values and can therefore display them. To this target, the ZigZag Minimum indicator ( https://www.mql5.com/ru/market/product/37975 ) has been refined. The zero buffer stores the value of the last maximum. The first buffer stores the value of the last m
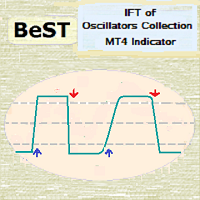
BeST_IFT of Oscillators Collection is a Composite MT4 Indicator that is based on the IFT (Inverse Fisher Transformation) applied to RSI , CCI , Stochastic and DeMarker Oscillators in order to find the best Entry and Exit points while using these Oscillators in our trading. The IFT was first used by John Ehlers to help clearly define the trigger points while using for this any common Oscillator ( TASC – May 2004 ). All Buy and Sell Signal s are derived by the Indicator’s crossings of the Buy or

Gana operaciones con el poder del indicador Macd multi timeframe en una sola ventana. Idealmente lo puedes complementar con nuestro Rsi Multiframe para conseguir poderosas entradas. Pronto ya lanzaremos Momemtum Multi time frame y otros gratis. Mira nuestras señales realizadas con nuestros indicadores, las cuales estan dando resultados increibles. Si lo descargas porfavor dame 5 estrellas . gracias https://www.mql5.com/es/signals/620506
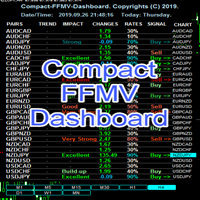
Compact FFMV Dashboard Compact FFMV Dashboard is a little trimmed custom indicator of FULL FOREX MARKET-VIEW DASHBOARD created to give the Traders a full view of what is going on in the market. It uses a real time data to access the market and display every bit of information needed to make a successful trading. It shows as many as 30 currency pairs or as allowed to display in the Market Watch of your MT4 USAGE: For Solo Trading For Basket Trading (See the screenshot on how) For Signal confirmat

G99 GRAVITY
G99 Gravity is a channel indicator for the MetaTrader 4 terminal. This indicator allows finding the most probable trend reversal points. Unlike most channel indicators, G99 Gravity does not redraw. Attach the indicator to a chart, and the alert will trigger once a signal emerges. With our alerting system, you will never miss a single position opening signal! Advantages of the indicator Perfect for scalping. Excellent for identifying trend reversals. Suitable for beginners and expe

Shadow Height mt4 Indicador de sombra.
Muestra el tamaño de las sombras de las velas, en puntos, como histograma. Funciona en tres modos, seleccionables por el usuario. Descripción de la configuración del indicador Modo: modos de funcionamiento del indicador, tres modos: primera altura: modo de visualización de las sombras de la vela superior e inferior; segunda diferencia: el modo de mostrar la diferencia en las sombras de las velas, la diferencia entre las sombras de las velas superior e in
FREE

Automatic marking of the chart with Pentagram models. This model is based on the Expansion Model from Adversa Tactics. Designed to determine the trend and predict possible levels and targets of price correction in the future. The model describes a developing trend. The trend is relevant until the price crosses the trend line of the model in the opposite direction. Levels of rays of the pentagram, level of HP, distances of 100% and 200% of the distance between points 1-4, levels of HP are possibl

CyberZingFx Trend Reversal Indicator - your go-to solution for accurate and reliable trend reversal signals. With its unique trading strategy, the indicator offers you Buy and Sell Arrow signals that do not repaint, making it a reliable tool for catching Swing Highs and Swing Lows.
SCROLL DOWN TO VIEW SCREENSHOTS AND WATCH VIDEO ________________________________________________________________ Trading using CyberZingFx Trend Reversal is Simple Using the CyberZingFx Trend Reversal Indicator is e
FREE

This indicator will provide you with everything you need in order to overcome losses due to human emotions. The indicator determines the moments of a trend reversal and the direction of its movements. This development is equipped with the most modern, adaptable trading algorithms. The main secret of short-term trading is to have information on when to enter a deal. The indicator works great on all timeframes and informs the trader about the most successful moments of buying or selling a currency

This indicator gives signals about a trend change, shows successful signals. High probability of a successful trend, it can be used with an optimal risk to profit ratio. The indicator does not redraw and is not late; it can be used both for piping on small periods and for long-term trading. The indicator algorithm works using open prices, and you can work with a zero bar. It works on all currency pairs and on all timeframes.

The indicator monitors the market trend with very high reliability. Sharp price fluctuations, as well as noise around averaged prices, are ignored. All intersection points will be ideal points at which the direction of the trend changes. Signal points, places where color changes, can be used as points of potential market reversal. This development can be used both for long-term trading, and for piping on small periods. The indiuctor algorithm implements a kind of technical analysis based on the
MetaTrader Market es el mejor lugar para vender los robots comerciales e indicadores técnicos.
Sólo necesita escribir un programa demandado para la plataforma MetaTrader, presentarlo de forma bonita y poner una buena descripción. Le ayudaremos publicar su producto en el Servicio Market donde millones de usuarios de MetaTrader podrán comprarlo. Así que, encárguese sólo de sus asuntos profesionales- escribir los programas para el trading automático.
Está perdiendo oportunidades comerciales:
- Aplicaciones de trading gratuitas
- 8 000+ señales para copiar
- Noticias económicas para analizar los mercados financieros
Registro
Entrada
Si no tiene cuenta de usuario, regístrese
Para iniciar sesión y usar el sitio web MQL5.com es necesario permitir el uso de Сookies.
Por favor, active este ajuste en su navegador, de lo contrario, no podrá iniciar sesión.