Nuevos indicadores técnicos para MetaTrader 4 - 85

BeST_Breakout Strategy is a Metatrader Indicator based on a proprietary algorithm implementing a very powerful tool that can exploit every breakout leading to huge market movements. It timely locates the most likely points for Entering the Market as well as the most suitable Exit points and can be used successfully as a standalone Trading System which often results in huge profits accompanied by very impressive statistics like Success Ratio and Profit Factor.
The BeST_Breakout Strategy is

Displays the local time with the time difference you set.
(It does not correspond to the time difference in 30-minute increments.)
It also displays a price line with a good price, such as 100.000 .100 or .200.
The standard gridlines are displayed with the time and price by MT4, but they are very confusing as they become the broker's time and are displayed at the halfway point along with the price. It hides them and displays gridlines at user-defined time differences and prices in easy-to-und

Customize Your Own Strategy and Get Instant Backtest Results
All Oscillators Data in a single indicator, displayed on the chart. Get a 7-Day Free Trial Version: Click Here (Full Access to The Indicator for 7 Days) The Tangram indicator uses an amalgam of 7 different oscillators , then analyses when the price is in Overbought/Oversold territory, when there's a divergence , and when price is trending . Besides being an indicator that helps you analyse the charts, Tangram also gives you the ab
SPECIAL PRICE Great offers on all products. Great opportunities.
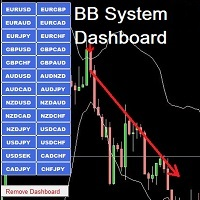
BB System Dashboard is a dashboard that collects signals from the currencies you will select, or from all the currencies of your metatreder by setting the item Check all currency pairs. The buttons are clickable and open the desired chart. Whenever there is a signal, the dashboard warns you with a visual and audio signal. You can immediately open the chart and then open the position. This dashboard will help you to be more profi

The WTR Dynamic Range Indicator is a powerful and deeply customizable range indicator that takes in account the average upward and downward movement of the price in the past trading days. This fully customizable indicator can be setted for a lot of uses and cases:
• Trend trading on level breakouts
• Spotting high probability targets for Take Profits
• Setting a multiple targets for position scaling out The WTR Dynamic Range Indicator calculates the average movements in the long side, the
FREE

Note !!: Because ZO Power needs a lot of historical candles to analyze, so Free Demo version will not show in the first time but it will show after you run enough candle. We recommend you try test Free Demo with backtest time for more than 6 months for H1 charts. /*--------------------------------------------------------------------------------------------------------------------------------------------------------------------------------------------- ZO Power is a measure of trend strength on

SWAP / 3x SWAP - Forex is usually charged a triple swap on Wednesday (midnight Wednesday to Thursday, 11:59 pm server time) and is paid because it is for three days at a time: Wednesday, Saturday and Sunday. Fees of some instruments (DAX30 and others) take 3 Swap on Friday. With our Swap Report Indicator, you get details of your current open and history closed positions in your trading account, helping you gauge your trading net profit or loss.

Trend Follow Me Moving
Trend Follow Me Moving is a trend indicator which based on Moving average indicator.
It'll alert signal on next bar open with an audio or pop up on the chart
when SMA cross above SMMA high average price that the signal "Buy" alert
and SMA cross below SMMA low average price that the signal "Sell" alert. Messages/Sounds (Notifications and sound settings)
Send_EMail - enable/disable sending emails. Audible_Alerts - enable/disable messages in the terminal when sign

The indicator is based on the analysis of the volatility of a trading instrument.
The indicator does not repaint (except for the last candle).
On the chart it looks like 2 lines (estimated support / resistance levels) and displays arrows when a trend changes.
It can be used on any timeframe, but best of all, the indicator shows itself on timeframes from H1 and higher.
Extremely easy to set up and use.
Input parameters:
Sensivity - indicator sensitivity. The lower the value, the fast
BO Trade Simulator, es un excelente indicador que nos permitirá testear de manera correcta y en tiempo deseado nuestras estrategias para Opciones Binarias. El Indicador te permite poner monto, tiempo de expiración y porcentaje de ganancia, todo lo que un trader de Opciones Binarias necesita sin las necesidad de testear con cuentas demos en distintos brokers ya que todo lo vas a poder realizar desde tu plataforma de Metatrader 4. Su uso esta pensado para que sea sencillo y practico, desde las opc
CRAZY SALE! Was 250, NOW 50 USD till the end of MAY!!!
---> Check all the other products <---
The WTR Dynamic Range Indicator is a powerful and deeply customizable range indicator that takes in account the average upward and downward movement of the price in the past trading days. This fully customizable indicator can be setted for a lot of uses and cases:
• Trend trading on level breakouts
• Spotting high probability targets for Take Profits
• Setting a multiple targets for position

Определение текущей тенденции - одна из самых важных задач трейдера независимо от стиля торговли. Индикатор Trend Selection поможет с достаточно высокой вероятностью это сделать. В расчетах индикатора используется авторская методика. Trend Selection подходит для любой валютной пары, любого таймфрейма, и не меняет свои показания. Цвет гистограммы зависит от силы текущей тенденции: чем темнее гистограмма, тем сильнее текущая тенденция. На текущий момент индикатор имеет два метода расчета сиг

H I G H - P R O B A B I L I T Y - B R E A K O U T T R E N D L I N E I N D I C A T O R This is no ordinary trendline indicator. It has a highly-probability algorithms incorporated in the script to display only trendlines that may give a very high chance of price breakout. The indicator is not a stand alone indicator. Trader should interpret it together with their very own analysis technique to come up with a more efficient trading strategy. You can use with it other trend indic
FREE

PM Redefine : Is Simply, Simple, Straight and Direct in opening orders and closing of orders;
PM Redefine : Can be run in all type of instrument.{Forex, Commodity ,Stock, or Cryptocurrencies}.
PM Redefine : Can be run in all type of TimeFrame,{M1,M5,M15,M30 , H60, H240, D, W, M}.
PM Redefine : can be used for scalping and day trading.
Input Parameters
typeFrom_0_to_9: type in between 0 and 9 ; upper_levelAlert: if line cross this predefine level up , Arrow Buy show if : showArrow =true: lo

Rua Pinbar This is an indicator to help you quickly identify pinbar candles in the chart. Can be used on any currency pair and any time frame you want. This indicator is often used to determine entry points. You can refer to the product here: https://www.mql5.com/en/users/phamruacoder/seller
A product of Ruacoder Get code indicator and robot (EA) as required.
FREE

Rua Trend Pro This is an indicator that helps identify Trends relatively accurately. Can be used for any currency pair. And usable on all time frames. Recommended use from M15 and above. You can use it to identify trends, or to identify reversals very well. Input parameters: in_TradePeriod in_StopPeriod in_Alerts A product of Ruacoder Provide code indicator and EA services upon request
FREE

With this app you can find the stop out level live or without opening a transaction.
The application consists of 3 boxes, you can enter the amount of money in your Balance box account or it will automatically calculate the current account amount. SELL lot size and BUY lot size can be entered, or trades that are currently open will be calculated automatically. Hedge transactions are calculated automatically.
If you press the S key of the keyboard, you can access the boxes with the values ente
FREE

Broker Tester allow you to test the real terms applied by your broker. Using the 28 forex cross, this indicator records the changes in spreads for the duration of the test. It shows moreover the swap applied for long and short position for multiday trades. You can have a clear expression of the quality of your broker in a short time and maybe you can use this information to negotiate better conditions. In the input parameters, you can enter prefixes and suffixes used by your broker for naming

Индикатор LevelFractal - разработан на основе всем известного индикатора Fractal, он берет значения нескольких ближайших к текущей свече фракталов, вычисляет некое среднее значение и, исходя из него строит уровни поддержки и сопротивления. Когда цена пробивает один из этих уровней, появляется сигнал или на покупку или на продажу, на графике они обозначаются стрелками. Индикатор работает на любом таймфрейме и на валютной паре. По вопросам приобретения полной версии пишите в личку.

Добрый День уважаемые трейдеры! Вашему вниманию индикатор созданный и работающий на базе трендовика ADX, для торговли на смене направления движения который учитывает коррекцию и даёт возможность на ней заработать. Применяю этот индикатор для скальпинга. Рекомендую таймфреймы от 15 ти минутного(М15) до часового (Н1) периодов. Красный кружок сигнал на продажу- Sell) Зелёный кружок сигнал на покупку Buy) Чем меньше ваш таймфрейм тем меньше пунктов вы зарабатываете. Важно выставлять стопы! !В
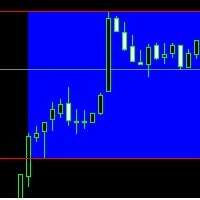
Hi, This is only a simple indicator. It selects a range between two times - you can choose it from how long. Don't wait miracle. This indicator is ideal choose for your break out strategy, for example London break out strategy. Happy trading! We wish you the best! Yours sincerely: MarginCallMasters Team Warning! This is only an indicator, it will not open position or orders to your account.

The MACD indicator is based on volume , which can offer us a very valuable type of information (it marks the long or short strength of each candle), es pecially if we are operating in shorter time frames. Green = bullish signal; Red = bearish signal; Blue = MACD volume
Parameters: Fast: Numbers of bars used for fast period calculations Slow: Numbers of bars used for slow period calculations

The RSI Basket Currency Strenght brings the RSI indicator to a new level. Expanding the boundaries of TimeFrames and mono-currency analysis, the RSI Multi Time Frame Currency Strenght take the movements of each currency that composes the cross and confront them in the whole basket of 7 crosses. The indicator works with any combination of AUD, CAD, CHF, EUR, GBP, JPY, NZD, USD pairs and with full automation takes in account every RSI value for the selected Time Frame. After that, the ind

Currency Strength Meter is the easiest way to identify strong and weak currencies. This indicator shows the relative strength of 8 major currencies + Gold: AUD, CAD, CHF, EUR, GBP, JPY, NZD, USD, XAU. Gold symbol can be changed to other symbols like XAG, XAU etc.
By default the strength value is normalised to the range from 0 to 100 for RSI algorithm: The value above 60 means strong currency; The value below 40 means weak currency;
This indicator needs the data of all 28 major currency pair
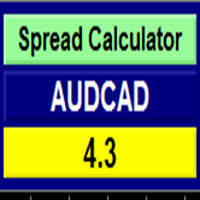
Currency Spread Calculator
This indicator is created with the aim of letting the Traders know the exact points of the spread on the currency pair they are about to buy or sell.
This will safe them of paying exorbitant spread over a single currency pair procurement. Imagine a normal spread become wider from 2 or 3 pips to 15pips or more when there is volatility in the market. It is absolutely outrageous looking for just 20 pips and paying another 20 pips as spread over a currency pair!
A
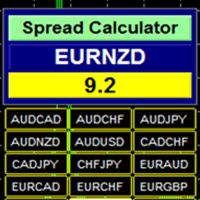
Currency Spread Calculator Plus
This indicator is created with the aim of letting the Traders know the exact points of the spread on the currency pair they are about to buy or sell. What makes it a PLUS is that Symbol/Time frame Changer is coded with this indicator to make it easier navigating from one currency pair to another and one time frame to another on the same chart window without having to open tens of chart window in order to study more currency pairs. It saves time, energy, stress

The Point61 indicator is the result of many years of monitoring of price behavior of currency pairs and metals.
It is not a secret, that in times of uncertainty, traders are looking for possible levels of support and resistance - the point, where price should stop its movement.
There are 2 possible scenarios at these points:
1. Reverse (correction) to the opposite direction;
2. Breakthrough to continue movement. Very often these points are used to set stop orders - TakeProfit or
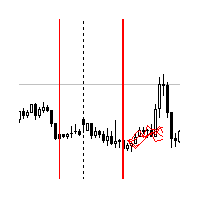
Indicator shows the price history. The history is read for vertical lines and output for the main line. Those lines are the time cursors. You can use the indicator to analyze the price cycle over time, thereby predicting its movement. The duration of the forecast and the number of time cursors can be set in the indicator parameters. Additionally, you can link the main line to a new bar. Lines can be moved manually.
Analyze the cyclical nature of the market using this indicator.
Indicator pa

Arrow indicator with trend filter. Generates trend input without delays or delays - on the emerging candle. Suitable for use on any trading tools and timeframes. Easy to use, contains the direction of the trend in the form of a histogram lines and signal generator.
Input parameters
Period Trend Line - Period of the Histogram Line Signal Generator Period - If the period is longer, then the arrows are less Play sound Display pop-up message Send push notification Send email Sound file signal -
FREE

One of the most beloved areas in price chart analysis is the use of graphical analysis. The state of the market, the phase of its movement, largely determines the success of the trader and his chosen strategy. The intelligent algorithm of the Trend RB indicator accurately determines the trend, filters out market noise and generates input signals. The indicator uses a color alarm: blue - when changing from descending to ascending, and red - on the contrary, to descending. You can use the indicat

The indicator is simple and clear, making the work of the trader as easy as possible and giving clear signals to enter the market.
This indicator has two settings for the period. Which makes it more flexible. And at the same time, many false signals do not appear. The larger the period, the smoother the indicator itself will be.
It can be used both independently and together with other indicators of technical analysis (including with oscillators), as well as with another same indicator (wit
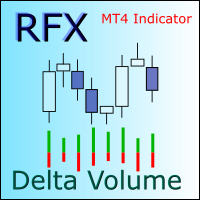
Note: This indicator cannot be tested in the strategy tester. Please download the free demo version from https://www.mql5.com/en/market/product/48627 RFX Delta Volume is an indicator to show bullish and bearish volumes separately for each trading candle. The indicator uses history data of one minute (M1) to estimate the true bullish and bearish volumes in a sub-window. There are two modes of operations for this indicator. In mode "Delta Volume", the indicator shows the difference in bullish a

The RSI Basket Currency Strenght brings the RSI indicator to a new level. Expanding the boundaries of TimeFrames and mono-currency analysis, the RSI Multi Time Frame Currency Strenght take the movements of each currency that composes the cross and confront them in the whole basket of 7 crosses. The indicator works with any combination of AUD, CAD, CHF, EUR, GBP, JPY, NZD, USD pairs and with full automation takes in account every RSI value for the selected Time Frame. After that, the indic
FREE

The Stochastic Basket Currency Strenght brings the Stochastic indicator to a new level. Expanding the boundaries of TimeFrames and mono-currency analysis, the SBCS take the movements of each currency that composes the cross and confront them in the whole basket of 7 crosses. The indicator works with any combination of AUD, CAD, CHF, EUR, GBP, JPY, NZD, USD pairs and with full automation takes in account every stochastic value (main line) for the selected Time Frame. After that, the indica
FREE

The Stochastic Basket Currency Strenght brings the Stochastic indicator to a new level. Expanding the boundaries of TimeFrames and mono-currency analysis, the SBCS take the movements of each currency that composes the cross and confront them in the whole basket of 7 crosses. The indicator works with any combination of AUD, CAD, CHF, EUR, GBP, JPY, NZD, USD pairs and with full automation takes in account every stochastic value (main line) for the selected Time Frame. After that, the indicator

Forex Pro Analyzer. Find top performing strategies on your MT4 account
This tool enables you to analyze all your Forex trades executed manually or by an expert or several EA's.
It will group and examine all trading positions by magic numbers, and will show you trading performance for each strategy so you can spot the winners immediately.
You get Fast trade statistics fast a on your MT4 chart window.
Imagine you want to test 10 different EA's on one single mt4 terminal with this tool it wi

Индикатор отображает регнессионный канал с сопровождением каналов фактически создавая уровни поддержки и сопротивления.
Уровни поддержки и сопротивления являются одним из важнейших элементов технического анализа. С этим утверждением согласится любой трейдер. Уровни в трейдинге используются непосредственно, открывая и закрывая ордера у границ диапазона, очерченного ими. Также уровни применяют баланс спроса и предложения в своих торговых стратегиях на различных временных интервалах.
Визуально
the indicator for trading binary options is excellent for traders using scalping or trading from support levels of resistance or for their breakdown, the indicator is recommended to be used in conjunction with additional filters to avoid entering a losing trade, signal can also be used with Bollinger Bands Signals are formed on the current candle to enter the next

Risk Management is one of the most critical elements of profitable trading. The 5TT Risk Management Tool is very effective at helping Forex traders calculate the lotsize to any trade; straight on the MT4 charts. The Tool will also display the actual Dollar value of the risk pre-selected. No indicator parameters required. All data input is done on the Tool displayed on the each chart on which the indicator is placed. FOllow the accompanying video here...

Индикатор ищет подобную ценовую структуру, сравнивая с последней ценовой структурой. Размер паттерна (грубо говоря количество переломов зигзага) настраивается (всегда меньше на 1, чем введено - нулевой перелом не считается). Все найденные совпадения отмечаются прямоугольником. Так же к паттернам существует быстрая навигация с помощью кнопочек "Next patt" и "Prev patt". В индикатор вшиты два индикатора типа ЗигЗа г : стандартный зигзаг и пользовательский , моей разработки. Параметры настройки ста
Indicator Rua Alert Trend Line. This indicator will notify when the price breaks any trendline on the chart. Notifications will be sent to the phone and on MT4. Custom parameters: in_NumbersAlert: The number of notifications that will be sent when the price breaks the trendline. A product of Ruacoder Provide code indicator and EA services upon request. Contact: Telegram : https://t.me/Ruacoder
FREE

This indicator is equipped with a risk and reward calculation, whether it is the calculation of lots to be used, the determination of the price of stop loss and take profit, and also the notification of whether the colors that occur can be used or not. You can adjust the risks that make you calm by changing the settings provided in the indicator menu. this indicator can work well using H1 time frame. You only wait for an indicator command when you want to open an position. for further learning

The BuySellAlert free arrow indicator is developed based on the use of HMA, Laguerre, CCI, and ATR. The BuySellAlert free arrow indicator: generates possible entry points for BUY and SELL ; displays current profit ; displays current spread. The profitability of the indicator is shown in the screenshot on the example of the GBPUSD pair Does not redraw and works on opening bar. Timeframes - M1-H1. Recommended TimeFrame-M15. The BuySellAlert free works only with AUDUSD . Version without restric
FREE
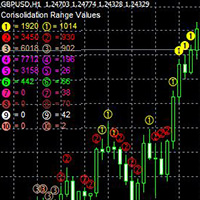
20 Consolidation ranges are derived using the current bid price, then adding/subtracting the input parameter from the bid price to get each consolidation range. For instance, the input parameter default is .01. If the current bid price is 1.09616 (EURUSD), then the upper limit for the first consolidation band is 1.10616 and the lower limit is 1.08616. 10 consolidation bands are above the bid price and 10 are below. Closed prices for each period are counted within each range and the totals are s

Great offers on all products. Great opportunities. The Super Trend Precision indicator is a performing variant of the classic super trend. The indicator manages to anticipate a possible direction that the market will take, you can see from the pictures. First by a warning with the crossing of the first red line and then by the confirmation with the crossing of the second green line. It is mainly a trend indicator. It could also be used with the EA Trend Candle Sell. Happy Trading.

MarketSentiment - индикатор рыночного настроения, выполнен в виде осциллятора. В основе индикатора лежит принцип: цена, как правило, идет против толпы. Если большинство трейдеров заключает сделки на продажу, цена часто идет вверх и наоборот. Гистограмма индикатора показывает какие сделки преобладают сейчас на рынке, если гистограмма красная, то больше совершается сделок на продажу, если зеленая - то на покупку. Индикатор очень прост в использовании и не требует дополнительных настроек. Лучше вс

Scalper Mate Muti-Symbols This indicator signals significant price movements compared to the average over a defined period, making it easy to spot potential trading opportunities. It takes into account not only price movements but also the spread value of each symbol, providing a more accurate picture. You can use this indicator for multiple symbols, up to 8 pairs, as specified in the input parameters. With its flexible settings, traders can easily customize it to suit their individual prefere
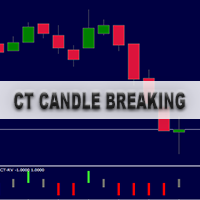
O indicador CT Candle Breaking foi desenvolvido para facilitar a identificação dos rompimentos de velas e para filtrar os movimentos e a força das tendências. Ao observar o comportamento do indicador, podemos ver mais claramente os pullbacks, as continuações e as reversões das tendências, podendo ser usado em qualquer timeframe. A cor verde representa o rompimento da máxima da vela anterior A cor vermelha representa um rompimento da mínima da vela anterior A cor cinza representa um fechamento d

Como comerciante de divisas, comprende el valor de la estrategia comercial de Fibonacci en el análisis técnico. Sin embargo, dibujar y ajustar manualmente los niveles de Fibonacci puede llevar mucho tiempo. Ahí es donde entra en juego el indicador Fibonacci Of Yesterday Ultimate . Está diseñado específicamente para operadores que utilizan la estrategia Fibonacci basada en la acción del precio del día anterior, ahorrándole tiempo y esfuerzo. Este innovador indicador identifica automáticam

La idea de este indicador es dibujar RSI en forma de velas que se pueden comparar con gráficos de precios para generar señales de compra y venta. El indicador no es invención mía. Lo fundé en Internet hace varios años. Actualicé el código, agregué funciones de alerta, agregué el grupo de herramientas Bermaui Utilities.
El indicador calcula el RSI de todos los precios que se utilizan para dibujar velas (RSI de apertura, máximo, mínimo y cierre). Utiliza el más alto de ellos para dibujar la mecha

Do you want to trade quickly, easily and get daily profit? Then our new indicator was created just for you! TURN is an author multi currency strategy that simultaneously determines the end of a trend, entry points and estimated profit levels for each transaction. The indicator can determine entry points in any trading period, starting from the chart M5 to W1. At the same time, for the convenience of the user, the entry point in the form of an arrow is always drawn at a certain point and the rec
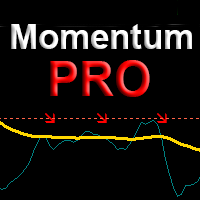
Professional version of the Momentum indicator. Works great on trending currency pairs, and also accurately shows where to top up positions by trend. It displays the direction of entry on the chart with arrows and alerts when an entry point appears. With a minimal interface has high functionality. Features It has no lag and gives a noticeable advantage over the standard Momentum indicator Simple and intuitive graphical interface, minimum settings. Settings of each moving for your trading style.
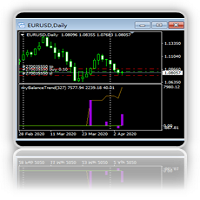
Account Fund Income Trend Line Indicator 1. This indicator is used to automatically draw a curve and a histogram of the profit amount of the trading order that has been closed in the current account and the account balance after the position,and the three data of the transaction volume, which is applicable to all cycles of the chart.2. The three data can be exported into CSV files by date, which is convenient for data analysis of third-party software. 3. The indicator contains an external para

As per name Strength, This Indicator is a affordable trading tool because with the help of Popular Developers & Support of M Q L Platform I have programmed this strategy. I tried to input different types and different periods of Calculation regarding Support Resistance, Trends, Trend lines, Currency Strength, Oversold and Overbought Indications for good results. Furthermore, I have also care about Adjustable Settings So Trader can easily get in touch with market in another way also. What
FREE
Extremums and Candles
1. Description The Extremums and Candles (EC) indicator is a custom indicator based on the visual analysis of candles. The indicator displays the direction of price movement and extremes for the studied period of time. The EC indicator is designed according to the principle that candles inside the next one or inside the previous one, regardless of their type and the length of their shadows, are not taken into account when determining the direction of marke
SPECIAL PRICE Great offers on all products. Great opportunities. BB System Indicator It is an indicator based on the Bollinger Bands and the intersection of signals deriving from three WPR. Bollinger Bands is one of the best indicators that together with three crisscrossing WPRs, provides valid high percentage signals. For us passionate traders of bollinger bands, who know their validity, this indicator is certainly suitable. If you are interested soon I will put my EA ICHIMOKU CONSOLE on sale

Determined Trend is a direction indicator for determining a trend.
You need to understand that any dial indicator is just a visual waveform. As a rule, such Forex indicators contain a whole trading system, process information from several technical instruments and the appearance of its “arrow”? final calculation result. The indicator itself evaluates how strong a signal appears in the market, signals about it, and the trader can only make a trading decision.
The Determined Trend indicator v

An indicator from the zigzag family with levels. First of all, I will point out arguments in favor of the advisability of using a level indicator. They give the trader the following benefits:
Alternative points of view - the level indicator helps to look at the levels from the side, compare them with several automatic systems, identify errors;
Saving time - reducing the cost of effort for self-building lines;
Exact mathematical calculation - quick calculation of levels, ratios of indicato
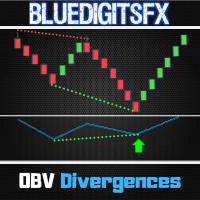
MT5 Version Available Here: https://www.mql5.com/en/market/product/50538
Telegram Channel & Group : https://t.me/bluedigitsfx
V.I.P Group Access: Send Payment Proof to our Inbox
Recommended Broker: https://eb4.app/BDFXOsprey
* Non-Repainting Indicator To Trade Divergences for any Newbie or Expert Trader ! BlueDigitsFx's OBV Divergence draws divergence lines on the chart and on the On Balance Volume (OBV) Indicator. Performs Amazingly at significant price areas such as support

Trend Giver is a Simple To Use indicator.
Good for Scalping and Trend Following.
if you need help on how to use this indicator,
am here for you.
Trend Giver: is for every class of traders, and can be used for Forex Trading, Binary Option, and Cryptocurrencies. Be it Currency , Commodity ,Stock, or Cryptocurrencies.
It does not repaint and comes with all type of Alert.
Trend Giver : Can be run in all type of instrument.{Forex, Commodity ,Stock, or Cryptocurrencies}.
Trend Giver : Can

SignalRB - the arrow indicator shows potential entry points into the market in the form of arrows of the corresponding color: up arrows (blue) offer to open a purchase, down arrows (red) - to sell. The appearance of arrows may be accompanied by sound signals if the sound option is enabled. It is supposed to enter the next bar after the pointer, but there may be non-standard recommendations for each strategy.
SignalRB visually “unloads” the price chart and saves analysis time: there is no sign

The median indicator is a type of technical analysis tool commonly used in forex trading. It is based on calculating the median price of a currency pair over a specific period of time. The median price is the middle value between the high and low prices. Compared to the widely used moving average (MA) indicator, the median indicator offers a unique perspective on the market. Here are some advantages of using the median indicator: Robustness to outliers: The median is less affected by extreme pr

Simple indicator - show potential entry points in the form of changes in the color of lines of the corresponding color. Entrance to the next bar is expected after the color changes, but there may be individual recommendations. But do not forget that the approach should be comprehensive, indicator signals require additional information to enter the market. It is practically not late, behaves correctly in the periods of speculation.
This is one of the few indicators that reliably works on tradi
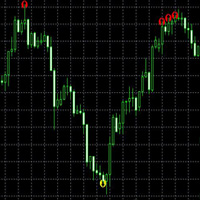
The Breaking Highs and Lows Indicator finds areas of support and resistance based on past trending activity. It uses an algorithm to compare jumps in the periods of highest highs and lowest lows. It compares the current period with the prior period to see if there is a significant jump in periods that it has been the highest high or the lowest low for. For instance, if the current period has been the highest high for 100 days, where the prior period was the highest high for 5 days, this would be
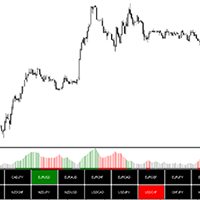
For those who already know EasyADX: https://www.mql5.com/en/market/product/32503
EasyADX Screener is the multi-pair version which simplifies the use of the indicator. It saves the resources of your computer, for example for the simple version, you will have to open all the pairs in metatrader to analyze them with the indicator but the multipair version, you launch it on a pair of your choice and it task to analyze all the pairs you pass to it in parameters:
- Button lights red, Bearish tren

Определения текущей тенденции одна из самых важных задач трейдера не зависимо от стиля торговли. Индикатор Price Detect Volume поможет с достаточно высокой вероятностью это сделать. Price Detect Volume - индикатор распознавания тенденции, использующий авторский алгоритм расчета, использующий объемы. Показания индикатора не изменяются не при каких условиях. Также с помощью индикатора можно наблюдать за коррекцией цены в сторону глобального тренда, определять возможные границы окончания отката
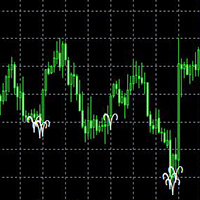
This indicator averages the last 5 bars (determined by the input parameter 'Average_Bars' defaulted at 5 which can be adjusted). Muliplies this average volume by the input parameter 'Multiply_Volume' (default 1.5), then compares this to the current volume bar. If there is a significant increase in the current volume, the indicator is flagged. This is to determine when the 'big players' buy/sell into the market, or if there's significant activity behind a price increase/decrease.
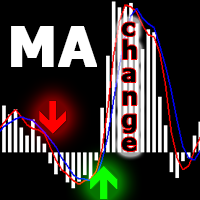
Moving Average Change
Do you wonder where to take profits? Have you ever searched a simple strategy to execute trades? The Moving Average Change indicator is a perfect product for you. The indicator is perfect for finding divergence on charts. It works perfectly on any timeframe but keeps in mind m1 to m15 will be short-lived signals. You can still use it to scalp forex indices and commodities. The indicator also has an option for backstep where you can check the change in MA value between not
El Mercado MetaTrader es la única tienda donde se puede descargar la versión demo de un robot comercial y ponerla a prueba, e incluso optimizarla según los datos históricos.
Lea la descripción y los comentarios de los compradores sobre el producto que le interese, descárguelo directamente al terminal y compruebe cómo testar el robot comercial antes de la compra. Sólo con nosotros podrá hacerse una idea sobre el programa, sin pagar por ello.
Está perdiendo oportunidades comerciales:
- Aplicaciones de trading gratuitas
- 8 000+ señales para copiar
- Noticias económicas para analizar los mercados financieros
Registro
Entrada
Si no tiene cuenta de usuario, regístrese
Para iniciar sesión y usar el sitio web MQL5.com es necesario permitir el uso de Сookies.
Por favor, active este ajuste en su navegador, de lo contrario, no podrá iniciar sesión.