Nuevos indicadores técnicos para MetaTrader 4 - 98

Voodoo Scalper Bars enjoy scalping. Color change trend changed.
Works in EURUSD/GBPUSD/XAUUSD/USOIL/US500/USDJPY/USDCAD/JP225/USDTRY/USDMXN and CFD's all pairs
The input parameters are optimized for all pairs best timeframes M1 and M5 Voodoo Scalper Bars used Bar Charts
Signal on close of a bar.
DOES NOT repaint. DOES NOT repaint. DOES NOT repaint. DOES NOT repaint.
DOES NOT recalculate. DOES NOT recalculate. DOES NOT recalculate. DOES NOT recalculate NOTE : SCALPING COLOR CHANGED FOLLOW

This is a simple PriceTMA bands, non repaint! it can be used for a trend following system or sometimes reversals. as a main signal or a filter for others strategies, it depends on the trader main strategy. calculations for this indicator are a combined Algorithm between moving averages "MA" and average true range"ATR". good luck with your trading! i hope it is helpful Cheers

This indicator is just a simple ATR indicator. It calculates the Average True Range and let you tell it to show the percentage of the ATR. You will then see the % of the ATR on the screen. I like to use it to calculate different things for my trading. If I use the really great AW Recovery System ( https://www.mql5.com/en/market/product/28868 ) there is a great strategy made by the developer, where you watch the daily ATR and set the steps calculated on part of the ATR. So if you put the Part of

This is triangular moving average(TMS). TMS uses Simple Moving Averages for moving average calculation. If TMA periods is 5,five SMAs are used for calculation. TMA weights middle part of the price series. In other words,TMA is less noisy and more accurate .
Input Parameters TMAPeriods ----- Defines perids for TMA calculation.
ModeForTMA ----- Defines mode for TMA calculation.This is normally SMA.
AppliedPriceForTMA ----- Defines applied price for TMA calculation. ShowNormalMA -----Show norma

В основе индикатора TDI лежат следующие индикаторы: RSI, Moving Average, Bollinger bands, но основным из них нужно выделить RSI, весь расчет индикатора завязан от его значений.
Зеленая линия (линия RSI) – сглаженные простой (по умолчанию) скользящей средней значения индикатора RSI, период сглаживания 2.
Красная линия (сигнальная линия) – сглаженные простой (по умолчанию) скользящей средней значения индикатора RSI, период сглаживания 7.
Синие линии – индикатор Bollinger bands по умолчанию п
FREE

The Signal Strength Meter is a Multi-Currency, Dual Timeframe Interactive Indicator, which calculates the strength of buy and sell signals, and displays a score for each symbol on a display board. Get a 7-Day Free Trial Version: Click Here (Full Access to The Indicator for 7 Days) Check Video Below For Complete Demonstration, and User Manual here . Key Features:
Allows you to see multiple currency signals from one chart Analyses the signals from more than a dozen classic indicators Identi

ZhiBiTMG es una colección de tendencias e indicadores de martingala para todos los segmentos del mercado y todos los ciclos de gráficos. Muchos indicadores en el mercado violan la tendencia pero afirman ser precisos, pero ¿son realmente precisos? De hecho, no es exacto! Porque el mercado debe ir con la tendencia. Este indicador ZhiBiTMG da la señal de martingala en la premisa de la tendencia. Esto estará en línea con las reglas del mercado. Instrucciones de uso: La línea roja es la línea de tend
This indicator was specially developed to support the powerful day trading strategy described in the book "The Price in Time" . The NTZ BOX indicator automatically creates: The Day separators The No Trading Zone divided with the Green Box, the Peach Box and the Turqoise Box Extensions of the long and short Take Profit levels The Yellow Box to display the range of the Asian session The Money Manager for a perfect Position Sizing calculated on your risk percentage Using the NTZ BOX indicator will

BeST_Trend Exploiter is a Metatrader Indicator based on a smart proprietary algorithm which can detect the market Median Trend while it filters out the noise providing Buy and Sell Signals and also wherever it is applicable it provides us with TP Levels of High Probability. Additionally as it has Built Inside all the necessary features it can be used as a Complete Strategy of very Impressive Results. Essential Advantages of the Indicator
Clear and Easily Understandable trading rules. Real Time
This indicator was developed to support multiple timeframe analysis. In the indicator settings, the user can set the color, width, and style of the horizontal lines for each timeframe. This way, when the horizontal lines are inserted into the chart, they will be plotted with the timeframe settings.
MTF Lines also allows visibility control of another objets like rectangles, trend lines and texts.
This is a product developed by Renato Fiche Junior and available to all MetaTrader 4 and 5 users
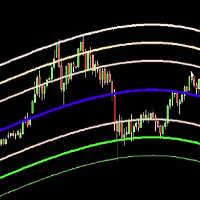
The Belkhayate center of gravity indicator is best used to confirm major turning points, and distinguish price extremes. Generally if price reaches the upper or lower levels one should expect a turn around coming soon, or at least a pull back towards the centre line if there is a strong trend. The upper and lower levels are red and green lines.
Our indicator use the same parameters as the well known trader M.Mostafa Belkhayate the inventor of the indicator, allow the use of buffers for your EA

CSS " currency strength slope " is a a multi currency strength indicator that use Forex major currencies, EUR, USD, CAD, AUD, NZD, JPY, CHF, GBP. it use 28 major pairs to calculate the power of every currency using a based moving averages algorithm : you will see volatility clearly between currencies. input: MA Fast & Slow. - MA Mode : simple, exponential, smoothed, linear weighted
- Applied Price : close, open, high, low, median price, typical price, weighted price.

Supply Demand Zone Pro Indicator works with all products and timeframes. It is using a new calculation method, and now you can select the desired zone on any timeframe! Strongest Zones are already enabled by default This is a great advantage in trading.This indicator has a built in backtester enabled by default, just move the chart.
Supply and Demand ?
Supply is a price zone where sellers outnumbered buyers and drove the price lower. Demand is a price zone where buyers outnumbers sellers and

This indicator Super MA Pluss indicator.Indicator displays trend movement. Indicator calculates automatically line. Features
FiltPer - displays indicator period. How to understand the status: If the arrow is green, trend is up. If the arrow is red, trend is down. /////////////////////////////////////////////////////////////////////////////////////////////////////////////////////////////////////////////////// //////////////////////////////////////////////////////////////////////////////////////

Use of support and resistance in systematic trading is very subjective. Every trader has their own idea and way to plotting the support and resistance levels on the chart. KT Support and Resistance indicator take out this ambiguity out of the situation and automatically draws support and resistance levels following an algorithmic approach using a unique multi-timeframe analysis.
When launched on the chart, It immediately scan the most significant extreme points across all the available timefr

Индикатор внутри коробки считает количество баров и высоти коробки. фильтрация коробки происходит с помощью пробоя в пунктах или в процентах. Входные парамеиры Минмальное количество баров в нутри коробки Максимальное высота коробки Варянт величины (фылтрация коробки) величина в пунктах после пробоя коробки величина в % после пробоя коробки Максимальное количество стрелок, сигналы на покупку или на продажу.

The elite (V3) multi-indicator suite from JoaquinTrading specifically geared towards Forex & binary options, including regulated exchanges such Nadex, Cantor Exchange, and other binary option brokers.
The Probability Tool Suite Elite will provide the given win/loss outcome probabilities of up to 10 strike levels, a specific expiration duration, based on a combination of up to 16 indicators, rules, or conditions and derivative behavior (i.e. expiry, touch, touch & retrace). Using this indicat
El ejército de perros militares le ayudará a identificar los puntos de entrada para el procesamiento amenaz. Trabaja para todos los-18. Puede abrir los niveles ADR desde la configuración haciendo doble clic en la rápido. Si desactiva la función ADR, encontrará más transacciones.
En particular, además de su propia rápido, le permite pasar sus entradas de procesamiento a través de un filtro de mejor calidad.
¿Quieres que el nivel ADR prometa un cierto volumen diario y señale el comercio cuand
Keltner MTF (Not repaint!!!) is a channel indicator that can display price channels from different timeframes on a single chart of quotes. For example, on the H1 chart, you can see at the same time the Keltner price channel from the M15 and H4 timeframe. This tactic makes it possible to more clearly understand the tendency of price movements, to determine trading goals and points for making deals. How the Keltner MTF Indicator Works The Keltner MTF indicator can be used both - for trading in

The principle of the indicator. The StatChannel ( SC ) indicator is a development of the Bollinger Bands indicator ( ВВ ). BB is a moving average, on both sides of which two lines are drawn, separated from it by standard deviations std multiplied by the corresponding coefficient. At the same time, a moving average with an averaging period (2n + 1) bars is always obtained lagging behind n bars. Sliding std is also lagging behind on n bars, also calculated by (2n + 1) points. Such
Sessions PRO is a perfect tool which divide your chart screen by 3 main market sessions: 1> asian 2> european (with division for Frankfurt and London start) 3> american
Sessions PRO is perfect especially for trading indices, where main pivot points often occurs along with new market center enters the market. With Sessions PRO you see what events happened at their exact corresponding time - European and American moves and pivot points are much more important than asian. Stop analyzing your char

We stopped creatin small tools for MT4. Our focus are on MT5. Only very useful tools maybe we will develop to MT5. New Candle Alert is a simple indicator that notify you when a new candle is formed.
You can modify the notification message that will appear for you. The alarm sound is default by meta trader program.
MT5 version: https://www.mql5.com/pt/market/product/37986
Hope you enjoy it. Any doubt or suggestions please notify on private or by comments.
See ya.
FREE

The indicator is made on the basis of the algorithm put in the ZigZag History indicator ( https://www.mql5.com/ru/market/product/37376/ ).
In the real option there are no additional buffers and an opportunity to trace work history.
It causes the minimum involvement of random access memory, however productivity practically does not improve. Attention! The Price noise parameter - has significant effect on formation of extrema. Parameters: Depth - is depth of search of a local extremum in bar

This indicator alerts you when/before new 1 or 5 minute bar candle formed. In other words,this indicator alerts you every 1/5 minutes. This indicator is especially useful for traders who trade when new bars formed.
*This indicator don't work propery in strategy tester.Use this in live trading to check functionality.
There is more powerful Pro version .In Pro version,you can choose more timeframe and so on.
Input Parameters Alert_Or_Sound =Sound ----- Choose alert or sound or both to not
FREE

This indicator alerts you when/before new candle bar formed. In other words,this indicator alerts you every 1/5/30/60/240 minutes.
This indicator is especially useful for traders who trade when new bars formed.
*This indicator don't work propery in strategy tester.Use Free Version to check functionality in live trading.
Input Parameters Alert_Or_Sound =Sound ----- Choose alert or sound or both to notify you when new bar is coming.
Enable_1mBarAlert ----- Enable alert for 1 min bar
dif
The brand new trading indicator using the box breakout strategy is presented by KING.Ai. This indicator with four-mode alerts is developed by KING.Ai ONLY. It is probably impossible that you could find a box breakout indicator like this one. It is very difficult for you to trade with the box breakout strategy as there is limited time for traders to monitor every currency. However, the box breakout strategy is very profitable. It is because when the price breaks the box, the trend will go further

This indicator weigth the actual close price with the high and the low of past values then it is computed by a simple 1 lag IIR filter before being processed by a final logarithmic algorithm to order the data.
This Indicator is perfect to find precise reversals.
Rules of Trading : 1) Be sure that the yellow line is in overbought/oversold (above +5 or under -5) The higher/lower, the better. 2) Wait for the gray line to touch the yellow line then separate from it : this is the signal. 3) If t

This indicator Master XR indicator.Indicator displays trend movement. Indicator calculates automatically line. Features
FiltPer - displays indicator period. deviation - displays indicator deviation. deviation2 - displays indicator deviation. How to understand the status: If (Timeframe M1-H1) FiltPer = 100; If ( Timeframe H4-MN) FiltPer = 5-20; ////////////////////////////////////////////////////////////////////////////////////////////////////////////////////////////////////////////////////// /
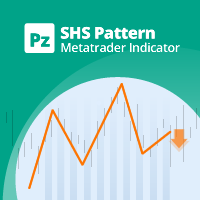
Un patrón de cabeza y hombros es una formación de gráfico que se asemeja a una línea de base con tres picos, los dos exteriores tienen una altura cercana y el medio es el más alto. Predice una inversión de tendencia alcista a bajista y se cree que es uno de los patrones de inversión de tendencia más confiables. Es uno de varios patrones principales que indican, con diversos grados de precisión, que una tendencia está llegando a su fin. [ Guía de instalación | Guía de actualización | Solución de

Description: The indicator shows the TDI indicator in a separate window, and with the RSI component, the indicator finds possible divergences with M or W patterns. KEY LINKS: How to Install - Frequent Questions - All Products Functions: Finds Market Makers patterns. Finds extremes or exhaustion into the market. Looks for a trend continuation. Content: TDI Indicator Divergence and M or W Signals Note 1: This indicator should only be considered as a part of any trading strategy. You shoul
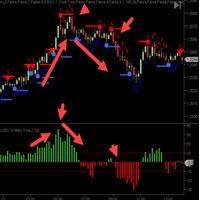
El indicador de valor de fuerza de cierre CycleTraderPro mide la distancia desde el OPEN de una nueva barra hasta el CIERRE de esa barra.
Entrada -
longitud = 10 por defecto
Agregamos estos valores juntos volviendo a la configuración de longitud.
Si la primera barra tenía más 10 tics y luego la siguiente barra era menos 7 tics, entonces esto registraría +3
Hay 2 formas de comerciar con Valor de Fuerza Cerrada:
1. Operar en la dirección de máximos y mínimos más bajos y viceversa
FREE

ZhiBi Fast Scalp es un buen sistema de índice de escalado rápido. La señal se oscila de acuerdo con la tendencia y las señales de Compra y Venta se dan con frecuencia. Apto para todas las variedades de mercado y periodos de tiempo.
La flecha hacia arriba aparece para realizar el pedido Comprar, mientras que la flecha hacia abajo aparece para realizar el pedido Vender;
Descripción del ajuste de parámetros: [Signal_line_period]: el período promedio de la línea de señal de ciclo pequeño. [Trend
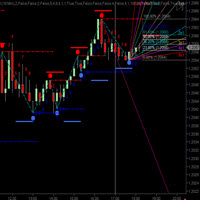
CycleTraderPro El indicador CycleWave tiene 9 indicadores en 1.
Utiliza los indicadores y patrones de CycleTraderPro para identificar ciclos y más en tiempo real.
Las 9 partes de CycleWave:
Traza las Bandas de Ciclo y confirma Ciclo Alto / Bajo en tiempo real después de cada ciclo exitoso alto o bajo.
Traza las ventanas del precio de las olas de ciclo arriba y debajo de cada barra usando un rango de% modificado de la barra anterior.
Traza automáticamente el Retroceso de Fi
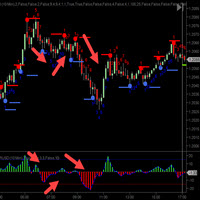
El CycleTraderPro Tick Momentum mide la cantidad de ticks que el mercado mueve en la dirección de cierres consecutivos.
Cuando el mercado cierre por encima de su final, comenzará a contar en la dirección en la que se movieron las marcas.
Si la siguiente barra está en los movimientos y se cierra en la misma dirección, el Tick Momentum continuará contando hasta que el mercado cierre por debajo de su apertura. Entonces comenzará a contar hacia atrás en esa dirección.
Puedes ver estos movim
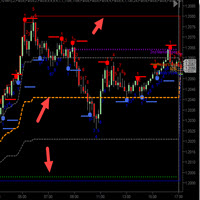
El CycleTraderPro Open / High / Low / Medium OHL toma el mínimo y el máximo del día y representa estos valores:
1. Alto del día (línea roja)
2. Baja del día (línea azul).
3. 25% desde la baja (línea gris)
4. 50% del rango (línea naranja).
5. 75% desde la baja (línea gris)
Buscamos ser largos por encima del rango del 50% y cortos por debajo
Puede ver fácilmente estos niveles a medida que el mercado se mueve. Si el mercado alcanza un nuevo nivel bajo o alto, todos los valores
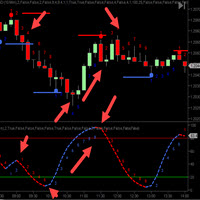
El indicador Power Play (PPI) de CycleTraderPro es uno de nuestros indicadores favoritos. Tomamos todos los indicadores de TC y los combinamos en un solo indicador.
La selección completa de indicadores viene con funciones de encendido / apagado, lo que significa que puede elegir su propia combinación de indicadores y trazar solo esta combinación.
Tomamos un promedio de la mezcla elegida. Al seleccionar 5 indicadores, PPI dividirá los valores de la mezcla por 5.
Luego, trazamos un recuen
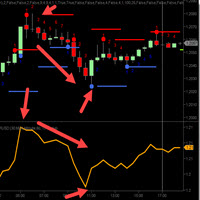
La línea naranja CycleTraderPro - Bressert DDS - DoubleStoch - Mi padre, Walter Bressert hizo a estos DDS famosos por años.
Trabajan con el código del estocástico y luego los suavizan una vez más usando solo 1 línea.
Dependiendo de la longitud de los indicadores, mientras más largo sea para más tendencias y más corto para expandir los mercados, la Línea Naranja tiene una longitud de 100.
Hay 2 formas de intercambiar la Línea Naranja:
1. Operar por encima y por debajo del nivel 50 en
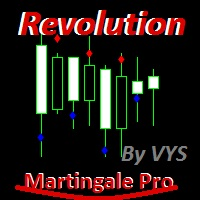
Revolution Martingale Pro
indicator for binary options!
at the time of opening and the appearance of the signal!
Blue diamond is shopping up.
A red diamond is an option down.
The indicator is already set to trade in binary options. ----------- protection is set against hitting on (steps - martingale knees) protection of several minuses under the row. ------------------------------------------- (Redrawing possible)

Tick Sound will play a different sound each time a tick is triggered. When the tick is higher than the previous one, an "UP" sound is triggered When the tick is lower than the previous one, a "DN" sound is triggered The main sound i chose is a Sheppard Tone : it's an audio effect that simulates and endless ramping sound up or down which is perfect for this task. but you can also select 14 different pre-made up/dn sounds or use your own sounds
There are three main parameters for Tick Sound Ask

Alarm arrow indicator of increased sensitivity After closing the candle the arrows do not disappear Allows you to enter the transaction on time at the lowest price movements Can be used on any currency pairs, metals and cryptocurrency Suitable for working with binary options Distinctive features Does not redraw; Determines the price correction; Advanced settings for fine tuning; Works on all timeframes and on all symbols; Suitable for trading currencies, metals, options and cryptocurrency (Bitco

MACD Display is a MACD disaplay and cross monitoring indicator,which can works on 6 timeframe at same time. Indicator advantage: 1. Deviation from the point can be drawn on the main picture and indicator drawing. It is convenient to observe and can be hidden or displayed by parameter setting. 2. Deviation from the entry point is clearly indicated by the arrow in the drawing. 3. Cross-cycle monitoring can simultaneously monitor the MACD deviation and the golden dead fork of the six-cycle framewor
The original multi-indicator suite from JoaquinTrading specifically geared towards binary options, including regulated exchanges such Nadex, Cantor Exchange, and other binary option brokers.
The Probability Tool Suite Classic will provide the given win/loss outcome probabilities of up to 10 strike levels, a specific expiration duration, based on a particular indicator's parameters and derivative behavior (i.e. expiry, touch, touch & retrace). Using this indicator will give users an idea if a

FZR indicator determines fractal zigzag reversal pattern of all the time frames of the chosen symbol and shows the information in the Info label. Indicator draws the detected pattern in the chosen time frame and also you can select in the menu to draw the trend line according to FZR peaks. What it is FZR? See the first picture in the screenshots. As you can see for every peak of FZR the AO indicator must cross zero line. FZR indicator determines the trend direction.
How to use FZR for trading?
FREE

Trend Lines Cross This indicator will alert you on any cross of a Trendline. You can draw up to two trend lines and form a channel, a pennant , a triangle or a simple trend and when the price crosses either trend line the indicator will provide you with alerts that you define plus an up or down arrow when the cross happened. How to: Draw the 1st trendline and name it tl1. Draw the 2nd trendline and name it tl2. Select which type of alerts you would like in the indicator properties and you a
FREE

indicator for binary options! open a deal only for 1 - candle The indicator is already set to trade in binary options. The indicator is ideal for trading on martingale since he very accurately combines what the next candle will be if you are trading in a martingale money management, this is the indicator that you were looking for; it is just created for you and your trading style p.s it is much better than relying on the color of the candle as some not very experienced traders do (therefore, the
Indicator for effective binary options trading.
Complete lack of redrawing The arrow indicates the direction of the next candle and the possible direction.
signal accuracy. Complete lack of redrawing. works great with support and resistance levels
it has an alert, it can be turned on or off in the settings
the accuracy of this tool is perfect
All successful trading.
Also see my other indicators

iVolX indicator horizontal volumes for all time periods
Main settings of the indicator: VolumeSource - select data for volumes (tick or real) PeriodMinutes - selection period for rendering of volumes PeriodsNumber - number of periods to show on the chart StartDate - the start date of the calculations ClusterPoints - cluster width Color - color MaxVolColor - maximum volume color ValueArea - the value of the zone of balance ValueAreaColor - color of the balance zone MaxVolFontSize - fo
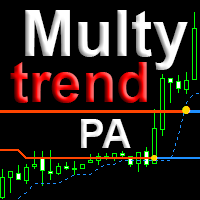
The indicator combines the principles of Price Action and a unique filtering algorithm with feedback for the three movings, this allows you to determine the pivot points and the current trend on any timeframe with a high probability. MultyTrend PA is an evolution of the Trend PA indicator and can be used on the principle of the three Elder screens, with everything you need is displayed on the same graph. Line 1 fast moving, Line 2 main moving, Line 3 - slow moving to determine the direct
This indicator is based on the previous option ( https://www.mql5.com/ru/market/product/37376 ) and includes all completions at the time of creation. Availability of additional data allows to understand more deeply the principle of work as this indicator and original. Points on extrema of bars show history of a portrayal of extrema as before. Levels of a reverse show as far as the price for formation of a new shoulder has to deviate. The Price noise parameter has a special impact (the name "devi

Mr Pip Scalping Indicator
is a momentum indicator that measures the magnitude of recent price changes to evaluate overbought or oversold conditions in the price of a stock or other asset with few major tweaks. This is NOT RSI. Features V2: Added Supply/Demand Filter
You can select which zone to see on the chart ( Important Resistance/Support; Verified Resistance/Support; etc ). You get alerts when prices is entering on a specific supply/demand zone. How to use? When the signal comes, you wi

Nygma Binary Options is a momentum indicator that measures the magnitude of recent price changes to evaluate overbought or oversold conditions in the price of a stock or other asset with few major tweaks. This is NOT RSI.
Features V3: Added Supply/Demand Filter: You must add your own S/R indicator .
You get alerts when prices is entering on a specific supply/demand zone. How to use the S/R Filter? Load the Nygma_Mod.ex4 into the chart, after that load your S/R indicator on the chart. In orde

After the purchase, the current year free indicator, please contact me for your version
As a bonus to the purchase, 3 months access to https://www.mql5.com/en/market/product/78772?source=Unknown%3Ahttps%3A%2F%2Fwww.mql5.com%2Fen%2Fmarket%2Fmy
Fibonacci retracement This indicator is based on use of Fibonacci retracement. I use Fibonacci levels for last year for important levels, where market stops and turns. These levels are important Price Action levels and market respect them. I do not us

Platinum FX индикатор для скальпинга. идеально подходит для торговли бинарными опционами.
работает на всех валютных парах мультитаймфреймовый.
когда появляемся красная стрелка мы покупаем когда появляемся красная мы продаем.
он должен был достичь успеха в трейдинге. Полное отсутствие перерисовки. Точность сигнала. точность данного инструмента можете увидеть в тестере Всем удачных торгов By Lilyyy

TT Arrows is a trend based indicator that very succesfully predicts the start of the new trend. The indicator is working with all trading instruments and in M5, M15, H1 and H4 timeframes. Up arrow signals a good time to enter a bullish trade while down arrow signals a good time to enter a bearish trade. The trade should be taken when the candle that has the arrow is closed. Following this strategy you will have have a high percentage of winning trades. Enjoy!

The Legendary Donchian Channel Indicator. This is the indicator that Richard Dennis used in the famous turtle experiment where he showed that anybody can become a successful trader by practice. Some techniques are older then MetaTrader itself. In fact we were unable to find a color picture of Mr. Donchian himself, for use as the product icon for this indicator. We had to artificially colorize an old black and white picture of the genius. But it is okay because he is smiling at us and now you ar
***Specialized for scalping trading on any timeframe***
Scalping Train use smart algorithm detects the price circles with time . give strong signals at the right time as result of combine the price and time.
our team spent months to develop this indicator specially for Scalping..with high success rates about 89% win trades .
Advantages Easy, visual and effective Signals. Gives you the ability to filter and further improve your trading strategies. Never repaints, never backpaints, never rec
Индикатор работает по двум направлениям: прибыли и просадки , а также в двух измерениях: % и $ . Если выставляется значение $ , то % автоматически подгоняется под $ . При изменении депозита индикатор сам уровни корректирует по отношению того, на что был настроен, а другой параметр корректируется к первому. Корректировка появляется при изменении депозита. Округление числа с плавающей точкой у линий (для красивой читаемости) в значении доллара - 2, в проценте - 1. Уровни автоматически выставля

Over 100,000 users on MT4 and MT5 Blahtech Candle Timer displays the remaining time before the current bar closes and a new bar forms. It can be used for time management Links [ Install | Update | Training ] Feature Highlights
The only candle timer on MT4 with no stutter and no lag S electable Location Tracks server time not local time Multiple colour Schemes Configurable Text Customisable alerts and messages Optimised to reduce CPU usage Input Parameters Text Location - Beside / Upper
FREE
This is the author's product of the trading-investment company Algorithmic Capital, which specializes in professional investor capital management and the creation of trading and analytical software. The Channel Enslaver indicator is created on an “all inclusive” basis. Its program code includes several important blocks at once: • A set of professional technical indicators that independently analyze quotes and generate trading signals. • An alert system that gives special signals (including Email

ZhiBiSmart es adecuado para todos los ciclos de gráficos de todas las variedades del mercado. Utiliza la llamada de tendencia para hacer la banda de rebote, que predecirá mejor la banda y la tendencia. Compra el pedido: una marca con una flecha verde hacia arriba; Compre el cierre: aparece la marca de la cruz verde; Vender el pedido: una marca con una flecha amarilla hacia abajo; Vender el cierre: una cruz amarilla; Ajustes de parámetros: [TrendPeriod]: el período de la línea de tendencia; [Sign

Quantum Swing 1. What is Quantum Swing The indicator calculates and displays future price levels based on quantum mathematics with high accuracy of probability and direction. Levels are displayed in the form of zones for making trading decisions; they clearly define a narrow price range for placing orders with a minimum stop-loss and maximum take-profit. The indicator displays future trading zones on different timeframes H1, H4, D, W. Quantum oscillations are also displayed without reference to
FREE

All those involved in trading do certainly know that Moving Average Crossovers for being tradable should be reliable and also they need to have minimal lag.
BeST_Vervoort Zero Lagging MAs Strategy is a Metatrader Indicator that can help you to achieve it and is based on S.Vervoort's work about Reliable and of Zero Lag MAs Crossovers as described in his TASC_05/2008 article " The Quest For Reliable Crossovers ". It's a Multipotentiality Indicator as it can display of either simply the Zero Laggi
Данный индикатор Форекс построен на теории оценки силы тренда и расчёта, когда нужно входить в рынок. Как только появляется сигнал захода в рынок над свечёй вырисовуется стрелка которая и показывает дальнейшее направление цены. . Это полноценный индикатор который поможет вам принимать решение о входе в рынок и о позиции которую необходимо занять при открытии ордера.

Mars 1 is a Box Break is a powerful indicator of Break Zone for any par and any timeframe. It doesn't requires any additional indicators for the trading setup.The indicator gives clear signals about opening and closing trades.This Indicator is a unique, high quality and affordable trading tool.
Perfect For New Traders And Expert Traders Low risk entries. Never repaints signal. Never backpaints signal. Never recalculates signal. For MT4 Only Great For Scalping Great For Swing Trading Arrow Ent

Pivot levels is indicator showing 7 pivot levels. It is adjusted for major use, including: all standard time frames
choice of periods to show three popular calculation formulas (typical, median, weighted) 9 level Camarilla pivot
pivot day shift choice of properties for lines and labels choice of showing alerts when crossing pivot lines Parameters: ----------Main parameters----------- Timeframe - time frame for pivot levels
Number of periods to show - displays pivot levels for number of period
FREE

This indicator guides you like a hunter. Tacheprofit and StopLoss levels. See the difference in the experiment. Works in all periods. Works at all rates. You can win with this system. The crossing of the mean and the re-test were done according to the rule. You can see the transactions by moving backwards on the strategy test screen. The whole system is automatically calculated.
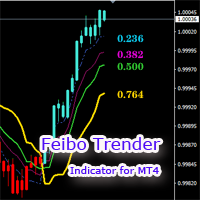
The Feibo Trender is a trend tracking indicator based on the Feibo section calculation. 1.The price is in an upward trend and candles turn blue .The price is in a downward trend and candles turn red . 2.The segmented areas of the channel are identified by lines of different colors that can as support or pressure reference locations . 3.The price broke through the yellow line, which marked the trend reversal. The indicator parameters can be customized and the settings are simple. If you have any

The indicator simplifies the decision-making process by recognizing the reversals using the built-in algorithm, and then confirms the signals at the support / resistance levels. In this way, the indicator tracks the market trend with unsurpassed reliability, ignoring the sharp fluctuations in the market and the noise around the average price. The indicator can be used for both small periods and long-term trading. The indicator is not redrawn and not late. 94% of deals are profitable. Take profit

Multi-timeframe indicator perfectly determines when there will be a rollback from the level ideal for binary options. of correct true signals Forex Stop Loss trading can be dragged behind the line thereby moving the deal to breakeven there is a signal in the indicator. The indicator showed excellent results during testing. Test in the test and make sure it is accurate. For any questions, suggestions, please always communicate with you.
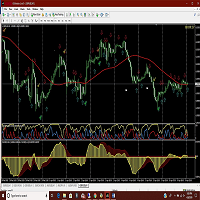
Amac indicator will give you alerts when the ADX crosses and also when the two MACD indicators cross. Helps in determining the trend direction, good for scalping against the main trend as well. Get mobile alerts and email in addition to the platform alerts. Arrows indicate MACD direction and Check marks show ADX turns. Works on all time frames but you can get more pips by using the 30 min and above. Be sure to view the photos!
¿Sabe usted por qué MetaTrader Market es el mejor lugar para vender estrategias comerciales e indicadores técnicos? Con nosotros, el desarrollador no tiene que perder tiempo y fuerzas en publicidad, protección del programa y ajustes de cuentas con los compradores. Todo eso ya está hecho.
Está perdiendo oportunidades comerciales:
- Aplicaciones de trading gratuitas
- 8 000+ señales para copiar
- Noticias económicas para analizar los mercados financieros
Registro
Entrada
Si no tiene cuenta de usuario, regístrese
Para iniciar sesión y usar el sitio web MQL5.com es necesario permitir el uso de Сookies.
Por favor, active este ajuste en su navegador, de lo contrario, no podrá iniciar sesión.