Nuevos indicadores técnicos para MetaTrader 4 - 19

The Scaled Awesome Oscillator (SAO) represents a refined adaptation of the Awesome Oscillator, aimed at establishing consistent benchmarks for identifying market edges. Unlike the standard Awesome Oscillator, which records the variation in pips across different commodities, the only unchanging reference point is the zero line. This limitation hampers investors and traders from pinpointing specific levels for trend reversals or continuations using the traditional Awesome Indicator, a creation of
FREE
The presented indicator marks signals on the price chart with arrows in accordance with the data of the FATL Momentum AM indicator. The indicator gives a signal and sends a notification to the mobile terminal and email. The FATL Momentum AM indicator is the difference between the current price and the price some number of periods ago. The difference from the classic indicator Momentum is the preliminary smoothing of prices by an adaptive digital filter - FATL. Confirmation of the indicator signa
FREE
This indicator displays candle prices on the chart based on moving average data. That is, the opening price is the opening price of the moving average, the closing price is the closing price of the moving average, and so on. This approach allows you to visualize the average price changes, eliminate the "noise" and get a picture more suitable for evaluation and decision making. The indicator does not redraw on fully formed bars. At the same time, the indicator can change its data on the zero bar
FREE

This indicator is a combination of classic trend indicator and signals of the fast digital filter. The indicator has no configurable parameters. The signals are displayed on completed bars and are not redrawn. It shows high efficiency on periods greater than 1 hour. The usage principle is intuitive - trade in the direction shown by the fan of moving averages. Enter once the price exceeds the High/Low of the bar where the signal was formed. Exit on the opposite conditions.
FREE
This indicator is a moving average built using the triple exponential smoothing method (T3). The indicator is part of a series of indicators - T3 Line AM, T3 Momentum AM, T3 Candles AM, T3 Signal AM .
The indicator has minimal lag and allows you to effectively follow the trend direction. The indicator is not redrawn on fully formed bars. The indicator is supplemented with signals and notifications to the terminal and e-mail.
The application of the indicator is identical to the application o
FREE
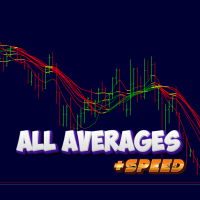
Perhaps you have previously read in technical analysis books about such a concept as "market slope", or "trend slope". Metatrader has such a tool as "trend line by angle". But when working on auto-scaled charts, this tool becomes completely abstract, and as a consequence, useless. The idea of this new parameter, included in the AllAverages_Speed indicator, is to give such a concept as "trend slope" specific numerical values, as well as the further use of the new parameter in work.
Modific

The Wamek Support and Resistant (WSR) Indicator is a remarkable tool that stands out in the world of technical analysis. It sets itself apart by cleverly combining price action and leading indicators to delineate support and resistance levels with a high degree of accuracy. Its unique feature is its adaptability; users can fine-tune the indicator by adjusting input parameters, enabling them to create customized support and resistance levels that suit their trading strategies. Notably, one of WSR

If you are a Price Action Trader this indicator will help you so much Every trader must have it ! I'm a trader so i know what you need ! Message me if you wanna see the video you should send me message
don't worry i will help you to learn how to use my indicators
i also have other indicators, please watch them stay tuned i also have other useful indicators and Experts Telegram ID: @forex_ex4
#forex #priceaction #indicator #mt4 #mt5 #trade #trader
Please feel free to contact me if you need any further information.
Please let me know if you have any questions.
I hope the above is useful to you. MT Sideway Filter : It is an indicator that is built to find many sideways, when a sideway is formed, the graph will jump out into a trend. After that, you can continue to strategy your trading. It's an opportunity to make good profits. indicator for trade by yourself
TRADE: Forex TIME FRAME: All Time Frame SYMBOL PAIR: All Symbol
SETTINGS
The indicator shows the current timeframe and symbol name. It is also possible to turn on the indication of time until the end of the current bar. In the settings, you can specify: - the location of the indicator in relation to the terminal window, top left, top right, bottom left and bottom right - a row of text display arrangements so that the inscriptions do not overlap each other - color - font - font size.
FREE
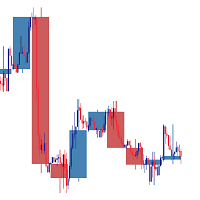
This is a Free Trial work on EURUSD. Discover the incredible potential of "Higher Timeframe Bars," your go-to MetaTrader 4 indicator for enriched trading insights. Revolutionize your trading strategy with a deeper understanding of the markets, all while staying on your current chart.
Key Features: - Seamlessly compatible with MetaTrader 4. - Choose from an array of higher timeframes, including M3, M5, M10, H1, H4, D1, and more. - Customize bar colors and enable optional borders for enhanced v
FREE

Introducing the "Magic Trades" for MetaTrader 4 – your ultimate tool for precision trading in dynamic markets. This innovative indicator revolutionizes the way you perceive market trends by harnessing the power of advanced analysis to detect subtle changes in character, paving the way for optimal trading opportunities.
The Magic Trades Indicator is designed to empower traders with insightful entry points and well-defined risk management levels. Through its sophisticated algorithm, this indica

I was looking for a lean symbol changer. I could not find any. Normally other products hide lot's of screen space. So I developed a very lean symbol changer Just click on the 2 currencies you want to combine. The order does not matter. If you miss some pairs, you can add up to 5 custom symbols. Please make sure, your broker support your custom symbols. Drag an drop the panel with the green button.
In future I plan to include suffix and prefix als well.
FREE

The three white soldiers and the three black crows candlestick patterns are reversal patterns that predict a change in the direction of a trend. The pattern consists of three consecutive long-bodied candlesticks that open within the previous candle's real body and a close that exceeds the previous candle's. It's important to note that both formations are only valid when they appear after a strong uptrend or a downtrend, while their efficiency decreases in choppy markets.
Inputs AlertOn - e
FREE

Market Profile Heat indicator — is a classic Market Profile implementation that can show the price density over time, outlining the most important price levels, value area, and control value of a given trading session.
This indicator can be attached to timeframes between M1 and D1 and will show the Market Profile for daily, weekly, monthly, or even intraday sessions. Lower timeframes offer higher precision. Higher timeframes are recommended for better visibility. It is also possible to use a f
Introducing the "Zone of Supply and Demand Pro" Indicator - Redefining Precision with Multi-Time Frame (MTF) Technology and Non-Repaint Capability
In the intricate world of financial markets, understanding supply and demand can be the key to success. We are excited to present the "Zone of Supply and Demand Pro" - a powerful analytical tool designed not only to help you seize trading opportunities but also to ensure unparalleled accuracy through groundbreaking technology.
**The Significance

The liquidity swings indicator highlights swing areas with existent trading activity. The number of times price revisited a swing area is highlighted by a zone delimiting the swing areas. Additionally, the accumulated volume within swing areas is highlighted by labels on the chart. An option to filter out swing areas with volume/counts not reaching a user-set threshold is also included.
This indicator by its very nature is not real-time and is meant for descriptive analysis alongside other c

This indicator is based on the classical indicator Stochastic and will be helpful for those who love and know how to use not a visual but digital representation of the indicator. All TimeFrames RSI MT4 indicator shows values from each timeframe. You will be able to change the main input parameters for each RSI for every TF. Example for M1: sTF1_____ = "M1"; kPeriod1 = 5; dPeriod1 = 3; Slowing1 = 3; stMethod1 = MODE_SMA; Price_Field1 = MODE_MAIN; stMode1 = 0;
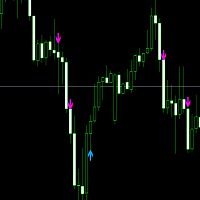
This offer is limited to a temporary period. Entry signal :follow the blue arrow for a buy trade and the Pink for a sell. Buy Trade: When the blue arrow appears, you wait until the candle completely finishes. Then you enter into a Buy Trade as soon as the next candle appears. Now wait until you hit TP1 from the Buy Goals box, then close the trade with a profit. Sell Trade: When the Pink arrow appears, you wait until the candle completely finishes Then you enter into a Buy Trade as soon as the
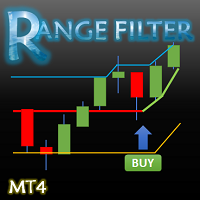
This indicator converted from 5 min Buy and Sell Range Filter - guikroth version on TradingView Popularity of the Range Filter
The Range Filter is a very popular and effective indicator in its own right, with adjustments to the few simple settings it is possible to use the Range Filter for helping filter price movement, whether helping to determine trend direction or ranges, to timing breakout or even reversal entries. Its practical versatility makes it ideal for integrating it's signals into

Alright. This indicator works on MT4 and is very easy to use. When you receive a signal from it, you wait for that candle with the signal to close and you enter your trade at the beginning of the next new candle. A red arrow means sell and a green arrow means buy. All arrows comes with Popup Alert like for easy identification of trade signal. Are you okay with that?
100% non repaint
Work All Major currency Pair,
1 minute time frame 1 minute expire

The " Global Trend Pro Lines " indicator is one of the most important indicators designed to display trading volumes based on the sniper strategy. This indicator provides convenience for daily, medium-term, and long-term traders. The main advantages of the indicator are as follows: Suitable for the sniper strategy: The "Global Trend Pro Lines" indicator is suitable for the sniper strategy and allows traders to identify the best entry and exit points for trading. Displays volumes: The indicator

The Price Volume Trend Oscillator (PVTO) is a powerful technical analysis tool designed to provide insights into the relationship between price movements and trading volumes. This indicator offers a unique perspective on market trends, helping traders identify potential buying and selling opportunities. Parameters: EMA Short Period: Defines the short EMA period for calculating the PVTO. Default 3 EMA Long Period: Specifies the long EMA period for PVTO calculation. Default 10 EMA Signal Period: S
FREE

This indicator is a technical analysis tool designed to assist traders in identifying potential support and resistance levels in price charts. It is based on the concept of Murrey Math Lines (MML), which attempts to depict significant levels in price movements. Often regarded as one of the most powerful Pivot indicators globally, it has gained recognition for its effectiveness in analyzing price action. This indicator has several interesting features : Displays 13 different Murrey Math Lines lev

Sacrament mt4- This is an indicator that includes the best basic forex indicators, without redrawing. Based on this data, a signal for sale or purchase is formed. It does not disappear anywhere after the signal, which gives us the opportunity to see the results on the history.
It can be used on any currency pair, crypto metals, stocks
It is best used on an hourly chart, but other periods are also acceptable.
The best results for the period H1,H4,daily
If customers have any questions, I w

**Indicador Breakout Box para MT4 - Descubriendo Oportunidades de Trading Eficientes**
Saludos, estimados Traders,
Nos complace presentarles el Indicador Breakout Box versión 2.0, una herramienta de trading poderosa y precisa creada por KPRO. Este es un activo valioso que le ayuda a capturar oportunidades de trading en el mercado Forex, optimizando sus ganancias mientras minimiza los riesgos.
**Características Clave:**
1. **Trading de Breakouts Eficiente:** El Indicador Breakout Box est

Presentamos el Indicador Advanced SR. Un indicador diseñado para ayudarte a identificar los niveles clave más importantes en tu gráfico.
Tus Desafíos: No estás seguro de cómo señalar áreas significativas de precio. Estás dibujando zonas de oferta y demanda o niveles de soporte y resistencia como el 99% de otros traders. Encuentras que las zonas SD y SR que dibujas no son efectivas. No estás seguro de la seguridad de tus puntos de entrada y salida. Advanced SR aborda todos estos problemas. Con

Bienvenido al mundo del comercio avanzado con el Super Indicador Comercial FxBears. Diseñada exclusivamente para la plataforma MT4, esta innovadora herramienta combina el poder de Elliott Waves, zonas de oferta y demanda e indicadores internos para proporcionar a los operadores señales de alta calidad para tomar decisiones comerciales informadas. Con un historial de tasa de éxito de más del 90%, FxBears Super aporta un nuevo nivel de precisión y rentabilidad a su estrategia comercial. De Corse

El Indicador de Divergencia RSI es una herramienta poderosa diseñada para identificar posibles inversiones en el mercado al detectar discrepancias entre el Índice de Fuerza Relativa (RSI) y el movimiento de los precios. Las divergencias pueden ser una indicación significativa de un cambio de tendencia inminente, ya sea de alcista a bajista o viceversa. Este indicador está construido para facilitar y hacer más eficiente la tarea de identificar posibles oportunidades de operación. Características

Indicator for monitoring account drawdown and automatic time frame control.
Many robots are profitable in smaller time frames for a period of time, but at some point they break down because they catch a strong trend, but if you switch to a larger time frame in time it often saves itself and returns to profit again.
The big problem is watching the progress of the account's decline, because no matter how closely you watch your account, the biggest movement comes when you least expect it.
Wh

El indicador "No repintado" está diseñado para analizar la dinámica del mercado y determinar momentos potenciales de señales de trading. La característica principal de este indicador es la ausencia de repintado de las señales, lo que contribuye a una predicción más precisa y confiable de los movimientos de precios en el mercado.
Mecanismo de Operación: El indicador "No repintado" utiliza varios tipos de elementos gráficos para indicar señales de trading: Flechas hacia arriba y hacia abajo: El
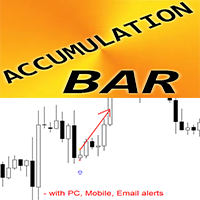
Patrón de barra de acumulación del indicador Forex para MT4
El indicador "Barra de acumulación" es un indicador muy potente centrado en la ruptura para el comercio de acción del precio. El indicador detecta la acumulación de precios en un área estrecha durante 1 barra y muestra: dirección de ruptura, orden pendiente y ubicaciones de SL Barra de acumulación alcista: señal de flecha azul en el gráfico (ver imágenes) Barra de acumulación bajista: señal de flecha roja en el gráfico (ver imágenes)
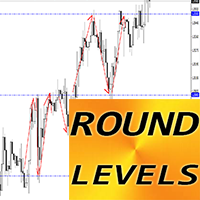
Indicador Forex "Niveles redondos" para MT4
El indicador "Niveles redondos" es un indicador auxiliar imprescindible para los operadores que toman en consideración el soporte/resistencia. Los niveles redondos son muy respetados por el precio: el precio rebota muy a menudo desde los niveles redondos. Utilice el paso de 1000 puntos para los períodos de tiempo H4, D1 Utilice el paso de 500 puntos para el primer semestre y períodos de tiempo inferiores (para operaciones intradiarias) Además, los n

Stochastic Scanner is a multi symbol multi timeframe Stochastic dashboard that monitors the indicator for price entering and exiting overbought and oversold in up to 28 symbols and 9 timeframes.
Download Demo here (Scans only M1 and M5) Settings description here MT5 version here
Stochastic Scanner features: Signals price entering and exiting the overbought and oversold zones. Monitors up to 28 customizable instruments and 9 timeframes at the same time. You can choose between 3 alert mo
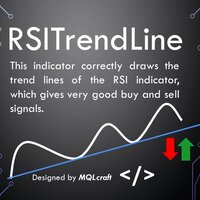
RSI Trend Lines Indicator - Identify Optimal Buying and Selling Opportunities Introduction :
The RSI Trend Lines Indicator is a powerful tool designed to assist traders in identifying optimal buying and selling opportunities based on the Relative Strength Index (RSI) oscillator. This advanced indicator draws trend lines on the RSI chart using multiple points, providing valuable insights into potential market trends and reversals. By leveraging the RSI Trend Lines Indicator, traders can enhance
The product combines the best features of the standard ADX oscillator with the adaptive digital filter. The indicator allows entering and exiting the market at the very beginning and end of a trend. The indicator generates high-probability signals while retaining high sensitivity. The indicator does not repaint on fully formed bars. Options: Ind_Price - price used for the indicator calculation; Ind_Period - indicator period. Application rules: A big red dot - a strong bearish trend, if the price
FREE
This indicator is an oscillator built on the principle of the classic Momentum. The indicator is part of a series of indicators - Hull Line AM, Hull Momentum AM, Hull Candles AM, Hull Signal AM . The indicator represents the difference between the current price and the price some number of periods ago. The difference from the classic indicator Momentum is the preliminary smoothing of prices according to the method proposed by Alan Hull.
Using the indicator: It should be taken into account tha
FREE

The presented indicator marks signals on the price chart with arrows in accordance with the data of the Hull Momentum AM indicator. The indicator gives a signal and sends a notification to the mobile terminal and email. The indicator is part of a series of indicators - Hull Line AM, Hull Momentum AM, Hull Candles AM, Hull Signal AM . For a better understanding of the operation of each of the indicators, it is recommended to start working with them by using them together on one chart. The Hull M
FREE
This indicator is a moving average built according to the method proposed by Alan Hull. The indicator is part of a series of indicators - Hull Line AM, Hull Momentum AM, Hull Candles AM, Hull Signal AM . The indicator has minimal lag and allows you to effectively follow the trend direction. The indicator is not redrawn on fully formed bars. The indicator is supplemented with signals and notifications to the terminal and e-mail.
The application of the indicator is identical to the application
FREE
This indicator is a moving average built using the classic Stochastic oscillator and ATR. The change in the direction of the moving average depends on the Stochastic oscillator overcoming its average value and leaving the price beyond the range determined using the ATR. The indicator is not redrawn on fully formed bars. The indicator values on a bar that has not completed its formation may change.
The application of the indicator is identical to the application of the standard moving average
FREE
This indicator displays RVI indicator signals. The main point of Relative Vigor Index Technical Indicator (RVI) is that on the bull market the closing price is, as a rule, higher, than the opening price. It is the other way round on the bear market. So the idea behind Relative Vigor Index is that the vigor, or energy, of the move is thus established by where the prices end up at the close. To normalize the index to the daily trading range, divide the change of price by the maximum range of price
FREE
The presented indicator colors the chart candles in accordance with the data of the Hull Momentum AM indicator. Coloring of candlesticks depends not only on the location of the oscillator histogram above or below zero. The location of the histogram relative to the signal line is also important. The indicator is part of a series of indicators - Hull Line AM, Hull Momentum AM, Hull Candles AM, Hull Signal AM . For a better understanding of the operation of each of the indicators, it is recommended
FREE
The product combines the best features of the standard WPR oscillator with the adaptive digital filter. The indicator allows entering and exiting the market at the very beginning and end of a trend. The indicator generates high-probability signals while retaining high sensitivity. The indicator does not repaint on fully formed bars. Options: Ind_Price - price used for the indicator calculation; Ind_Period - indicator period. Application rules: A big red dot - a strong bearish trend, if the price
FREE

ZigZag Fibo Retracement Indicator Optimize Your Trading Strategy! Are you seeking to optimize your trading strategy in the financial markets? Explore the unique features of the ZigZag Fibo Retracement Indicator, a powerful tool designed to help you identify potential support and resistance levels based on the combination of ZigZag patterns and Fibonacci ratios. Integration of ZigZag Patterns and Fibonacci: The ZigZag Fibo Retracement Indicator combines the effectiveness of ZigZag patterns, helpi
FREE

Perfect for one minutes high trading and scalping. This indicator is very effective for trading on one minutes, in the hour. A combination of moving averages and STOCHASTICS calculation to produce a very convincing signal every hour. Blue colour signals a buy opportunity. Follow the X signs for possible buy points. The Blue average line serves as possible trend direction and support. Red colour signals a sell opportunity. Follow the X signs for possible sell points. The Red average line serves a

This is a dashboard indicator that displays the Average Level of each selected currency pairs that filters and gives us a signal for overbought (>=90%) or if price at extreme peak above 90, and/or oversold (<=10%) or if price at extreme peak below 10.
The calculation is using Relative Strength Index default periods (2 & 9) applied to three different higher time frames H4,D1,&W1.
This won't change or altered even if you change symbol or switch to lower time frames or even in monthly and y

Bollinger Bands Stops Indicator for MT4 The Bollinger Bands Stops Indicator is a versatile tool designed to help traders make informed decisions in the financial markets. Developed for the MetaTrader 4 (MT4) platform, this indicator provides valuable insights by visually representing the Bollinger Bands along with stops and signals. Key Features: Bollinger Bands Analysis: The indicator incorporates Bollinger Bands, a widely used technical analysis tool. These bands help traders identify potentia
FREE

Sure, here's the introduction for the "Enhanced Volume" indicator designed for MetaTrader 4 (MT4):
--- ## "Enhanced Volume" Indicator for MetaTrader 4 (MT4)
Greetings MT4 Traders!
The "Enhanced Volume" indicator is a powerful tool designed to help you track and analyze trading volume alongside signals of changing market trends.
### Key Features:
1. **Separate Window Display:** The "Enhanced Volume" indicator can be displayed on a separate window, making it easy to observe and analyze
FREE

The Donchian Scanner Signals Indicator with is a powerful tool designed for traders operating in the financial market using the Metatrader 4 platform. This indicator combines the popular Donchian Channels strategy with advanced signalization and real-time alert features, providing a clear view of potential entry and exit points in a financial asset. Key Features: Donchian Channels Visualization: The indicator graphically displays Donchian Channels on the price chart. These channels are formed us
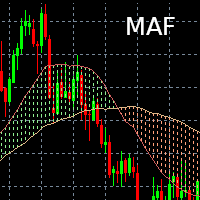
Indicateur Moving Average Filling Affiche deux moyennes mobiles (une courte et une longue) dont la durée et le type (Simple, exponentielle) est paramétrable. L'espace entre les deux moyennes mobiles est alors colorié (rempli) :
- Vert si courte > longue
- Rouge si courte < longue Il est possible de changer les couleurs selon les préférences de chacun / chacune.
Please feel free to contact me if you need any further information.
Please let me know if you have any questions.
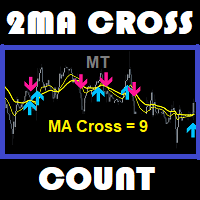
I hope the above is useful to you. MT 2ma Cross Count : is a moving average with 2 lines crossing but the strategy is to focus on the desired number of history bars and count signals that occur. Suitable for traders specialize in martingale strategy or traders specialize in technical ... etc. Traders with the ability to do fundamental analysis have an advantage. Because it will ma

Revela Ideas de Trading con Auto Anchored VWAPs: Auto Anchored VWAPs actúan como tu compañero guía en el mundo del trading. Estos indicadores señalan puntos de giro cruciales del mercado y los representan en tu gráfico utilizando líneas VWAP. Esto marca un cambio significativo para los traders que emplean estrategias basadas en VWAP anclados. ¿Cómo Funciona? Identificando Puntos Altos: Si el precio más alto de la vela actual es menor que el precio más alto de la vela anterior, Y el alto anterior
FREE

Cierre del Día Anterior y Desplazamiento de Barras para MetaTrader El Indicador de Cierre del Día Anterior y Desplazamiento de Barras es una herramienta diseñada para mejorar el análisis técnico y la toma de decisiones en el trading. Con este indicador, tendrás acceso a información detallada sobre los niveles de apertura, máximo, mínimo y cierre de cualquier barra, lo que te permitirá realizar un análisis preciso y completo de los movimientos del mercado. Imagina tener la capacidad de colocar un
FREE

Presentamos PivotXpert , un indicador multigráfico avanzado diseñado para mejorar su estrategia de punto de pivote. Desbloquee su potencial sin esfuerzo, con una interfaz intuitiva que hace que el intercambio dinámico sea muy sencillo.
El modo Multichart de PivotXpert simplifica su negociación al dibujar líneas de pivote en todos los gráficos abiertos. Calcule los pips restantes para cada nivel sin esfuerzo usando la función CalculatePips, afinando su estrategia con facilidad.
Perso
Introducción: La "Zona de giro" es un indicador MT4 sofisticado e innovador diseñado para proporcionar a los operadores una poderosa herramienta para detectar posibles cambios de tendencia dentro de los mercados financieros. Al utilizar el concepto atemporal del análisis de horquilla, el indicador Turning Zone identifica las zonas clave de reversión donde es probable que cambie el sentimiento del mercado, ofreciendo a los operadores información valiosa para tomar decisiones informadas. Versión

Hola,
¿Estás buscando una solución óptima para generar beneficios en el mercado financiero en la plataforma MetaTrader 4 (MT4)? Te presentamos "Sonic R Non Repaint Smart": un sistema de trading inteligente que aporta precisión y eficiencia a los traders.
Introducción a "Sonic R Non Repaint Smart":
"Sonic R Non Repaint Smart" es un sólido indicador de trading basado en la estrategia de trading altamente valorada Sonic R. Ofrecemos con orgullo una solución que no solo te ayuda a identificar

El indicador MOST es un indicador muy popular que se utiliza en otras plataformas, especialmente para acciones e índices. La base son las medias móviles y los niveles alto-bajo. Puede ser apropiado utilizar el porcentaje de entrada como 2 para acciones e índices, y 1 - 1,5 para instrumentos forex. Puedes hacer tu propio ajuste para cada instrumento. Es un indicador fácil de usar, simple y sencillo. Es más común en gráficos de 1 hora y diarios. Por ahora solo he editado para la plataforma MT4, si
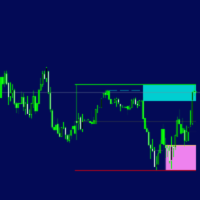
1. Updated usage instructions in blog below: Smart Market Structure Trading System and Automatic Scanner - Trading Systems - 13 October 2023 - Traders' Blogs (mql5.com) https://www.mql5.com/en/blogs/post/754495 2.1 YouTube video link for introduction: https://youtu.be/tMU04wo0bc8 2.2 YouTube video link for "Added buttons": https://youtu.be/hKaijMARwWk  3. Smart Money Concepts, Support and Resistance, Buy Side Liquidity, Sell Side Liquidity, Monthly Highs/Lows, Weekly High/Lows, Previou
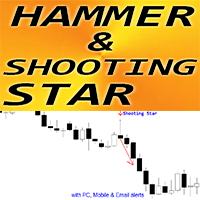
Indicador Forex "Patrón de martillo y estrella fugaz" para MT4
El indicador "Patrón de martillo y estrella fugaz" es un indicador muy poderoso para el comercio de acción del precio: sin repintado, sin demoras; El indicador detecta patrones de martillo alcista y estrella fugaz bajista en el gráfico: Martillo alcista: señal de flecha azul en el gráfico (ver imágenes) Estrella fugaz bajista: señal de flecha roja en el gráfico (ver imágenes) Se incluyen alertas para PC, dispositivos móviles y cor
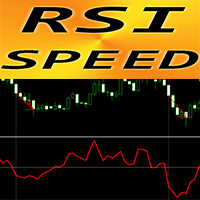
Indicador Forex "RSI SPEED" para MT4: ¡excelente herramienta predictiva!
El cálculo de este indicador se basa en ecuaciones de la física. RSI SPEED es la primera derivada del propio RSI RSI SPEED es bueno para arrancar entradas en la dirección de la tendencia principal Úselo en combinación con un indicador de tendencia adecuado, por ejemplo HTF MA (como en las imágenes) El indicador RSI SPEED muestra qué tan rápido el RSI cambia su dirección: es muy sensible Se recomienda utilizar el indicado

Welcome to Propsense, the best solution for new and veteran traders with a simple FREE strategy! This indicator is a unique and affordable trading tool built on the teachings of a former bank trader. With this tool, you will be able to see inefficient points with ease. As well as this, traders will have an interactive display panel which will show your running and closed P/L in pips AND currency units. It also allows you to set your desired daily target/loss limit! IMPORTANT INFORMATION
Maxim

This is a combination of multiple oscillators into a single divergence system that creates the impression of a more reliable divergence indicator. It is multi-currency based and works best on 15 minutes timeframe and above. Every time a signal is generated, it shows an alert to the user. It is more ideal if combined with other price action indicators or trading systems.

Global Trend Lines
The Buy/Sell Zone Indicator possesses several features that can be used to improve your trading strategy. This indicator helps you identify buy zones and sell zones on the chart. The main features of this indicator are as follows: Identifying Trend Levels: The indicator has algorithms used to identify trend levels. This helps you determine the direction and strength of the trend. Marking Buy and Sell Zones: The indicator marks buy zones and sell zones on the chart. This ass
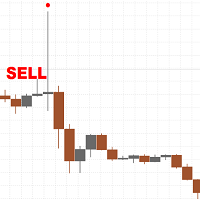
There are only a limited number of copies left, priced at 390 USD . After that, the price will be raised to 450 USD. I develop honest Indicators and know what can work in the market in the long term and what cannot. The classic and most powerful price action pattern is called the pin bar. This pattern works well after the release of fundamental news on M15, M30 and H1 timeframes, but can also be used on other timeframes such as M5 or D1. By default, the settings are set for the H1 timeframe,

**Introducing Supply Demand Zones Indicator for MT4**
Hello, esteemed traders in the financial markets! Today, we are pleased to introduce to you a powerful tool called the "Supply Demand Zones Indicator" - a valuable utility designed for the MetaTrader 4 (MT4) platform, aimed at helping you identify key supply and demand areas on your trading charts.
**Brief Introduction:** The Supply Demand Zones Indicator is a unique technical analysis tool that assists in pinpointing significant price l
FREE

This indicator displays the signals of a highly effective oscillator - Laguerre Osc 2 AM - on the price chart. The presented indicator uses the Laguerre filter to build an oscillator. The indicator has the possibility of double additional smoothing, which can be useful for small values of the Gamma parameter. The indicator gives three types of signals: Exit of the oscillator from the overbought / oversold zone; The oscillator crossing the middle of the value between the overbought/oversold
FREE
This indicator displays the Laguerre Osc AM indicator signals on the price chart. The presented indicator uses the Laguerre filter to build a classical type oscillator, similar in its appearance and method of application to the regular MACD. At the same time, this tool is much more flexible in settings compared to the usual MACD and, thanks to the Laguerre filter, is more sensitive to price movements. Laguerre Osc allows you to choose the parameters in such a way as to be effective for almost an
FREE
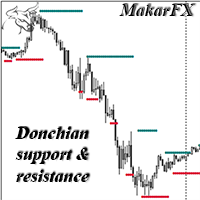
Support and resistance level indicator based on the Donchian channel. The most famous example of trading through the Donchian channel is an experiment with a group of turtles, who earned one hundred and twenty-five million dollars in five years. This indicator can be used as a standalone tool, as well as an additional confirmation. There is MTF, NRP. There are color and thickness settings.

Dear everyone, Today, I would like to introduce you to an amazing tool on the MetaTrader 4 platform - "Pivotal Moments." This indicator will be a reliable companion on your trading journey in the financial market. "Pivotal Moments" is not just an ordinary indicator, but an intelligent tool that helps you better understand significant fluctuations on the chart. With a variety of customization options, it provides valuable information and deep insights into the market. The key features of "Pivotal
FREE

TrendFinder VolumeI are Colored candlesticks showing the trend based on Volume and Slope of Trend
This indicator will give you the color change on the next bar on the confirmation candle and will never repaint Lime Green = Possible Buy (Volume up), Teal Green = Bullish Weak (Volume Decreasing), Red = Possible Sell (Volume up) , Orange = Bearish Weak (Volume Decreasing)
TrendFinder Volume is optimize to trade on any market and to be used trending and None trending markets. For best results us
FREE
MetaTrader Market es el mejor lugar para vender los robots comerciales e indicadores técnicos.
Sólo necesita escribir un programa demandado para la plataforma MetaTrader, presentarlo de forma bonita y poner una buena descripción. Le ayudaremos publicar su producto en el Servicio Market donde millones de usuarios de MetaTrader podrán comprarlo. Así que, encárguese sólo de sus asuntos profesionales- escribir los programas para el trading automático.
Está perdiendo oportunidades comerciales:
- Aplicaciones de trading gratuitas
- 8 000+ señales para copiar
- Noticias económicas para analizar los mercados financieros
Registro
Entrada
Si no tiene cuenta de usuario, regístrese
Para iniciar sesión y usar el sitio web MQL5.com es necesario permitir el uso de Сookies.
Por favor, active este ajuste en su navegador, de lo contrario, no podrá iniciar sesión.