Nuevos indicadores técnicos para MetaTrader 4 - 15
Description:
This indicator (with its Fibonacci algorithm) marks Buy and Sell zones, which indicate where a trend has a higher probability of continuing either upward, or downward.
Additionally, there are horizontal lines drawn for each day, which show a high probability level of where price is likely to break out, and continue either higher, or lower. This indicator will never repaint.
Features: The main strength of this indicator is that the user is able to visually assess what the

Next level of trend trading here. Possibility 75%, the indicator analyzes the current market to determine short (small dot), middle (circle with a dot inside) and long (cross with a circle and a dot inside) trends. Wingdings characters of Aqua color represents the beginning of the UP trend. Wingdings characters of Orange color represents the beginning of the DOWN trend. Possibility 75% Indicator will improve your trading in the world of forex, commodities, cryptocurrencies and indices.
Добрый День, Всем. Решил выложить свой индикатор, предложить на просмотр. Я трейдер, Вадим Сергеевич Лепехо. Индикатор не стандартный, сделан не по канонам. Индикатор рисует маржинальные зоны на графике, пока полет нормальный. Но строит зоны по индикатору AO(Awesom) конкретней по фрактальным зонам индикатора AO. Зоны стандартные 1/4, 1/4, и НКЗ. Пример привожу по EURUSD + в картинках. На данный момент 14.10.23 - нкз=1920 пипсов(192 пункта) предлагаю преобразить до 192пипсов(19.8пунктов). Поясняю
FREE

GG TrendBar Indicator - Your Multitimeframe ADX Trading Solution Experience the power of multi-timeframe trading with the "GG TrendBar Indicator." This versatile tool, built upon the ADX indicator, offers precise insights by considering multiple timeframes, ensuring you make well-informed trading decisions. Basic Details : Indicator Type : GG TrendBar Indicator (Multi-Timeframe ADX) Key Metrics : Real-time ADX analysis across multiple timeframes. Customization : Enable or disable specific timefr
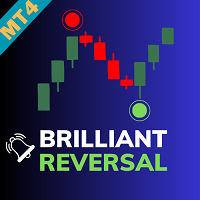
Brilliant Reversal Indicator - Your Ultimate Alert-Driven Trading Solution Unlock the potential for unparalleled trading success with the "Brilliant Reversal Indicator." This powerful tool has been meticulously designed to empower traders by identifying critical reversal opportunities with lightning-fast alerts. Key Features : Precise Reversal Detection : The Brilliant Reversal Indicator specializes in pinpointing potential trend reversals, helping you seize opportunities to enter or exit positi

This indicator idea comes from Tushar Chande called Qstick.
Technical indicators quantify trend direction and strength in different ways.
One way is to use the difference between close and open for each bar and to sum it up over a period of time.
The formual is:
Qstick (period ) = Average ((close-open ), period )
In this indicator, we can choose how to calculate body by two famous chart types. The first and default indicator settings are based on Heiken Ashi chart, and the second i
FREE

Добрый День, всем привет, здравствуйте. Я. трейдер, 20 лет опыта, Вадим Сергеевич Лепехо. Создал этот индикатор на базе уже готового стрелочного индикатора (arrrows_template). Решил с вами поделиться с наработками. Данный индикатор рисует стрелки по стратегии: "Тринитти". Индикатор выдает сигнал на вход когда rsi ниже 50; AO ниже 0; и Price ниже MA9-ход делаем вниз. Индикатор выдает сигнал на вход когда rsi выше 50; AO выше 0; и Price выше MA9-ход делаем вверх. Предлагаю на демо-счете протести
FREE

Всем привет, мои друзья, сябрыыы. Я трейдер, 20 лет опыта. Хочу продемонстрировать свой индикатор. Индикатор создан на базе в тесной кооперации с индикатором arrows_template. Данный индикатор рисует на графике инструмента (любого) индикатор AO(Awesom) поверх. Видите сам AO на графике. Видите пересечение зоны нуля, Блюдце и т.д.. Если будут подсказки, корректировки. Пишите смело, всех пошлю.......Шутка До свидания.
FREE

A universal pulse indicator for finding an entry point for a trend breakdown, followed by transaction tracking at Fibonacci levels without redrawing. The indicator itself is an independent trading system designed for intraday trading on the M5 time frame, but it also performs well on large timings. Trading on the indicator occurs exclusively with pending orders, which allows you to solve one of the biggest problems of any trader, these are trend - flat definitions. The essence is to filter out
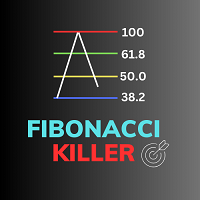
Fibonacci Killer - Your Ultimate Trading Assistant Are you ready to take your trading to the next level? Introducing Fibonacci Killer, the ultimate trading indicator designed to help you spot critical trading opportunities like never before. Key Features : Fibonacci Magic : Fibonacci Killer harnesses the power of Fibonacci retracement levels to provide you with precise entry signals. It monitors the market and generates signals as soon as a new candle begins, giving you a head start in your trad

Добрый день. Всем привет. Здравствуйте. Я. трейдер 20 лет опыта торгов. Вадим Сергеевич Лепехо. Предлагаю Вам на смотрины индикатор. Индикатор прост. Работает по мувингам. Работать на нем лучше всего с 09:00- 18:00 мск. времени. На "таймфреме": m5; m15. Слегка замысловатая схема чтения сигнала в виде стрелок. Если индикатор рисует стрелку на графике вверх, ХОД ДЕЛАЕМ ВНИЗ от Low - откладываем 10 пипсов, ход делаем - отложенным ордером(pending), SELL STOP Если индикатор рисует стрелку на графике
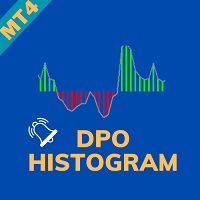
Indicator DPO Histogram Alert - The Ultimate Trading Companion Unveil the potential of the "DPO Histogram Alert Indicator," your steadfast ally in the realm of trading. This robust tool is meticulously crafted to ensure you're always in the know by providing prompt alerts based on the Detrended Price Oscillator (DPO) Histogram. Basic Details : Indicator Type : DPO Histogram Alert Alert Features : Real-time alerts for significant DPO Histogram movements. Customization : Fully adjustable settings

Всем привет. Данный индикатор прост, как божий день. Кстати, я , Вадим Сергеевич Лепехо, трейдер(частный) опыт 20 лет. Предлагаю приобрести мой индикатор. Построен он на базе индикатора arrrows_template. Индикатор рисует стрелки на графике при пересечении скользящих. Все просто. Видим стрелку вниз - ходим вниз отложенным ордером(pending) SELL STOP, откладываем от Low 10pips(пипсов). Фиксируем профит в целях 5, 10,15 пунктов. Видим стрелку вверх - ходим вверх отложенным ордером(pending) BUY STOP

The UT Bot Alert MT5 Indicator is an advanced technical analysis tool designed to help traders optimize their trading performance. This indicator is MT5 conversion of the UT Bot alerts indicator by “QuantNomad “ in Trading View website and some alert methods are added to provide real-time alerts when a trading signal is generated, in order to allow traders to act quickly and efficiently. Key Features: Alert Types: in addition to the terminal pop-up alerts, the mobile notification sends the alert

Добрый всем ДЕНЬ, вечер, утро. Я, трейдер(частный), Вадим Сергеевич Лепехо, 20 лет опыта. Предлагаю Вам очередной продукт. Построен на базе индикатора arrows_template.Индикатор не затейливый. Вообщем прост в понимании. Видите квадраты синего цвета: High & Low. Ждите куда цена пробьет, после пробития дожидаемся появления зоны: боковик, флэта, консолидации, замедления, накопления. Выставляем отложенный ордер от High или Low смотря куда был пробой: вверх или вниз. Цена приблизительно почти доходи
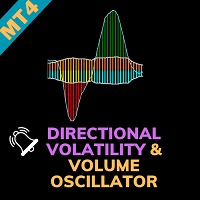
Directional Volatility & Volume Oscillator - Unleash Your Trading Potential Welcome to a new era of trading excellence with the "Directional Volatility & Volume Oscillator." This innovative indicator is engineered to provide you with essential insights into market volatility and volume, empowering you to make well-informed trading decisions. Basic Details : Indicator Type : Directional Volatility & Volume Oscillator Key Metrics : Real-time volatility and volume insights for precise trading analy

Step into the future of automated trading with the Beast Indicator V7, The indicator allows you to trade binary options. T his indicator give high winning ratio with over 20 years of backtesting an unparalleled tool that seamlessly transforms your trading journey into an effortless and lucrative venture. Designed to simplify and optimize the trading process, the Beast Indicator is the ultimate game-changer, offering a hassle-free experience that allows you to set your buy and sell options effo
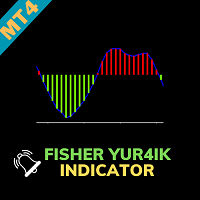
Fisher Yur4ik Indicator - Unlock Precise Trading Insights Explore a world of precision in trading with the "Fisher Yur4ik Indicator." This advanced tool is designed to provide traders with accurate insights into price trends, allowing for well-informed decisions and enhanced profitability. Basic Details : Indicator Type : Fisher Yur4ik Indicator Key Metrics : Real-time analysis of price trends and potential turning points. Customization : Fully customizable settings to align with your unique tra

The True Magic Oscillator indicator is designed for signal trading. This indicator generates trend signals.
It uses many algorithms and indicators to generate this signal. It tries to generate signals from the points with the highest trend potential.
This indicator is a complete trading product. This indicator does not need any additional indicators.
The indicator is never repainted. The point at which the signal is given does not change.
Features and Recommendations Wor

custom Power Trading Indicator or in short called Customm.
This indicator combines multiple build in custom indicators for super accurate prediction of price movements on all trading pairs like EUR/USD , USD/JPY , GOLD , OIL , SILVER . This indicator can be converted to and expert adviser also , this indicator is very good for scalping or a long time positions . This indicator doent not repaint or re draw .

Gold Venamax : este es el mejor indicador técnico de acciones. El algoritmo del indicador analiza el movimiento del precio de un activo y refleja la volatilidad y las posibles zonas de entrada.
Características del indicador:
Este es un súper indicador con Magia y dos bloques de flechas de tendencia para un comercio cómodo y rentable. El botón rojo para cambiar de bloque se muestra en el gráfico. La magia se establece en la configuración del indicador, por lo que puede instalar el indicador

Título: Revelando el indicador MT4 GOLDEN SUN 123 TREND_Dashboard_With_Alert En el mundo en constante evolución de los mercados financieros, los operadores buscan constantemente herramientas que les proporcionen una ventaja competitiva. En medio de esta búsqueda de precisión y rentabilidad, el indicador MT4 GOLDEN SUN 123 TREND_Dashboard_With_Alert brilla como un faro de oportunidad. Este notable indicador, diseñado para la plataforma MetaTrader 4, encapsula la esencia del comercio estratégico c

Tendencia del oro : se trata de un buen indicador técnico bursátil. El algoritmo del indicador analiza el movimiento del precio de un activo y refleja la volatilidad y las posibles zonas de entrada.
Las mejores señales del indicador:
- Para VENTA = histograma rojo + puntero rojo CORTO + flecha amarilla de señal en la misma dirección. - Para COMPRA = histograma azul + puntero azul LARGO + flecha de señal aqua en la misma dirección.
Ventajas del indicador:
1. El indicador produce seña

Este indicador se basa en la experiencia práctica.
Introduce la fecha/hora de tu top/bottom.
Calcula el nivel más visitado desde el top/bottom hasta el momento actual.
Se actualiza automáticamente con cada nueva vela. Puede utilizar simultáneamente varios indicadores para diferentes tendencias y plazos.
La duración se traza siempre desde el inicio del periodo hasta el momento actual.
Útil herramienta PRO.

un indicador para el comercio binario basado en 3ma cruzado con macd, proporciona señales de compra y venta en la barra abierta y no se repinta ni retrocede
El indicador no se centra en una alta tasa de ganancias, ya que está diseñado para el comercio de martingala, el indicador se centra en el menor número de señales perdedoras consecutivas.
Estrategia :
El depósito mínimo es de 1000 unidades, comenzamos a operar con 1 unidad (el tamaño de la operación es 1 unidad por cada 1000 de capital)

Smart Ai Levels Accumulation & Distribution indicator
Smart Ai Levels are Ai controlled indicator which is based on Wyckoff Price cycle theory . It automatically scans the Accumulation & Distribution phases on chart and Ai draws the possible areas before Mark up and Mark down which acts as hot zones and can be traded with confirmation to catch those big price movements . It's a great tool for both Reversal and Breakout Trades suitable to all Trading Styles such as Scalping - Intraday - Swing
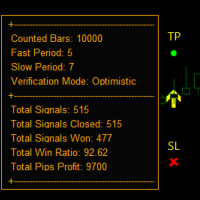
Basado en una estrategia cruzada de 3 promedios móviles, la flecha estadística brinda señales de compra y venta con tp y sl en puntos dibujados en el gráfico, viene con un panel de prueba posterior que muestra la tasa de ganancias y cuántas operaciones se cerraron, cuántas ganaron, cuántas pérdida, ganancias finales obtenidas, el indicador imprime una flecha junto a tp y sl en BAR OPEN y da una alerta previa.
Los parámetros se muestran en la captura de pantalla de configuración y se explican.

Indicador MACD multidivisa y multiplazo. El panel puede mostrar tanto el MACD tradicional (verdadero) como el MACD integrado en MetaTrader.
En el panel puede ver el estado actual del indicador: la dirección del movimiento de las líneas MACD, su intersección y una ventana emergente con el gráfico del indicador. En los parámetros puede especificar los pares-símbolos y plazos que desee. El escáner también puede enviar notificaciones sobre líneas que se cruzan entre sí y sobre líneas que cruzan e

Point Trend Indicato - un indicador del nivel superior e inferior de la tendencia, que puede determinar la dirección de la tendencia e indicar su fortalecimiento. La dirección de la tendencia está determinada por puntos redondos; si los puntos están por encima de la línea cero, la tendencia es alcista; si están por debajo, la tendencia es bajista. El aumento del movimiento direccional se indica con flechas. Tiene el único parámetro para ajuste manual: Duración de la dirección de la tendencia.

Indicador "Auto FIBO": ¡es una excelente herramienta auxiliar en el comercio!
El indicador calcula y coloca automáticamente en el gráfico los niveles de Fibo y las líneas de tendencia locales (color rojo) Los niveles de Fibonacci indican áreas clave donde el precio puede revertirse Los niveles más importantes son 23,6%, 38,2%, 50% y 61,8% Puede usarlo para reversión de especulación o para operaciones de cuadrícula de zona. También hay muchas oportunidades para mejorar su sistema actual utiliz
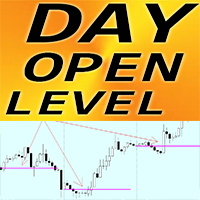
Indicador Forex DÍA NIVEL ABIERTO para MT4
El indicador "Nivel de apertura del día" es un indicador auxiliar muy útil El nivel de día ABIERTO es muy importante porque muy a menudo el precio regresa a esa zona durante el día. El indicador le muestra la línea abierta diaria para cada día. Es útil para los operadores intradiarios establecer objetivos o utilizarlos como área de soporte/resistencia. El indicador de nivel de apertura diaria se puede utilizar para operaciones intradiarias de reversi

ECM Elite Channel is a volatility-based indicator, developed with a specific time algorithm, which consists of finding possible corrections in the market.
This indicator shows two outer lines, an inner line (retracement line) and an arrow sign, where the channel theory is to help identify overbought and oversold conditions in the market.
The market price will generally fall between the boundaries of the channel. If prices touch or move outside the channel, it's a trading opportunity.
The

Nas100 killer V2 (See video of how we test the indicator live) 1000% non-repaint indicator appears on current candlestick. Timeframes: M5, M15, M30, H1, H4. Works on pairs such as (NAS100, US30, SPX500, and Gold) The indicator is strictly for scalping do not hold trades for too long. Orange arrows look for selling opportunities. Light Blue arrows look for buying opportunities.
This indicator is a line constructed based on the maximum/minimum values that go beyond the channel from the maximum/minimum prices for a longer period. In fact, two types of channel are used simultaneously: The first one is built based on the highs/lows for the selected period (Ind_Period); The second one is built based on the smoothed value of the maximum/minimum price values (Smoothing_Channel, Shift_Channel). To calculate the indicator, the highest/lowest value of the two channels is tak
FREE

The presented indicator allows you to determine potential entry points into the market and set protective orders at reasonable levels. This product can be useful for both beginners and experienced traders. The indicator is based on calculation methods proven by time and practicing traders.
The indicator is calculated in two stages: At the first stage, linear regression (LR) of the selected price type is determined for a given number of chart periods. At the second stage, the obtained data is p
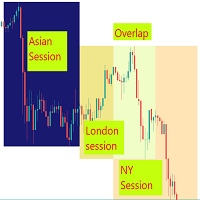
Visual guide which divides the 24 hours into three trading sessions. The default setting is to show Asian , London and New York sessions. But, the session start and end hours can be adjusted as required.
The indicator is useful to develop trading strategies by making it easy to see the market behavior during the three sessions.
Inputs Time Zone Start and End hours (Please provide values in HH:MM format, like 02:00, not like 2:00. Both the hours and minutes should have 2 digits)

This indicator is great for trading on many currency pairs The indicator itself uses mathematical strategies with augmented precision. Many settings can be configured. There are elements on the chart for visualization. He displays his solution on a graph in the form of icons. There are several types of icons. In the tester it works fine by default in the settings. It is already configured by default. Happy bidding.

This indicator is great for trading on various trading pairs. The indicator itself uses mathematical linear strategies of augmented accuracy, but for now they are optimized for some currency pairs. Many settings can be configured in the initial settings. There are lines and arrows on the graph for visualization. He displays his solution on a graph in the form of icons. There are only two types of badges. In the tester it works fine by default in the settings. It is already configured by default

The Pure Cross Entry Signal Indicator is a powerful tool designed to assist traders in making informed decisions in the financial markets. This advanced indicator leverages cutting-edge algorithms and technical analysis to identify potential entry points with high accuracy. The indicator works based on instant price movements. This indicator is a complete trading product. This indicator does not need any additional indicators.
The indicator certainly does not repaint. The point at which t

True Super Arrows is a powerful and versatile indicator that can help you identify and trade profitable trends. The indicator uses a combination of technical indicators to generate arrows that point to the direction of the trend. Features: Multiple trend identification methods: The indicator uses a combination of moving averages, trend lines, and other indicators to identify trends. Accurate trend direction: The indicator uses a variety of techniques to ensure that the arrows are pointing in

Camarilla Pivot Points is a math-based price action analysis tool that generates potential intraday support and resistance levels. Pivot price values are stored in output buffers within this indicator, enabling any Expert Advisor to utilize this indicator's data for trading purposes. This indicator offers the potential for developing numerous strategies. To explore some of these strategies, please visit the following websites: https://www.babypips.com/forexpedia/camarilla-pivot-points https:

In the ever-evolving world of financial markets, having the right tools at your disposal can make all the difference. Introducing "Super Trend Filtering," the MetaTrader 4 (MT4) indicator that elevates your ability to identify and leverage market trends. Key Highlights: Pinpoint Trend Accuracy: "Super Trend Filtering" harnesses cutting-edge algorithms to precisely identify market trends. Tailored to Your Preferences: Customize "Super Trend Filtering" to align with your trading strategy. Adjust

Bollinger Squeeze Trend Indicator is a technical analysis tool used in the investment and trading world. This indicator helps identify market trends by analyzing the price movements of assets.
The Bollinger Squeeze Trend Indicator uses a variation of Bollinger Bands and focuses specifically on the relationships between volatility and price movements. Essentially, the Bollinger Squeeze Trend indicator is designed to recognize periods of narrowing and widening of bands. This can help identify p

Description:
This indicator (with its algorithm) marks relative highs and lows, which have an array of useful applications.
This indicator will never repaint.
Features:
Marks relative highs and lows Use this to determine points of trend continuation i.e. where the trend may pull back before continuing higher or lower, past this point Or use this to determine potential points of reversal, particularly in ranging markets, or with other price action These highs and lows can sometimes
FREE
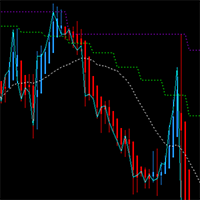
This MT4 chart trend checker cuts through the noise of market volatility to provide a clearer picture of trends and price movements. It includes the following features that can provide more clarity during market assessments: 1 customizable multi-period moving average Optional Heikin-Ashi candles 3 switchable focus modes Distinct colors for easy analysis
Link to MT5 version: https://www.mql5.com/en/market/product/106707/
This indicator shows your preferred moving average from multiple time fr
FREE
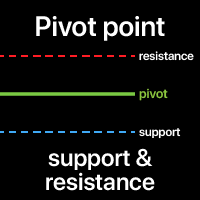
A Pivot point is used to determine the overall market trend. The pivot level itself is the average of the high and low, and the closing price from the previous bar.
On the next bar trading above the pivot point is thought to indicate ongoing bullish sentiment, while trading below the pivot point indicates bearish sentiment.
The pivot point is the basis for the indicator, but it also includes other support and resistance levels that are projected based on the pivot point. All these levels h
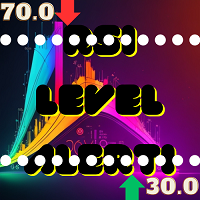
Simple alert system which will alert you on your mobile terminal, email and on the chart whenever RSI crosses below the overbought level or above the oversold level. Use this alert system, so you don’t have to watch the chart all day for the RSI levels to break.
INPUTS: 1. RSI Period- (Default is 14). Number of candles the RSI indicator will look back for the calculations. 2. OB Level- (Default is 70). This is the Overbought level or Upper level for the RSI indicator. 3. O

Are you looking for a reliable tool to help you identify trends in the Forex market? Look no further! Introducing "Trend Spotting," your ultimate trend identification solution for MetaTrader 4 (MT4).
How to determine the trend: Down Trend: As soon as the Yellow signal line is below zero, the Green Slow Trend line is below zero and the main trend osliator falls below zero, it means that the downtrend has started. Up Trend: When the Yellow signal line is above zero, the Green Slow Trend line is

xBrat Range Breakout For The MT4 Platform. Designed to help define opening ranges of major markets, along with Gold Pit opens, Oil Pit opens and for major economic data points. We recommend timeframes for opening ranges on different type of instruments further down this description.
The xBrat Range Breakout combines the xBrat indicator with the range breakouts. It identifies price movements, market momentum, and trends. MT4 xBrat Range Breakout isn’t only about finding breakout chances. It hel

DYJ T3ModeMA se basa en el algoritmo T3.
El algoritmo T3 se introdujo en el campo del análisis técnico en el artículo “Better Moving Averages”, publicado en la revista estadounidense TASC.
T3 suaviza las series de precios al tiempo que reduce el retraso en el sistema de seguimiento de tendencias.
El tamaño de la columna del indicador determina la señal de entrada, y cuando el tamaño de la columna se acerca a 0, es el punto de inflexión de la tendencia.
El indicador utiliza técnicas de negoci
En el acelerado mundo de los mercados financieros, cada segundo cuenta y cada decisión puede ser decisiva para una operación. Entra en el indicador Binary Hacker, una herramienta innovadora que está preparada para transformar la forma en que los traders analizan los movimientos de los precios, minuto a minuto. Revelando la precisión en el trading: El indicador Binary Hacker no es una herramienta de trading ordinaria. Funciona como un analizador en tiempo real, diseccionando cada minuto del gráfi

"Ppr PA" is a unique technical indicator created to identify "PPR" patterns on the currency charts of the MT4 trading platform. These patterns can indicate possible reversals or continuation of the trend, providing traders with valuable signals to enter the market.
Features: Automatic PPR Detection: The indicator automatically identifies and marks PPR patterns with arrows on the chart. Visual Signals: Green and red arrows indicate the optimal points for buying and selling, respectively. A
FREE

Smart Liquidity Levels is a valuable tool for identifying optimal liquidity levels, enabling retail traders like us to strategically set our stop-loss orders. T he essential tool for traders seeking to maximize their trading success. The liquidity level is a critical component of inner circle trading (ICT). It assists us in determining when and how we should enter the market. Watch the video for detailed instructions. Here's why understanding liquidity levels is crucial in trading and how our

SuperOsma Arrow es un indicador basado en osma de supertendencia que proporciona señales de compra y venta, el indicador no se repinta y viene con un panel que muestra estadísticas de señales.
Plazo recomendado: 15 años y más
Comprar: la flecha de compra aparece en la barra abierta, configure tp y sl como se muestra en el gráfico
Vender: la flecha de venta aparece en la barra abierta, configure tp y sl como se muestra en el gráfico
=================================
El panel mu

The Bars Deflection trend indicator can be used with any trading pair and on any time frame. With this indicator it is impossible to miss the beginning of a trend. Use Bars Deflection as a standalone strategy or as an addition to yours. Signal arrows appear on the chart at the moment the bar opens and are located at the breakout level of the reverse movement. Thus, the arrows not only indicate the possible direction of movement of the quote, but also act as levels for analyzing the placement of

El indicador muestra cualquier texto e imagen en el gráfico, y también puede mostrar información solicitada por macros. Hay tres bloques de texto y un bloque para imágenes. Se puede seleccionar la fuente, el tamaño, el color, la sangría y la posición. Si desea marcar sus capturas de pantalla o mostrar la información requerida en un gráfico, UPD1 Watermark será una herramienta muy útil.
Descripción de los ajustes.
Ajustes de texto (3 bloques). Text 1, 2, 3 – introducir texto y, o macro. Font
FREE

Cuando compre Easy Trend Pro, recibirá GRATIS Advanced SR junto con una estrategia de negociación que combina EasyTrendPro y AdvancedSR . Después de realizar su pago, por favor, envíeme un mensaje por separado para recibir su regalo. Soporte del Canal: Haz clic aquí Tienda: Haz clic aquí
"Las tendencias son tus amigas" es una frase que probablemente haya escuchado antes. Es un dicho clásico que lo sigue mientras opera en el mercado. Cuando sigues la tendencia actual, aumenta tu porcentaje
WONNFX iN M5 - Arrow indicator for Forex and Binary Options. Reliable signal algorithm. Indicator not repaint. Indicator working hours: 21:55-23:00. GMT+2. Average winrate = 60-70%.
Recommendations: Timeframe: M5. Expiration: 2-3 candles (1 candle = 5 minutes) Symbol: EURUSD, USDJPY, EURAUD, GBPAUD, EURJPY, AUDUSD, USDCAD, NZDUSD, AUDCAD, AUDCHF, AUDJPY, AUDNZD, CADJPY, EURCAD, EURGBP, GBPUSD, GBPCAD, NZDJPY, CADJPY, XAUUSD
*NOTA : ¡40% de descuento para los primeros compradores! El lanzamiento de EA gratuito será la segunda semana de noviembre El descuento termina una vez que EA GRATIS esté disponible El indicador RSi es uno de los indicadores más populares para señalar cuándo un determinado producto o par está sobrecomprado o sobrevendido.
El medidor de fuerza de moneda también es un indicador de tendencia que se basa en múltiples monedas.
El medidor de fuerza de moneda RSi es un indicador de un gráfico que
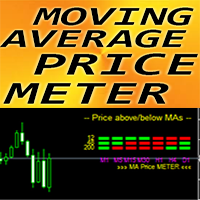
Indicador Forex "METRO de precio medio móvil" para MT4
Actualice sus métodos de negociación con este útil indicador: MA Price METER Excelente para el método de negociación de marcos de tiempo múltiples de "3 pantallas" Este indicador compara el valor del precio actual con las MA correspondientes en 7 marcos de tiempo diferentes. Cuadro verde: el precio está por encima del MA correspondiente Cuadro rojo: el precio está por debajo del MA correspondiente
// Más asesores expertos e indicadores
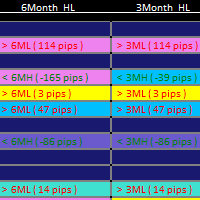
1. Updated usage instructions in blog below: Smart Market Structure Trading System and Automatic Scanner - Trading Systems - 13 October 2023 - Traders' Blogs (mql5.com) https://www.mql5.com/en/blogs/post/754495 2. YouTube video link for introduction: https://youtu.be/tMU04wo0bc8 3. The Smart Market Structure Opportunity Scanner is a great tool to find trading entries and exits based on Smart Money Concepts. It has a build-in custom choice of Forex pair lists to choose from for the scan, and

Let us introduce you to a new era of neural indicators for financial markets! Intelligent Moving is a unique indicator that trains its neural network in real time! You no longer need to look for the optimal indicator parameters for each specific situation. No more late signals. The artificial intelligence is able to adapt itself and predict any market movements.
Visually, the indicator is drawn as a main solid moving average line, two dotted lines of standard deviations and signal arrows. For

With the help of this Practica Trend forex indicator algorithm, you can quickly understand what kind of trend is currently developing in the market. The Practical Trend indicator accompanies long trends, can be used without restrictions on instruments or timeframes. With this indicator, you can try to predict future values. But the main use of the indicator is to generate buy and sell signals.
The Practical Trend indicator is used in the forex markets. One of the main definitions for monitori

The Crit indicator analyzes price behavior and, if there is a temporary weakness in the trend, you can notice this from the indicator readings, as in the case of a pronounced change in trend direction. Entering the market is not difficult, but staying in it is much more difficult. With the Crit indicator, staying on trend will become much easier! This indicator allows you to analyze historical data and, based on it, display instructions for further actions on the trader’s screen.
A arrow tech

Dr Trend is a trend indicator for the MetaTrader 4 trading platform. This indicator allows you to find the most likely trend reversal points. You won’t find a proprietary indicator like this anywhere else. A simple but effective system for determining the Forex trend. From the screenshots you can see for yourself the accuracy of this tool. Works on all currency pairs, stocks, commodities, cryptocurrencies.
Are you already tired of constant ups and downs? You shouldn’t fall victim to unstable

The Trahin indicator determines the prevailing trend. They help analyze the market on a selected time interval. Easy to set up and works on all pairs and all time intervals. Trend indicators make it possible to classify the direction of price movement, determining its strength. Solving this problem helps investors enter the market on time and get good returns.
For any trader, it is extremely important to correctly determine the direction and strength of trend movement. Unfortunately, there is
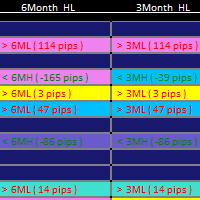
1. Updated usage instructions in blog below: Smart Market Structure Trading System and Automatic Scanner - Trading Systems - 13 October 2023 - Traders' Blogs (mql5.com) https://www.mql5.com/en/blogs/post/754495 2. The Smart Market Structure Opportunity Scanner is a great tool to find trading entries and exits based on Smart Money Concepts. It has a build-in custom choice of Forex pair lists to choose from for the scan, and it also has a user-defined entry choice to put down your own list of Fo
FREE

Candles Size ( Points ) Please leave a review about this product to help other users benefit from it. This simple tool provides crucial insights into current and historical market conditions, helping traders make informed decisions. Identify the longest candlestick over a customizable historical period. This information helps you spot significant price movements. See on YOUTUBE for key features This indicator is compatible with MetaTrader 4 The indicator is easy to install and use, making it
FREE

Indicator for Scalping with Signal Arrows
Three-Level Sensitivity Setting
This indicator rapidly identifies changes in price direction and provides signals for opening positions.
Signals trigger instantly on the current candle.
It includes built-in audio and visual alerts for trend changes.
It can send notifications to your phone or email.
It works on all timeframes, across all currency pairs, metals, indices, and cryptocurrencies.
It can be used for binary options trading.
Ke
The presented indicator is a trend indicator that displays with a colored line the current direction of price movement and the support/resistance zone in the form of a cloud. The indicator also marks points of change in price direction with arrows that appear after the bar is fully formed. The arrows are not redrawn. The rules for using the indicator are simple: We open a position when the price overcomes the high/low of the bar marked with an arrow in the direction opposite to the cloud. Arrow
FREE
El Mercado MetaTrader es una plataforma única y sin análogos en la venta de robots e indicadores técnicos para traders.
Las instrucciones de usuario MQL5.community le darán información sobre otras posibilidades que están al alcance de los traders sólo en nuestro caso: como la copia de señales comerciales, el encargo de programas para freelance, cuentas y cálculos automáticos a través del sistema de pago, el alquiler de la potencia de cálculo de la MQL5 Cloud Network.
Está perdiendo oportunidades comerciales:
- Aplicaciones de trading gratuitas
- 8 000+ señales para copiar
- Noticias económicas para analizar los mercados financieros
Registro
Entrada
Si no tiene cuenta de usuario, regístrese
Para iniciar sesión y usar el sitio web MQL5.com es necesario permitir el uso de Сookies.
Por favor, active este ajuste en su navegador, de lo contrario, no podrá iniciar sesión.