Nuevos indicadores técnicos para MetaTrader 4 - 13
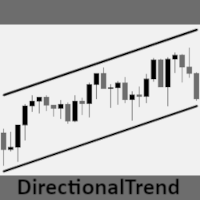
El indicador de trading DirectionalTrend es una herramienta innovadora diseñada para proporcionar una visión clara y precisa de la tendencia del mercado financiero. Basado en datos históricos del mercado, este indicador identifica y muestra la dirección general en la que se mueve el mercado en un período de tiempo específico. Su objetivo principal es ayudar a los traders a tomar decisiones informadas al proporcionar señales claras sobre la tendencia dominante en el mercado. Diseñado con una int
FREE

Indicadores en Forex que miden el tiempo es un gran exótico. Existe la creencia generalizada de que el tiempo no es analizable.
Este indicador tiene la siguiente lógica:
Sabemos por la física que la distancia es igual a la velocidad en el tiempo. S=V*t Si consideramos el tiempo será igual a la velocidad dividida por la distancia. t=S/V
La velocidad en forex es el volumen de ticks porque no es el volumen sino el número de ticks en un cierto período de tiempo, es decir, es la velocidad de

El objetivo del indicador "Black Horse" es identificar divergencias entre la acción del precio y el indicador VWAP. Emplea filtros para descartar posibles divergencias falsas y generar alertas de alta calidad y precisas.
Las divergencias bajistas se representan con puntos rojos sobre la vela, mientras que las divergencias alcistas se muestran con puntos verdes debajo de la vela.
El filtro principal para las divergencias se centra en el ATR (Rango Verdadero Medio) y el movimiento del precio

El precio aumentará en $30 después de cada venta de 5 copias. El indicador principal tiene como objetivo determinar la tendencia general del mercado. El sistema de colores, con colores brillantes y oscuros, busca identificar condiciones de mercado fuertes y débiles.
En mi opinión, este indicador es insuperable; funciona excepcionalmente bien cuando el mercado comienza a moverse.
Si prefieres utilizar el indicador en un marco de tiempo más largo, como 1 hora, 4 horas o diario, para obtener m

Candle Power Signals es un indicador de tendencia que utiliza una estrategia de búsqueda de posibles señales volátiles para tomar decisiones comerciales.
Al analizar el mercado, el indicador identifica zonas de mayor y menor volatilidad dentro del movimiento de tendencia direccional.
Los principales parámetros de generación de señal ya han sido configurados, los ajustes y periodos restantes están indexados en 2 parámetros para configuración manual:
1. "Candle calculation method" : 2 modos d
FREE

"Trend reversal ml4" es un indicador único diseñado para determinar los momentos de reversión de precios en tiempo real. Este es un sistema comercial listo para usar para Metatrader4. ¡El indicador no vuelve a dibujar sus valores! Basado en algoritmos avanzados y análisis técnico, este indicador le proporciona señales claras sobre posibles puntos de entrada y salida del mercado, ayudándole a tomar decisiones informadas.
Ventajas del indicador: alta precisión de la señal. el propio indicador m

Title: "Daotradingfx - The Perfect Key for Wave Trading with 7 Years of Experience"
Forex trading is never easy, but with the daotradingfx indicator, I have found a reliable partner, unlocking the door to success in wave trading. Built on the foundation of my 7 years of trading experience, this indicator is not just a tool; it is a comprehensive canvas of market understanding and convenience in trading.
Daotradingfx stands out with its ability to use multiple timeframes, a crucial feature t

RSI divergence indicator is a multi-timeframe and multi-symbol indicator that help us find divergences between price chart and RSI indicator. Always use the divergence indicators with other technical assets like support resistance zones, candlestick patterns and price action to have a higher possibility to find trend reversals. This indicator will identify the peaks and troughs of both price and the RSI indicator. You can adjust the parameters to adjust the strength and weakness of these peaks a
FREE

This automated DOJI BAR FINDER INDICATOR can be utilized to manage trades and identify potential areas of support and resistance for both buying and selling. It is designed to identify zones for Sell/Buy trades and can be effectively used in conjunction with other indicators, such as order block indicators, and more. Currently designed for MT4, it will later be adapted to function on MT5. We also offer the opportunity to customize the robot according to your trading strategy. https://t.me/FXTSPr
FREE
Forex and Gold OBI is an innovative indicator based on a study of price and market dynamics, utilizing the RSI indicator. This indicator helps you find the best moment to enter the forex market by signaling when the market is in overbought or oversold conditions. Moreover, The indicator calculates two possible targets and the stop loss for each trade, allowing you to optimize your risk/reward ratio. Price This indicator is easy to use and set up, working with any currency pair and timeframe. If
FREE

Technically, the indicator represents the difference between two fractal adaptive moving averages. Fractal Adaptive Moving Average (FRAMA) is a smart adaptive moving average developed by John Ehlers. FRAMA takes price changes into account and closely follows the price level, remaining straight during price fluctuations. FRAMA takes advantage of the fact that markets are fractal and dynamically adjusts the lookback period based on this fractal geometry. The indicator has the ability to send notif
FREE
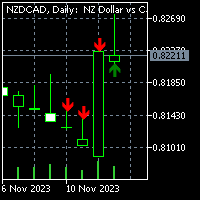
For MT5 version please click here . Introduction Most traders use candle patterns as a confirmation tool before entering a trade. As you know there are lots of candle patterns out there. However I realized most of them can be generalized in simple rules. So I developed my own candle pattern(Although I cannot say for sure this is mine). pattern description The pattern consists of three consecutive candles. This is true for most of the patterns out there (considering there is a confirmation nec
FREE
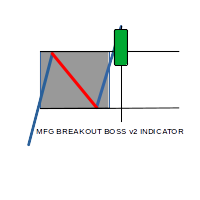
MFG breakout boss indicator is a Semi Autom ated Asian session range breakout System which seeks to identify the High and low of the asian session when the Market is ranging with no major movement, With the help of sofisticated Algorithm within the system, a breakout in either direction coupled with momentum the system gives High Accurate entries, with predefined Stop loss and 3 Take profit levels.

SX Currency Strength indicator allows users to analyze currency strength through a selected period, with results resetting periodically and accumulating thereafter. It displays the historical relative strength of eight major currencies (USD, EUR, GBP, JPY, AUD, CHF, CAD and NZD) across a selected timeframe. Assessing a currency's relative strength aids in evaluating its performance against a basket of other currencies. Users can select to visualize relative strength of the currencies in the shap
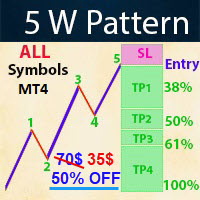
- Real price is 70$ - 50% Discount ( It is 35$ now )
Contact me for instruction, any questions! Introduction The Elliott Wave in technical analysis describes price movements in the financial market that are related to changes in trader sentiment and psychology. The 5 W Pattern (Known as 3 Drives) is an Elliott Wave pattern that is formed by 5 consecutive symmetrical moves up or down. In its bullish form, the market is making 5 drives to a bottom before an uptrend forms. In a bearish 5-d

In Forex trading, understanding support and resistance is crucial. Virtually every trading strategy incorporates these levels.
MetaTrader lacks built-in support and resistance calculation features, but there's a solution— the Support and Resistance Lines indicator.
This powerful MetaTrader indicator automatically calculates and displays support and resistance levels for any chosen currency pair or trading instrument.
Benefits of the Support and Resistance Lines indicator:
1. Identify be

This pass-band oscillator reduces lag in market data by filtering out high and low frequencies. It uses two EMAs (Exponential Moving Averages) with periods of 40 and 60.
Trigger points are added using an RMS cyclic envelope over the Signal line. The pass-band waveform output is calculated by summing its square over the last 50 bars and taking the square root to create trigger levels.
Buy when the pass-band crosses above its -RMS line and short when it crosses below the RMS line. The indicat

Attractive Numero - Numerology Levels Indicator Description: Discover the fascinating world of numerology in trading with our "Attractive Numero" indicator. This innovative tool allows you to seamlessly integrate numerology principles into your technical analysis, helping you identify critical supply and demand levels that can significantly enhance your trading strategy. How It Works: "Attractive Numero" is designed to harness the power of numerology to pinpoint supply and demand levels. You hav

ICT Kill zone and Macros Indicator mark and display the following zone times on the chart: Kill zones Kill zone Forex Asian
London Open New York Open London Close Central Bank Dealing range
Kill zone Indices Asian London Open New York AM New York Lunch New York PM Power Hour
Macros London 1 London 2 New York Am 1 New York AM 2 New York Lunch New York PM 1 New York PM 2
Silver bullet London Open New York AM New York PM
Sessions Asian London New York
Chart The display of Kill zone ,
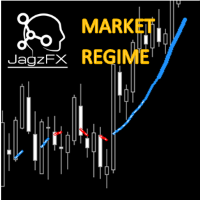
Elevate your trading with the JagzFX Market Regime Filter—adapt, optimize, succeed in navigating through smooth or volatile price movements. Gain a deeper understanding of market dynamics to refine your strategy and make informed decisions. KEY FEATURES Price Action Analysis: Distinguishes between smooth and volatile price movements. Trend Identification: Pinpoints bullish or bearish trends with precision. Strength Assessment : Evaluates the strength of identified trends—whether strong or weak M

Доброго времени суток уважаемые трейдеры и инвесторы.
Вашему вниманию предлагается индикатор, определяющий за любой промежуток времени : Максимальную цену. Минимальную цену. 50 % от от максимума до минимума. Цену закрытия периода. Кроме того, в зависимости от настроек - индикатор может добавлять 10 процентных уровней как вниз, так и вверх, эти уровни указываются, но по стандарту начинаются от 50% с шагом 50% до 500%. В обе стороны. Индикатор реализован максимально удобно, при смене тайм-фрейма

The Waddah Attar Explosion (WAE) indicator is a potent tool in Forex trading, offering buy, sell, exit buy, and exit sell signals. It assesses trends as trend power and momentum as explosion power.
Trend Direction: - Green bars indicate a bullish trend. - Red bars indicate a bearish trend.
Signal Line: - A line serves as a threshold for momentum.
Buy Trade Setup: **Entry:** Go long when a green bar crosses above the threshold. Place a stop loss below the entry candle. **Exit:** Close the
In MetaTrader, TP & SL values aren't visible when hovering over corresponding lines. Our indicator fixes this by showing values on-screen. It displays defined SL and TP values in your account currency, facilitating easy tracking of positions. Note : The indicator estimates values, excluding commissions, and allows customization of colors and distance from SL/TP lines.
SURE REVERSAL is a histogram overbought/oversold type indicator that gives key reversal points that indicates a bull or bear market movment this indicator is fusion between moving average and the rsi indicator ,this indicator is non repainter , and is not delayed . Parameters : Ma period Ma Method Ma Price Sure Period (Rsi) Sure Price (Rsi) ==============

note: this indicator is for METATRADER4, if you want the version for METATRADER5 this is the link: https://www.mql5.com/it/market/product/108106 TRENDMAESTRO ver 2.4 TRENDMAESTRO recognizes a new TREND in the bud, he never makes mistakes. The certainty of identifying a new TREND is priceless. DESCRIPTION TRENDMAESTRO identifies a new TREND in the bud, this indicator examines the volatility, volumes and momentum to identify the moment in which there is an explosion of one or more of these data a

- Real price is 80$ - 50% Discount ( It is 39$ now ) Contact me for instruction, any questions! Introduction The breakout and retest strategy is traded support and resistance levels. it involves price breaking through a previous level. The break and retest strategy is designed to help traders do two main things, the first is to avoid false breakouts. Many false breakouts start with a candlestick that breaks out of a level but ends with an immediate candlestick that brings the price back into t

ENIGMERA: El núcleo del mercado https://www.enigmera.com
Introducción Este indicador y sistema de negociación es un enfoque extraordinario de los mercados financieros. ENIGMERA utiliza los ciclos fractales para calcular con precisión los niveles de soporte y resistencia. Muestra la auténtica fase de acumulación y proporciona dirección y objetivos. Un sistema que funciona tanto si estamos en una tendencia como en una corrección.
¿Cómo funciona? ENIGMERA consta de tres líneas: la línea de s
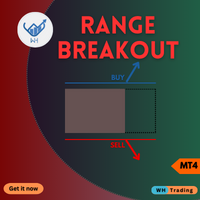
Desbloquee una nueva dimensión del trading con nuestro indicador MQL4 de vanguardia, Range BreakOut MT4
Esta poderosa herramienta está diseñada para identificar y capitalizar los movimientos de precios a medida que salen de los rangos establecidos.
proporcionándole la precisión y confianza necesarias para prosperar en el dinámico mundo de los mercados financieros.
Versión MT5 : WH Range BreakOut MT5
Características:
Detección de rango precisa. Señales de ruptura en tiempo real. P
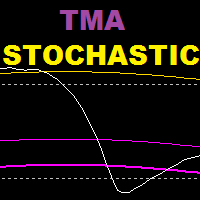
TMA Stochastic es un indicador basado en un oscilador estocástico y un indicador de bandas tma, este indicador se basa en una estrategia de reversión.
Periodo de tiempo recomendado: 15 años y más
Configuraciones recomendadas: valores más bajos para especulación, valores más altos para swing trading
==================================================== ======================
Parámetros:
Historial de tma: cuántas barras retroceden para mostrar las bandas de tma en el estocástico
Períod

Introducing the South African Sniper indicator created by a small group of traders with a few years trading trading the financial market profitably . This is a plug and play indicator that provides you with BUY and SELL (SNIPER ENTRY) signals with TARGET and trail stops. The indicator Works with all MT4 trading instruments. The indicator uses previous chart data as receipt to speculate on future market moves.
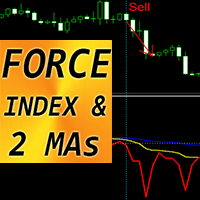
Indicador Forex "Índice FORCE y 2 medias móviles" para MT4
Este indicador es excelente para operar con Momentum en la dirección de la tendencia. El indicador "Índice de FUERZA y 2 medias móviles" le permite ver las medias móviles rápidas y lentas del índice de fuerza El índice de fuerza es uno de los principales indicadores que combina datos de precio y volumen en un solo valor. El índice de fuerza en sí es un poderoso oscilador que mide la cantidad de energía utilizada para mover el precio.

Daily supply and demand levels for breakouts or reversals. Use on 1 Hour charts No nonsense, for the confident trader who trades price action supply and demand levels with daily projections without the fluff using 1 Hour charts. MT5 Version: https://www.mql5.com/en/market/product/108522 The Bank Trader Indicator is a sophisticated tool employed by institutional traders, particularly those in banking institutions, to navigate the complex world of forex markets. Rooted in the principles of daily

The "Yesterday High Low" indicator for the MetaTrader 4 (MT4) trading platform is a powerful tool designed to help traders identify key price levels from the previous trading day. This indicator provides a visual representation of the high prices, low prices, high/low price averages, and intermediate average levels on the chart.
Primarily used by institutional and professional traders, this indicator offers an instant view of price levels that are often considered crucial in financial markets
FREE

The Datasource AC indicator is a technical analysis tool developed by the author based on the Accelerator Oscillator. Everyone knows the general principles of working with the AC indicator. Therefore, I will not describe them separately. I will focus on differences.
Differences are a purely technical implementation and expanded indicator. An important feature is that the indicator does not change its values even when using the closing price, since the indicator uses the safe calculation a
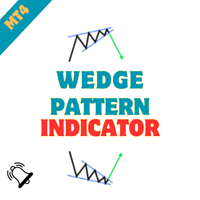
Wedge Chart Pattern Indicator - Unleash the Power of Wedge Patterns in Your Trading Embark on a journey of precision trading with the "Wedge Chart Pattern Indicator." Crafted for MetaTrader, this advanced tool is your ultimate companion for identifying wedge chart patterns, empowering you to make informed and strategic trading decisions. Whether you're a seasoned trader or just starting, this indicator simplifies the process of spotting wedge patterns, providing you with a valuable edge in the m
FREE

The SFT Fibo Smart Pivot indicator is a powerful trading tool based on the Fibonacci Golden Ratio, designed to identify key support and resistance levels in the forex market. This indicator has the ability to pinpoint significant price levels that can serve as entry and exit points for trades. It enables traders to analyze the market more effectively and make well-informed decisions. The indicator uses the Fibonacci Golden Ratio to accurately determine support and resistance levels. These levels
FREE

This indicator integrates the Bollinger Band strategy in calculation with a volume-over-MA
calculation to further narrow down "Areas of Interest" levels for a potential re-test zone to the right of the chart.
We added a Moving Average calculation for a multi-level cloud and further broke down more conditions to highlight both
volume flow crossover on the High and Extreme High MA's and also high and extreme high volume spikes on set period average
without bull\bear conditions. Original Bull
FREE

Head and Shoulders Pattern Indicator - Your Key to Recognizing Trend Reversals Unlock the power of pattern recognition with the "Head and Shoulders Pattern Indicator." This cutting-edge tool, designed for MetaTrader, is your trusted ally in identifying one of the most powerful chart patterns in technical analysis. Whether you're a novice or an experienced trader, this indicator simplifies the process of spotting the Head and Shoulders pattern, allowing you to make informed trading decisions. Key
FREE
The presented indicator is based on a fast digital filter (RFTL) with the help of which a short-term trend is predicted. This product marks trend reversal points and support/resistance lines. The indicator has six calculation options: 1. Identifies the closing price leaving the channel; 2. Identifies the exit/entry of the closing price outside the channel; 3. Identifies the closing price leaving the channel and sideways price movement; 4. Identifies the average price going beyond the channel; 5.
The presented indicator is based on a slow digital filter (RSTL) with the help of which a long-term trend is predicted. This product marks trend reversal points and support/resistance lines. The indicator has six calculation options: 1. Identifies the closing price leaving the channel; 2. Identifies the exit/entry of the closing price outside the channel; 3. Identifies the closing price leaving the channel and sideways price movement; 4. Identifies the average price going beyond the channel; 5.

Symmetrical Triangle Pattern Indicator - Mastering Trend Recognition in MetaTrader Unlock the power of trend recognition with the "Symmetrical Triangle Pattern" indicator for MetaTrader. This innovative tool simplifies the identification of symmetrical triangle patterns, providing traders with clear signals for potential trend continuation or reversal. Elevate your trading strategies with this MQL offering. Key Features : Accurate Pattern Recognition : The Symmetrical Triangle Pattern Indicator
FREE

Flag Pattern Indicator - Your Guide to Flagging Profitable Trade Setups Welcome to the world of precision trading with the "Flag Pattern Indicator." Designed for MetaTrader, this powerful tool is your go-to solution for identifying one of the most reliable and versatile chart patterns in technical analysis: the flag pattern. Whether you're a seasoned trader or just starting, this indicator simplifies the process of spotting flag patterns, giving you an edge in your trading decisions. Key Feature
FREE
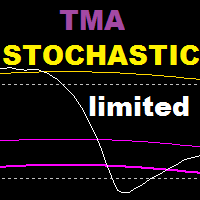
TMA Stochastic is an indicator based on stochastic oscillator and tma bands indicator , this indicator is based on a reversal strategy . Recommended time frame : 15 and above Recommended settings : lower values for scalping , higher values for swing trading WORKS ONLY ON EURUSD , GET THE FULL VERSION : https://www.mql5.com/en/market/product/108378 ======================================================================= Parameters : tma history : how many bars back to show tma bands on stochas
FREE

Supreme Direction is an indicator based on market volatility , the indicator draws a a two lined channel with 2 colors above and below price , this indicator does not repaint or back-paint and signal is not delayed. how to use : long above purple line , short below golden line. Parameters : channel period ========================================================
FREE
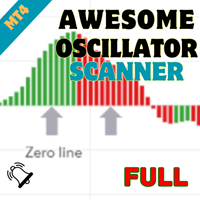
Welcome to the world of advanced trading with the Awesome Oscillator Scanner! Maximize your trading experience with our powerful MT4 indicator designed for seamless analysis and real-time insights. Key Features: Effortless Awesome Oscillator Scanning: Unlock the full potential of the Awesome Oscillator Scanner by effortlessly scanning multiple currency pairs. Receive instant alerts when specific Awesome Oscillator conditions are met, ensuring you stay ahead of market movements. Comprehensive Da

Supreme Stoploss is an indicator for metatrader 4 that is based on the ATR indicator , it gives stoploss/takeprofit as lines drawn above and below the price , this indicator does not repaint/back paint and is not delayed. can be used to determine the stop loss or take profit of a trade using ATR value multiplied by the number set by user. ====================================================================================================== Parameters : ATR SL period : ATR period identity : leave
FREE
Supreme MaChannel is an indicator based on moving averages , the indicator gives dynamic support and resistance in bands format. Recommended for reversal traders , add it to your reversal strategy. Parameters : Supreme MA Period : ma periods Supreme MA Price : close/open/high/low..etc Supreme MA Type : Simple/Exponential/Smoothed/Linear Weighted Deviation : bands deviation the distance between the two band lines
Supreme Entry is an arrow signal based indicator that give buy and sell signals , the indicator gives buy/sell signals with alert on candle open/close (depends what you set it to be from inputs) . this indicator does not repaint/back-paint and signal is not delayed. Strategy : Open buy same moment buy arrow appear and open sell same moment a sell arrow appear , close on well or on opposite signal . Recommended Time frame : 15 and above this arrow is good as ? : addon to your existing strategy ,
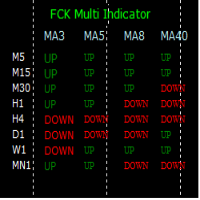
The FCK Multi Indicator for MT4 displays trend direction of multiple indicators on multiple time frames for a pair. So, forex traders can see the trend direction at a snap and trade with confluence of multiple indicators. Furthermore, it helps traders to see the trend in multiple time frames and trade in the direction of the overall market trend. Additionally, it shows the stop loss, pips to stop, pips in profit of any open position. The indicator display is very neat and is very helpful for bot
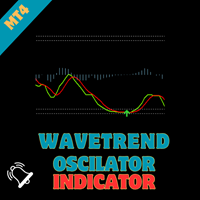
WaveTrend Oscillator - Bringing Tradingview's Renowned Indicator to MQL Elevate your trading strategies with the "WaveTrend Oscillator," an MQL port of the renowned TS/MT indicator created by Lazybear on tradingview. This powerful indicator provides valuable insights into market dynamics, offering clear signals for optimal entry and exit points in your trades.
Key Features : Proven Effectiveness : Based on the popular TS/MT indicator, the WaveTrend Oscillator brings a time-tested and proven ap
STOCH ARROW is a long short arrow signal type indicator that is based on standard stochastic oscillator this indicator has 3 methods of giving long and short signal that are as follow : 1.whenever stochastic lines cross 2.when a cross happens in overbought and oversold zones (short arrow on overbought zone cross , long arrow on oversold zone cross) 3.when stochastic lines leave overbought and oversold zones (short arrow on leave from overbought zone , long arrow leave on oversold zone) this ind
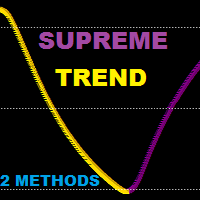
Supreme Trend is a reversal/continuation type Oscillator type indicator that is based on Moving average and stochastic indicators this indicator can be used in two methods : Reversal Method : short when golden arrow appear after arrows were above upper level (e.g 70) Reversal Method : long when Purple arrow appear after arrows were below lower level (e.g 30) Trend Method : long when arrows cross above 50 level line , short when arrows cross below 50 level line. use higher ma and stochastic peri
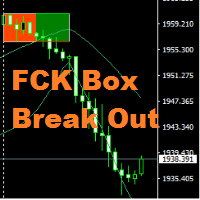
Hi All, " FCK Box Break Out " indicator is very simple indicator for new users. You can choose which indicators and timeframes you want to calculate. "FCK Box Break Out" provides the day's trend for buy/sell trades. Opposite side you the stop loss or hedging trade. NON-REPAINT Buy/Sell signals Recommendations Timeframes: Recommended - H 1 (Still, EA technically works on any Time frames ) Spread : up to 20 Recommended pairs: works on any metal, indices and currency pair

This indicator smoothes the value of CCI (Commodity Channel Index) and reduces its volatility. By using this indicator, the fluctuations created by the CCI indicator are reduced. The smoothed CCI value is placed in a buffer that you can use in your EA and strategy. Leave me a comment if you want By using this indicator, you no longer need to use the Moving Average indicator on the CCI indicator.
FREE
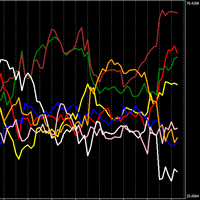
Potente indicador que muestra la fortaleza de la moneda individual.
Cuanto más alto es, más fuerte es la moneda, y viceversa, cuanto más bajo es, más débil es.
Estrategia comercial N1: Abrir posición en los cruces de líneas, si una cruza hacia arriba y la otra hacia abajo, abrir posición en la moneda que está subiendo.
Estrategia comercial N2: posición abierta comprando la moneda más fuerte y vendiendo la moneda más débil.
En la configuración puedes cambiar el marco de tiempo, yo uso el
Supreme Diamond es un indicador de marco de tiempo múltiple basado en una estrategia de negociación de tendencias y reversión, el indicador no se repinta ni se repinta y las señales no se retrasan, el indicador proporciona señales de compra y venta con alerta.
El indicador tiene 2 modos de señal que se pueden elegir entre la entrada (use la mejor entrada como diamantes). Si está configurado en verdadero, el indicador filtrará las señales del modo normal y dará la mejor entrada posible como señ

Supreme Arrow es un indicador de flecha para mt4 que se basa en la estrategia de indicadores rsi y demarker.
La estrategia es adecuada para mercados de tendencia, pero también funciona en mercados variados, especialmente si se utiliza para especular.
Plazo recomendado: cualquiera
Complementos recomendados: 200 SMA
El indicador Supreme Arrow no se repinta ni se repinta y la señal no se retrasa
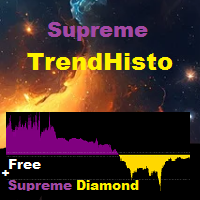
Supreme TrendHisto es un indicador de tendencia que proporciona señales de tendencia hacia arriba y hacia abajo, el indicador actúa como un histograma, el indicador no repinta/pinta de nuevo/retrasa.
Estrategia
Compra de operación: el histograma cruza por encima de 0,65, abrimos la operación de compra, en cuanto a la salida, puede salir cuando el histograma alcance el nivel 0,70 o salir bien.
Operación de venta: el histograma cruza por debajo de -0,65, abrimos la operación de compra, en c

La VELOCIDAD DE TRANSACCIÓN es el indicador de mayor calidad que muestra dónde y cuándo se acumulan grandes órdenes en el mercado y los beneficios de ello. Detecta los cambios de tendencia en una fase muy temprana. Es a la vez un indicador y un sistema de trading. El concepto es único e increíblemente rentable.
En Forex, el volumen de ticks se denomina engañosamente volumen. En realidad, se trata de la variación del precio por unidad de tiempo, que de hecho es la VELOCIDAD DE TRANSACCIÓN. Est
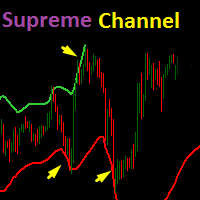
Basado en el indicador del canal TV atr, el indicador Supreme Channel es una banda dinámica de soporte y resistencia que le da al operador una pista sobre una posible reversión en la tendencia actual.
Plazo recomendado: 15 meses y más
Configuración recomendada: Predeterminada, pero el operador puede optar por cambiarla según sea necesario.
Parámetros:
1. Longitud del canal
2.Ancho de banda (la distancia entre las dos líneas del canal)
3.Multiplicador (Multiplicador de valor ATR)
4
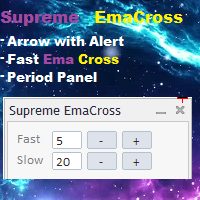
Supreme EmaCross es un indicador basado en dos promedios móviles exponenciales cruzados, genera flechas de compra y venta basadas en el cruce de ema y alerta sobre la apariencia de la señal, el indicador no repinta ni pinta hacia atrás y las flechas no se retrasan, el indicador tiene un rápido Panel de cambio de período de ema donde el operador puede cambiar los valores de ema sin tener que ir a la configuración del indicador, el panel es móvil.
===============================================

Indicador Forex "MACD con tendencia ZigZag" para MT4
El indicador MACD en sí es una de las herramientas más populares para el comercio de tendencias. "MACD con Trend ZigZag" es excelente para usar con entradas de Price Action o en combinación con otros indicadores Utilice este indicador para seleccionar las señales de entrada más precisas: - Si MACD está por encima de 0 (color verde) y la línea ZigZag está hacia arriba - busque solo patrones de acción del precio de compra - Si MACD está por d
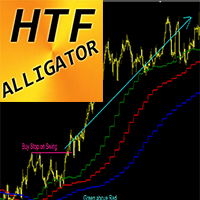
Indicador Forex Alligator Marco de tiempo más alto para MT4
El indicador cocodrilo es uno de los indicadores de tendencia más poderosos. HTF significa - Marco de tiempo más alto Este indicador es excelente para los operadores de tendencias, así como para combinarlo con entradas de acción del precio. El indicador HTF Alligator le permite adjuntar Alligator desde un período de tiempo superior a su gráfico actual. Considere las entradas de compra solo cuando la línea verde esté por encima de la

Trend analysis is perhaps the most important area of technical analysis and is the key to determining the overall direction of an instrument's movement. The Quest Trend indicator determines the prevailing trend. They help analyze the market on a selected time interval. Trends are based on the principle of higher highs, higher lows (for an uptrend) and lower highs, lower lows (for a downtrend). They can have different time periods and they can be related to each other like fractals. For example,

With this tool you can create some useful data in a CSV file.
You can:
- Determine time frame - the number of candles to be loaded - Name the file whatever you want - Select additional data sets to be loaded
The following data is written to a CSV file.
- Time when the candle was created. - Open price - Close price - High price - Low price
The following selection is also available to you:
- Volume - RSI (you can also select the period) - Moving Avarage (you determine the period and m
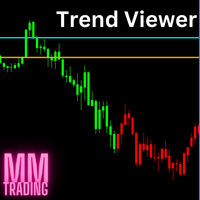
This indicator changes the color of the chart when prices are more bullish or bearish. It is recommended to use this indicator on small timeframes and only during peak trading hours. And don't forget your stop limit. This is not an oracle and not a holy grail.
In the settings, you can change the color of the candles and also their sentiment. To do this, use the Set 1 and Set 2 settings and test.
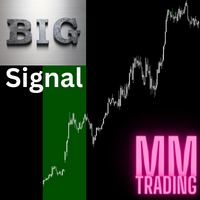
This is a multi-timeframe indicator that collects data from multiple time frames. It tries to identify the trend and predict a pullback. You have to understand that trends emerge suddenly and with that the pullback turns into a new trend. This is not a holy grail, always remember your stoploss. Use this indicator as a complement to your existing strategy.
The lines that are displayed on the chart can be changed so that they are only displayed in the indicator window and are therefore not dist
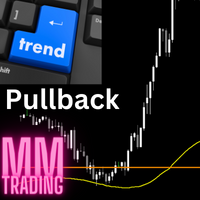
This indicator is not an ordinary moving avarage, even if it behaves similarly. I really like to use this to identify pullbacks. I only use this strategy once a day for one instrument, not more often. It is best if the price is further away from the line in the morning and when the pullback occurs, then you can create an entry setup using this indicator. Use additional indicators or use this as a supplement to your existing strategy.
This is not a holy grail. A pullback can quickly become a t

The indicator is the advanced form of the MetaTrader 4 standard Fibonacci tool. It is unique and very reasonable for serious Fibonacci traders.
Key Features
Drawing of Fibonacci retracement and expansion levels in a few seconds by using hotkeys. Auto adjusting of retracement levels once the market makes new highs/lows. Ability to edit/remove any retracement & expansion levels on chart. Auto snap to exact high and low of bars while plotting on chart. Getting very clear charts even though man

Introducing the Consecutive Green/Red Candle Alert Indicator for MT4 - Your Trend Spotting Companion! Are you ready to take your trading to the next level? We present the Consecutive Green/Red Candle Alert Indicator, a powerful tool designed to help you spot trends and potential reversals with ease. Whether you're a new trader looking for clarity in the market or an experienced pro seeking additional confirmation, this indicator is your trusted companion. Key Features of the Consecutive Green/Re
FREE
El Mercado MetaTrader es la única tienda donde se puede descargar la versión demo de un robot comercial y ponerla a prueba, e incluso optimizarla según los datos históricos.
Lea la descripción y los comentarios de los compradores sobre el producto que le interese, descárguelo directamente al terminal y compruebe cómo testar el robot comercial antes de la compra. Sólo con nosotros podrá hacerse una idea sobre el programa, sin pagar por ello.
Está perdiendo oportunidades comerciales:
- Aplicaciones de trading gratuitas
- 8 000+ señales para copiar
- Noticias económicas para analizar los mercados financieros
Registro
Entrada
Si no tiene cuenta de usuario, regístrese
Para iniciar sesión y usar el sitio web MQL5.com es necesario permitir el uso de Сookies.
Por favor, active este ajuste en su navegador, de lo contrario, no podrá iniciar sesión.