Prodotti pubblicati

Hull Trend Flip identifies the moment the Hull Moving Average changes direction — giving you a clean, visual signal exactly when momentum shifts. The HMA is one of the fastest trend-following moving averages available, minimising lag while remaining smooth. Hull Trend Flip builds on this by splitting the line into two colours — lime when rising, red when falling — and firing an arrow on every confirmed flip , so you never miss a trend change at a glance. Features Hull Moving Average wit
FREE
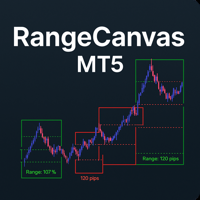
Daily Range Boxes : The indicator draws rectangular boxes around each day's high and low prices, creating a clear visual boundary for the daily trading range. Color-Coded Logic : Green boxes when the current price (or close) is above the daily open Red boxes when the current price is below the daily open Percentage Level Lines : Inside each box, it draws three horizontal lines at: 25% of the daily range 50% of the daily range (midpoint) 75% of the daily range Range Information : Each box displa
FREE
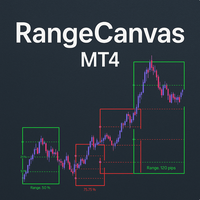
Daily Range Boxes : The indicator draws rectangular boxes around each day's high and low prices, creating a clear visual boundary for the daily trading range. Color-Coded Logic : Green boxes when the current price (or close) is above the daily open Red boxes when the current price is below the daily open Percentage Level Lines : Inside each box, it draws three horizontal lines at: 25% of the daily range 50% of the daily range (midpoint) 75% of the daily range Range Information : Each box displa
FREE

Swift Symbol Switch adds a clean, convenient symbol-switching panel directly to your chart, allowing you to move between Forex pairs, cryptocurrencies, commodities, metals, and other broker-supported instruments with a single click. There is no need to type symbol names, search through Market Watch, or repeatedly open MetaTrader menus. Simply select a symbol from the on-chart panel and the current chart updates instantly. The utility is designed for traders who monitor multiple markets and want
FREE

Multi-TF MA Levels plots a single moving average across multiple timeframes directly on your chart, giving you instant context at every level of the market. No switching charts. No mental maths. Just clean, flat lines showing exactly where the MA sits on M15, M30, H1, H4 and D1 — all updated on confirmed bar close so there is no repainting. Features
Plots the local timeframe MA plus up to 5 higher timeframe MAs simultaneously
HTF lines only update on confirmed bar close — no repainting
Higher ti
FREE

Swift Symbol Switch MT4 adds a clean, convenient symbol-switching panel directly to your chart, allowing you to move between Forex pairs, cryptocurrencies, commodities, metals, and other broker-supported instruments with a single click. There is no need to type symbol names, search through Market Watch, or repeatedly open MetaTrader menus. Simply select a symbol from the on-chart panel and the current chart updates instantly. The utility is designed for traders who monitor multiple markets and w
FREE

Historical Pivot Zones is a clean support and resistance indicator for MetaTrader 4. The indicator automatically draws important price zones from previous market ranges, helping you see where price may react, reject, break out, or continue. Instead of manually marking higher-timeframe levels every day, Historical Pivot Zones gives you a structured map directly on your chart. It is designed for traders who use support and resistance, range levels, market structure, breakouts, pullbacks, and price

Kijun Retest Pro identifies high-probability continuation signals on any instrument and timeframe, marking each opportunity directly on your chart with a clear arrow. Signals are generated when specific market conditions align across multiple internal checks. A cyan appears below the bar for buy signals, a red above the bar for sell signals. Signals never repaint All signals are calculated on fully closed bars only. An arrow that appears will never move or disappear. What you see on historic

Historical Pivot Zones - Fibonacci Indicator MT5 Automatically draws Fibonacci retracement and projection zones based on historical price pivots. This MT5 indicator intelligently selects pivot points from different timeframes (weekly, monthly, or 6-month ranges) and creates visual Fibonacci zones around key levels. Features include: Smart Mode Selection - Auto-adjusts based on your chart timeframe
Clean Visual Zones - Highlighted areas instead of just lines
Essential Fib Levels - 9 retrace

Kijun Retest Pro identifies high-probability continuation signals on any instrument and timeframe, marking each opportunity directly on your chart with a clear arrow. Signals are generated when specific market conditions align across multiple internal checks. A cyan appears below the bar for buy signals, a red above the bar for sell signals. Signals never repaint All signals are calculated on fully closed bars only. An arrow that appears will never move or disappear. What you see on historic