|
10+ anni
esperienza
|
16
prodotti
|
375
versioni demo
|
|
0
lavori
|
0
segnali
|
0
iscritti
|
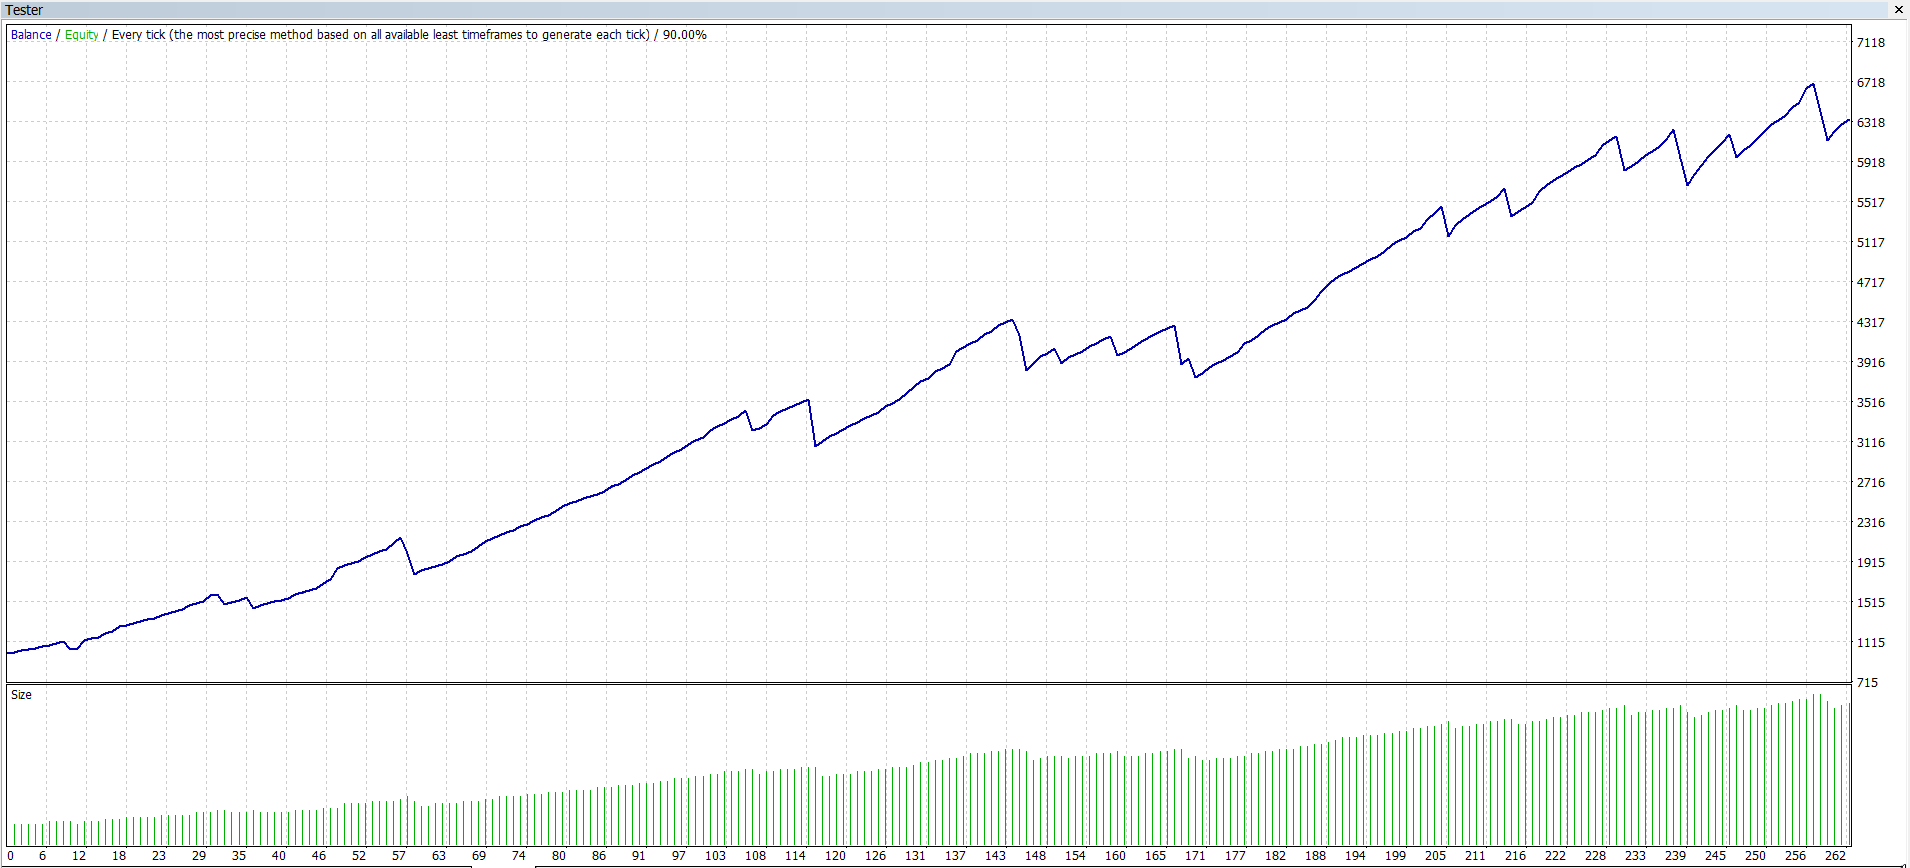
Forex, Commodities, Equities and Indices Trader, Programmer and Developer @ theinvestbay.com