Sangmo Park / Profilo
- Informazioni
|
no
esperienza
|
13
prodotti
|
1
versioni demo
|
|
0
lavori
|
0
segnali
|
0
iscritti
|
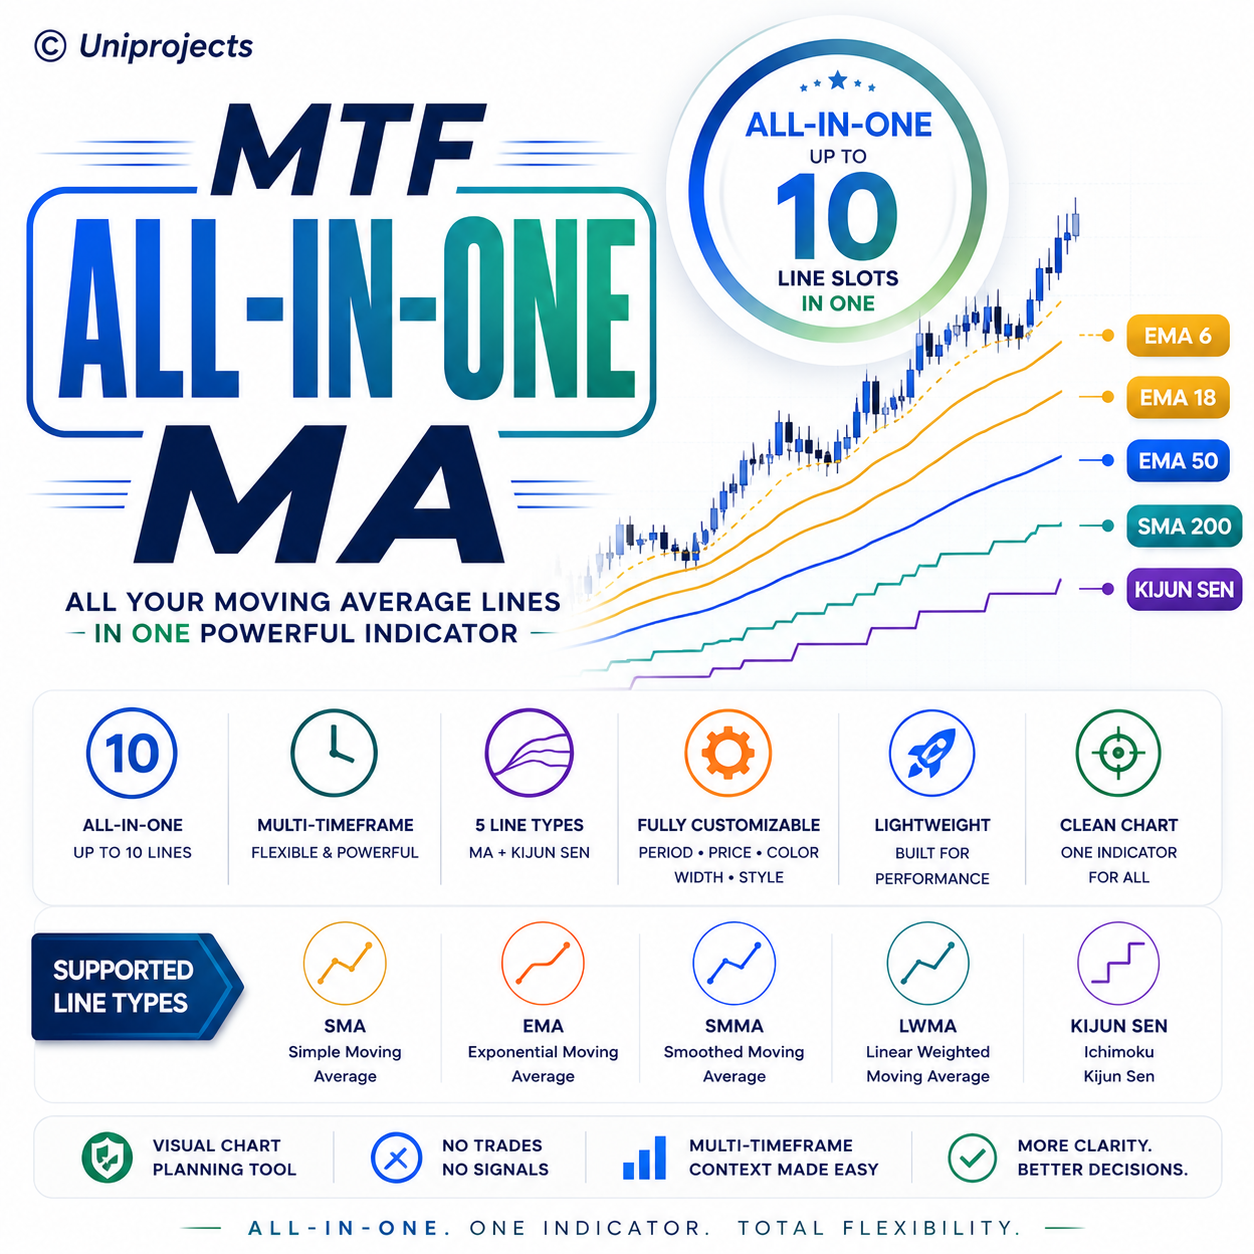
I build MetaTrader 5 tools for manual chart review and workflow clarity: multi-timeframe MA/Kijun context, market structure, currency strength, supply/demand levels, session zones, pivots/CPR, and trade-review utilities.
The focus is clean visual context, practical setup, and responsive support for traders who want a more organized MT5 workspace.
These products are chart-planning and review tools only. They do not execute trades, provide guaranteed results, or replace risk management.
Aggiungi amici tramite il loro profilo o la ricerca utente e sarai in grado di vedere se sono online
R-multiple is useful because it makes trades easier to compare.
If one trade risked 20 USD and another risked 200 USD, the dollar result alone can hide whether the setup was managed well. Reviewing results in R keeps the focus closer to process, stop placement, target planning, and consistency.
No tool can make those decisions automatically for every trader. The goal is cleaner review and better visibility.
It is designed for users who want multiple moving-average and Kijun Sen reference lines in one indicator instead of attaching several separate indicators.
Main points:
- Up to 10 independent line slots
- SMA, EMA, SMMA, LWMA, and Kijun Sen
- Per-line timeframe, period, color, width, and style
- Standard Apply To price selection for MA lines
- Max Bars To Draw input to keep chart loading bounded
This is a visual chart-planning utility only. It does not place trades, send trade signals, manage positions, or guarantee trading results.
Product page:
https://www.mql5.com/en/market/product/178795?source=Site+Profile+Seller
(c) Uniprojects MTF All-In-One MA is a lightweight MetaTrader 5 indicator for traders who want multiple moving average and Kijun Sen lines in one clean chart overlay. Instead of attaching several separate indicators, you can control up to 10 independent line slots from one settings panel. Supported line types: - Simple Moving Average (SMA) - Exponential Moving Average (EMA) - Smoothed Moving Average (SMMA) - Linear Weighted Moving Average (LWMA) - Kijun Sen Each line supports: - Enable/disable
This indicator draws weekly CPR levels: TC, Pivot, and BC, plus classic weekly R1-R3 and S1-S3 levels. It also includes optional previous-week high, low, and midpoint levels for cleaner weekly chart context.
All levels are calculated from the previous completed weekly candle, so the current week stays consistent while traders plan around the same weekly reference structure.
This is a visual planning tool only. It does not place trades, send trade signals, or guarantee trading results.
Product page:
https://www.mql5.com/en/market/product/178743
(c) Uniprojects Weekly Pivot Custom Weekly Pivot Custom is a lightweight MetaTrader 5 indicator that plots weekly CPR, classic weekly pivot levels, and optional previous-week range levels directly on the chart. The indicator is designed for traders who use higher-timeframe weekly structure as part of daily or intraday planning. It calculates the current week levels from the previous weekly candle and can also draw a bounded number of historical weekly levels for review. What It Draws - TC: Top
Daily Pivot Levels is the free Lite version of the Daily CPR toolset for MetaTrader 5. It plots the current day's Central Pivot Range from the previous completed daily candle: - TC: Top Central Pivot - P: Pivot - BC: Bottom Central Pivot The goal is simple daily context. Intraday traders can keep the current CPR zone visible on M5, M15, M30, H1, or higher charts without manually drawing the levels each day. Main uses: - Mark the current day's CPR zone. - Add daily context to intraday charts. -
https://www.mql5.com/en/market/product/178488
Daily CPR Custom is a lightweight MT5 indicator that plots the daily Central Pivot Range and classic daily pivot support/resistance levels directly on the chart.
It draws:
- TC: Top Central Pivot
- P: Main Pivot
- BC: Bottom Central Pivot
- R1, R2, R3: Daily resistance levels
- S1, S2, S3: Daily support levels
Main features:
- Daily CPR levels
- Classic daily pivot levels
- Optional labels
- Customizable colors, styles, and widths
- Optional custom session start time
- Current-day-only display option
- Configurable historical days to draw
- New-bar recalculation instead of tick-by-tick redraw
- Indicator only: no automatic trading and no trade execution
Suggested use:
Apply it to intraday charts such as M5, M15, M30, or H1 to keep daily pivot structure visible while reviewing lower-timeframe price action.
Important note:
This is a charting and analysis tool. It does not generate guaranteed signals, does not trade automatically, and does not guarantee trading results.
Daily CPR Custom is the Pro version of the Daily CPR toolset for MetaTrader 5. It plots the daily Central Pivot Range plus classic daily pivot support and resistance levels directly on the chart. The levels are calculated from the previous completed daily candle, so intraday traders can map the daily structure before planning trades. What it draws: - TC: Top Central Pivot - P: Pivot - BC: Bottom Central Pivot - R1, R2, R3: daily resistance levels - S1, S2, S3: daily support levels Why traders
This indicator draws clear session zones and time labels for Sydney, Tokyo, Frankfurt, London, and New York so traders can quickly see how price behaved during each session.
Features include:
- Adjustable session times
- UTC or broker time reference
- Session high/low lines
- Optional open/close lines
- Optional session open and close alerts
- Custom colors and label settings
Free download:
https://www.mql5.com/en/market/product/178040?source=Site+Profile+Seller
Trading Session Zones Alert is a free visual session indicator for MetaTrader 5. It highlights the major trading sessions directly on the chart so traders can quickly see how price moved during each session and where session ranges overlap. The indicator draws clear session zones and time labels for: - Sydney - Tokyo - Frankfurt - London - New York Each session can display its own colored zone, label, and optional high/low lines. The session labels show the active time window on the chart
It is built around the idea of watching higher-timeframe supply/demand strongest lines, then alerting when the execution chart prints a rejection or reversal candle pattern at that level.
Main features:
Auto MTF combinations: M5-H4, H1-D1, H4-W1
Higher-timeframe supply/demand zones
Strongest support/resistance line inside each zone
One-candle, doji, two-candle, three-candle, and engulfing reversal patterns
Popup, push, email, and sound alerts
Optional confirmation and signal filters
Recommended use:
H1 with D1 zones/lines, or H4 with W1 zones/lines. M5 with H4 is supported, but lower timeframes naturally have more noise.
Trading note: this is a decision-support and alert tool only. No signal is guaranteed. Use it with trend bias, market structure, and proper risk-to-reward planning.
Product link:
https://www.mql5.com/en/market/product/178032?source=Site+Profile+Seller
It plots strength lines for EUR, USD, GBP, JPY, AUD, NZD, CAD, and CHF using averaged percentage movement across the 28 major FX crosses.
Main features:
Multi-timeframe strength calculation
8 major currency strength lines
Right-side currency labels
Base and quote strength cross alerts
Popup, push, email, and sound alerts
Broker prefix/suffix support
Chart-pair-only speed mode for multi-chart use
Product page:
https://www.mql5.com/en/market/product/177856?source=Site+Profile+Seller
This is a visual analysis and alert tool only. It does not place trades or guarantee results.
MTF Currency Strength Lines Alert MTF Currency Strength Lines Alert is a multi-timeframe currency strength indicator for MetaTrader 5. It plots currency strength lines for the eight major currencies: EUR, USD, GBP, JPY, AUD, NZD, CAD, and CHF. The indicator uses averaged percentage movement from the 28 major FX crosses to create a clean strength view in a separate indicator window. It is designed to help traders compare currency strength, monitor base-versus-quote movement, and receive alerts
This premium MT5 indicator is built for traders who use multi-timeframe market structure. It draws selected-timeframe structure references on the execution chart and colors candles when structure conditions are confirmed.
New in v1.30:
Confirmation mode: execution-chart close or selected-timeframe candle close
BOS classification for continuation
CHOCH/MSS classification for possible trend change
Neutral/range candle color
Optional continuation BOS arrows and alerts
Alert startup guard
Multi-timeframe performance cleanup
Product page:
https://www.mql5.com/en/market/product/176607
Visual reference only. It does not open, manage, or close trades.
It is designed for traders who execute on a lower timeframe while using higher-timeframe supply and demand zones. The indicator draws zones from the selected timeframe and highlights the strongest support or resistance line inside each zone based on wick touches.
Common use examples:
M5 execution chart using H4 zones
H1 execution chart using D1 zones
H4 execution chart using W1 zones
Main features:
Multi-timeframe zone calculation
Strongest support/resistance line inside each zone
Closed-candle touch alerts
Popup, push, email, and sound alert options
Adjustable lookback, pivot strength, ATR zone width, touches, and maximum zones
Custom zone colors, line styles, labels, and right-side extension
Product page:
https://www.mql5.com/en/market/product/177833
This indicator is a visual decision-support tool. It does not open, manage, or close trades.
MTF Supply Demand Strongest Lines Alert is a MetaTrader 5 indicator for traders who want higher-timeframe supply/demand context on a cleaner execution chart. The indicator draws supply and demand zones from a selected higher timeframe and marks the strongest support or resistance line inside each zone. The strongest line is based on the price area with the most wick touches from the selected timeframe candles. Example workflows: - M5 chart with H4 supply/demand zones - H1 chart with D1 zones -
MTF MA Slope Color Candles Alert
This indicator colors candles from moving-average slope state rather than only showing whether price is above or below the MA.
It separates the market into:
- rising MA
- falling MA
- flat or non-trending MA
Each state keeps bullish and bearish candles visually distinct, giving 6 candle colors in total.
Main features:
- Multi-timeframe MA source
- 6-color candle system
- Optional moving-average line display
- Optional slope-change alerts
- Adjustable MA period and method
The default 40-period Simple Moving Average is used as the recommended starting setting for slope-style trading. It is best used together with other market context tools such as support and resistance, pivot ranges, or a 200 SMA.
Product link:
https://www.mql5.com/en/market/product/177489?source=Site+Profile+Seller
MTF MA Slope Color Candles Alert is a multi-timeframe moving-average slope indicator that colors candles according to the direction of the selected moving average. Instead of using only price position above or below the moving average, the indicator separates market behavior into three slope states: - rising moving average - falling moving average - flat or non-trending moving average Each slope state keeps bullish and bearish candles visually distinct, giving six candle colors in total: - flat
This indicator colors candles using Kijun-sen as the reference line while keeping bullish and bearish candles visually distinct above and below Kijun.
Main features:
- Multi-timeframe Kijun reference
- Four selectable candle colors
- Separate colors for bullish and bearish candles above Kijun
- Separate colors for bullish and bearish candles below Kijun
- Optional color-change alerts
- Clean overlay with optional hidden base chart
Designed as a visual Kijun reference tool for traders who want clearer trend context directly on the chart.
Product page:
https://www.mql5.com/en/market/product/177459?source=Site+Profile+Seller


