EUR/USD Intra-Day - 'given the current inflation data, we will probably have to live with the low interest rate until further notice' (based on the article ) H4 price is above Ichimoku cloud for the
GBP/JPY Intra-Day Technical Analysis: bullish with 143.14 key resistance level (based on the article ) H4 price is on bullish market condition located above Ichimoku cloud. The price is on testing
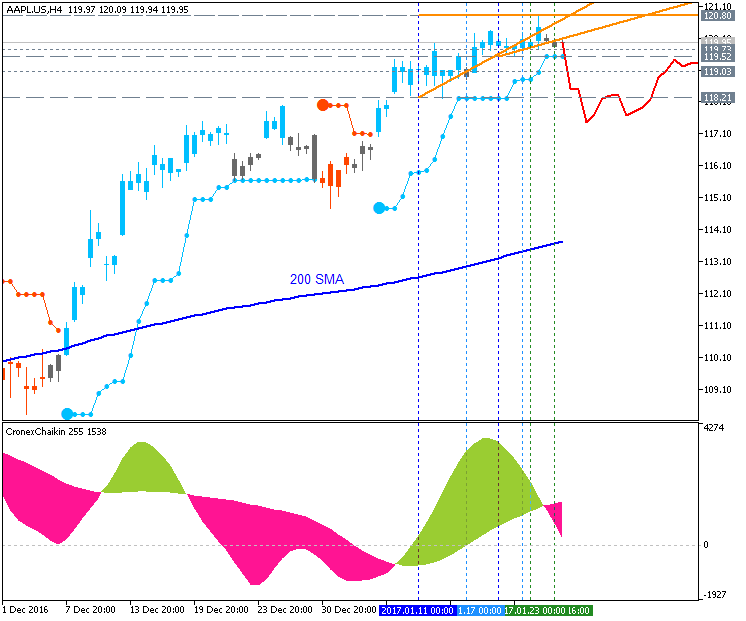
AAPL Intra-Day Technical AnalysisL bullish ranging within 120/121 - 118 levels waiting for direction of the strong trend to be started (based on the article ) Intra-day shares price is located far
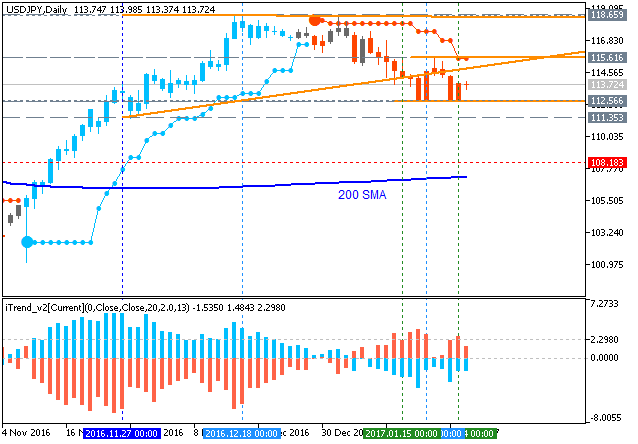
USD/JPY - daily ranging in the bullish area; bearish reversal support at 108.18 is the key (based on the article ) Daily price is on bullish ranging condition located above 200 SMA with 112.56 support
MetaTrader 5 - More Than You Can Imagine! This is the fundamental article for the people who do not have time to read many articles. So, it is everything described (or by the links to the other
AUD/USD Intra-Day Fundamentals: Australian Consumer Price Index and 57 pips range price movement 2017-01-25 00:30 GMT | [AUD - CPI] past data is 0.7%, forecast data is 0.7%, actual data is 0.5%
EUR/USD Intra-Day Fundamentals: U.S. Home Resales and 14 pips range price movement 2017-01-24 15:00 GMT | [USD - Existing Home Sales] past data is 5.65M, forecast data is 5.54M, actual data is 5.49M
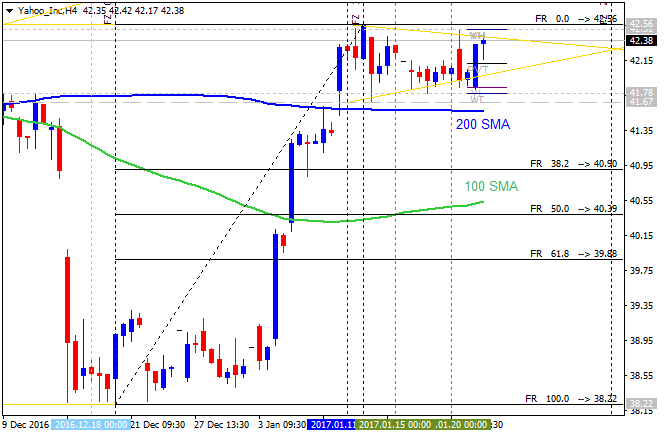
Yahoo Shares Move Slightly Higher (based on the article ) Yahoo shares price is locatedfar above 100 SMA with near and above 200 SMA in the bullish area of the chart. The price is testing 42.56
EUR/USD with New 2017 Highs (based on the article ) H4 price is on testing 1.0771 resistance level to above for the intra-day bullish trend to be continuing. The price is located above 200 SMA in the
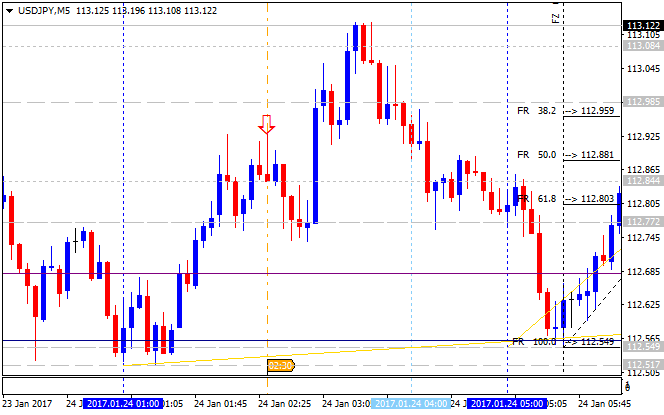
Intra-Day Fundamentals - USD/JPY and Nikkei 225 Index: Nikkei Manufacturing PMI 2017-01-24 00:30 GMT | [JPY - Flash Manufacturing PMI] past data is 52.4, forecast data is 52.3, actual data is 52.8
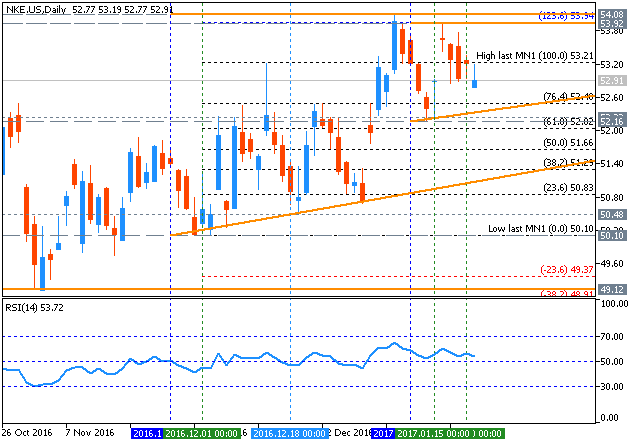
How To Trade Nike (NKE) In 2017 (based on the article ) " The Dow Jones Industrial Average is up just 0.3% year-to-date. Bucking the sideways-to-down trend are gains between 3.6% and 6.2% for Apple
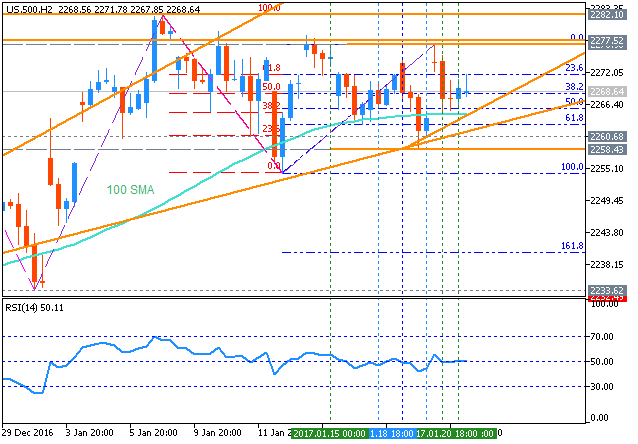
S&P 500 Intra-Day Technical Analysis: ranging for the bullish to be resumed or for the correction to be started (based on the article ) H2 price is lated far above 200 SMA with near and above 100 SMA
Alibaba: daily ranging near bullish reversal level (adapted from the article ) Alibaba share daily price is located inside Ichimoku cloud with the testing Senkou Span line at 97.90 for the bullish
Algorithmic and High-Frequency Trading (Mathematics, Finance and Risk) by Álvaro Cartea (Author), Sebastian Jaimungal (Author), José Penalva (Author) The design of trading algorithms requires
THE EASY WAY TO EVALUATE A SIGNAL: TRADING ACTIVITY, DRAWDOWN/LOAD AND MFE/MAE DISTRIBUTION CHARTS Subscribers often search for an appropriate signal by analyzing the total growth on the signal
Weekly Fundamental Forecast for Brent Crude Oil (based on the article ) Brent Crude Oil - "From a longer-term fundamental perspective, there is a traditional focus on commodities as an inflation
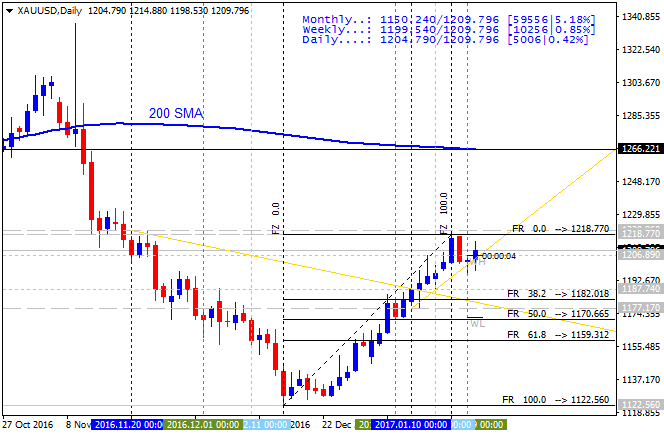
Weekly Fundamental Forecast for GOLD (XAU/USD) (based on the article ) GOLD (XAU/USD) - "Heading into next week, traders will be closely eyeing the release of US 4Q GDP figures on Friday. Consensus