|
6+ anni
esperienza
|
27
prodotti
|
287
versioni demo
|
|
0
lavori
|
0
segnali
|
0
iscritti
|
Eliminate guesswork and build a sustainable, rule-based edge in global financial markets through mathematical, systemic, and algorithmic approaches.
What We Cover:
📊 Daily Market Prep: Pre-market analysis before London/NY sessions (S&P 500, Nasdaq, Gold, Forex).
💻 Algorithmic Trading: Practical Pine Script & MQL development, optimization, and backtesting.
🔄 Live Trading: Real-time execution showing how systemic indicators perform under true market conditions.
Instruments We Focus On:
Global Indices, US & Global Stocks, Commodities, FX Currencies, Gold, and Crude Oil.
Subscribe to master the charts and automate your trading ideas.
Our You Tube Channel: https://www.youtube.com/@traderstimestv
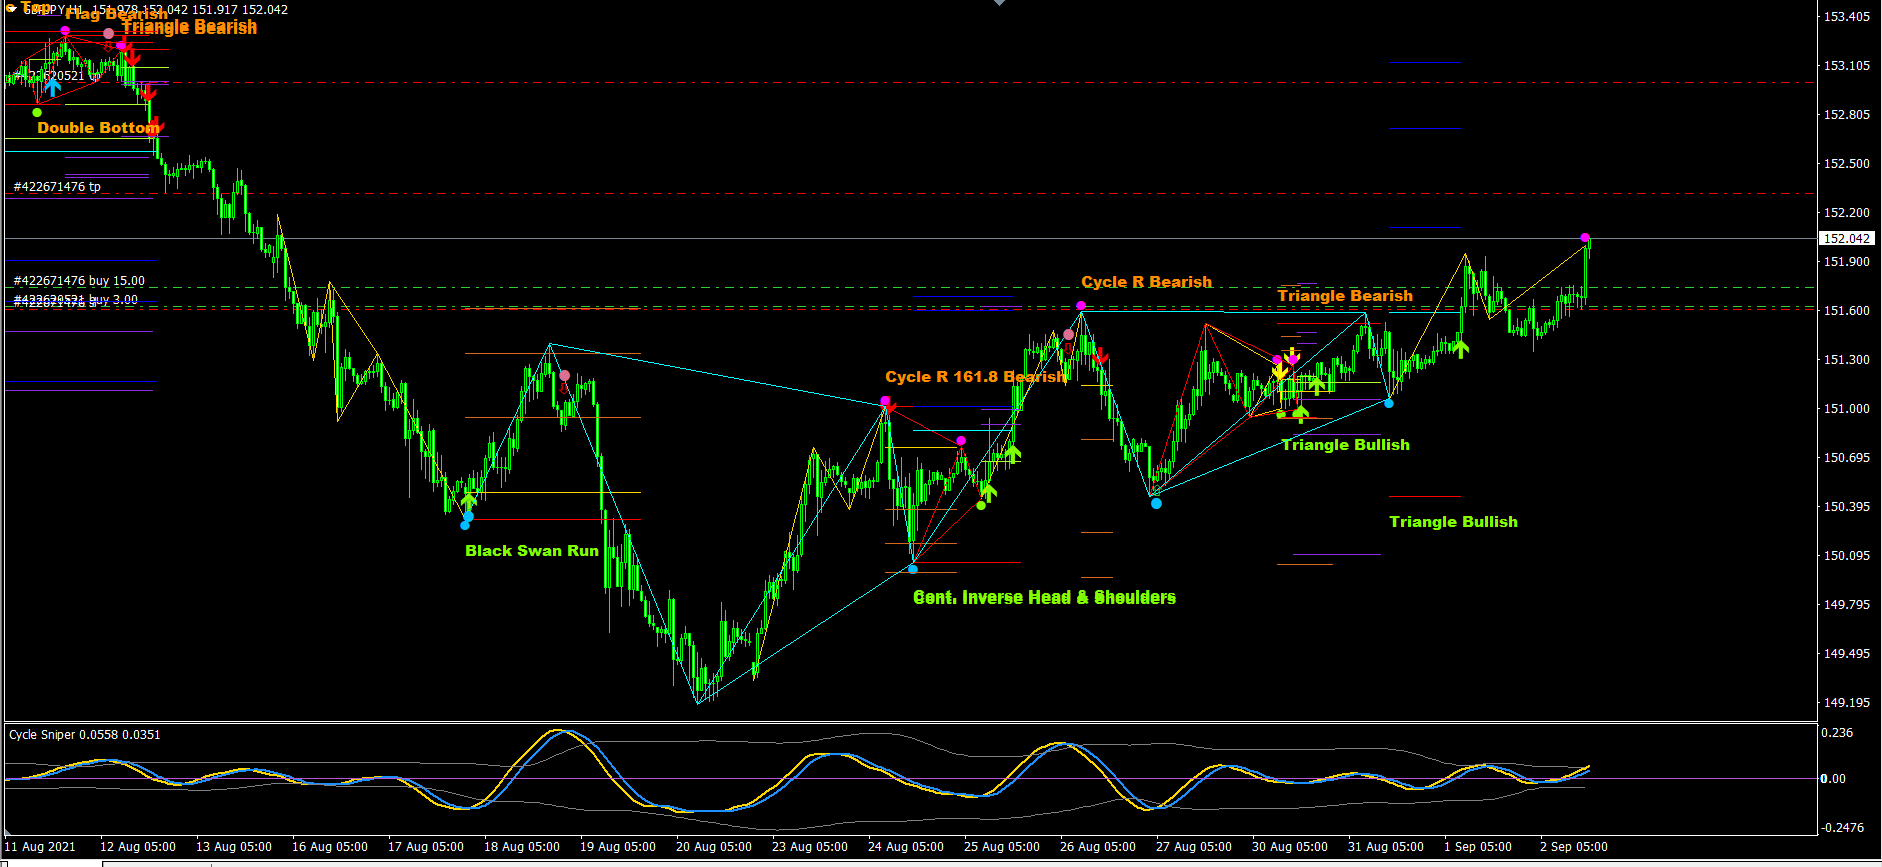
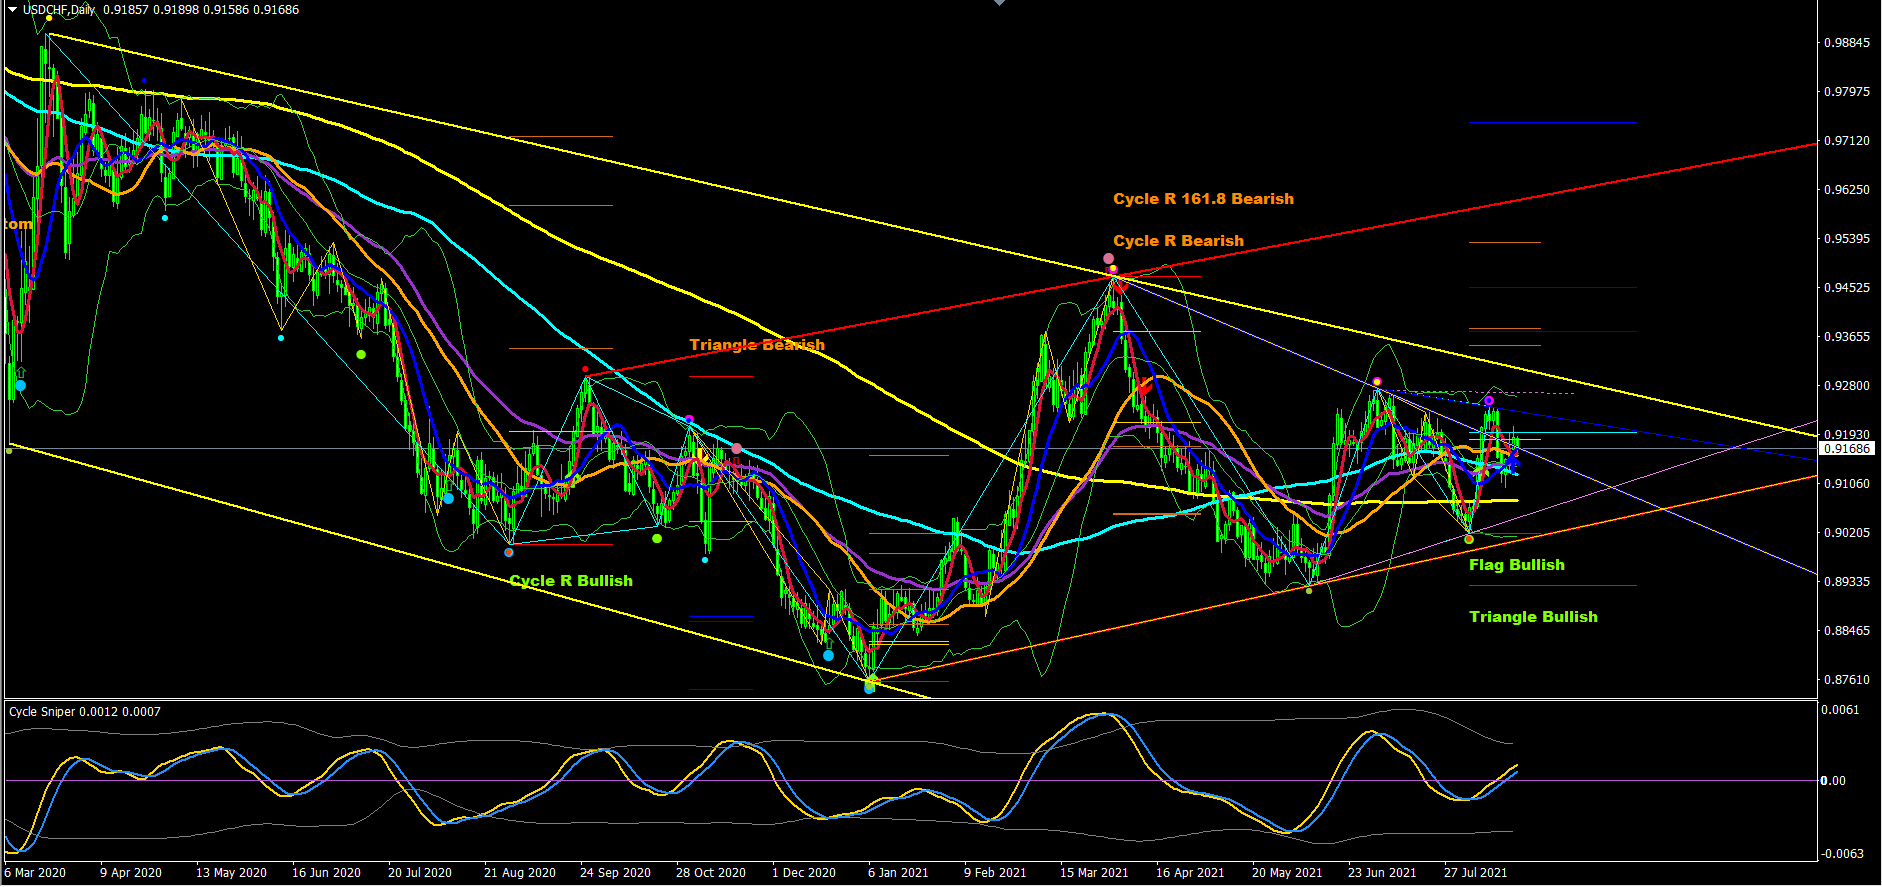
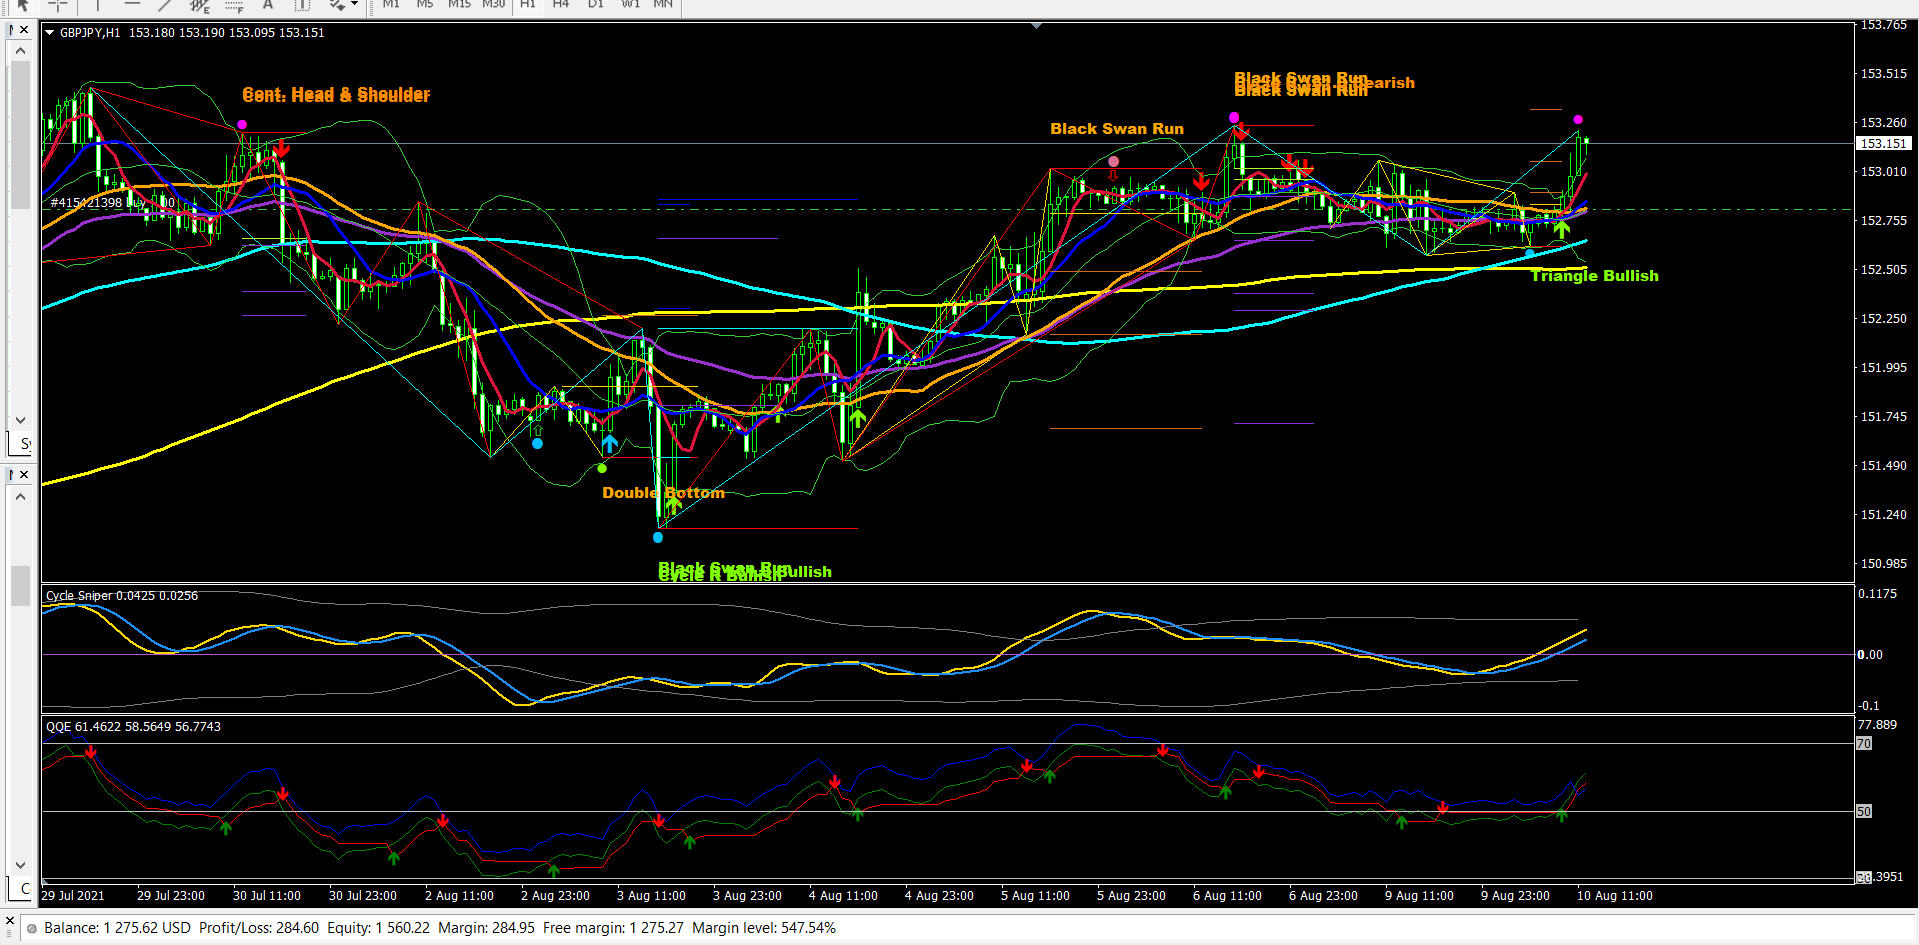
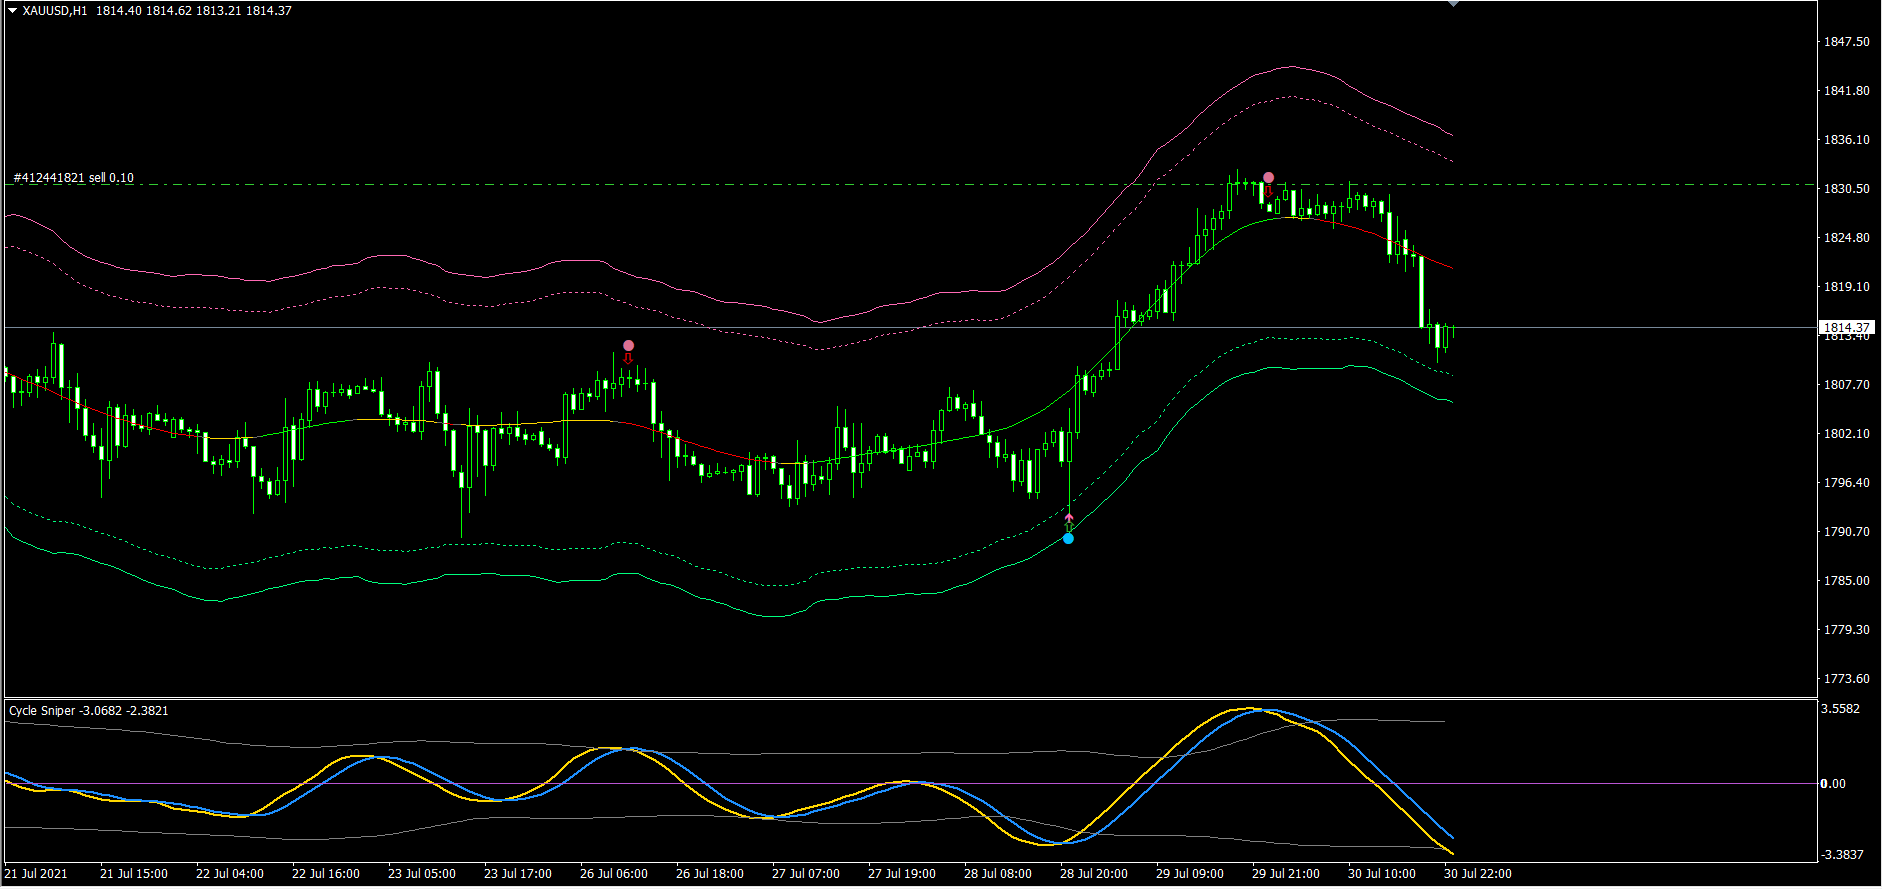
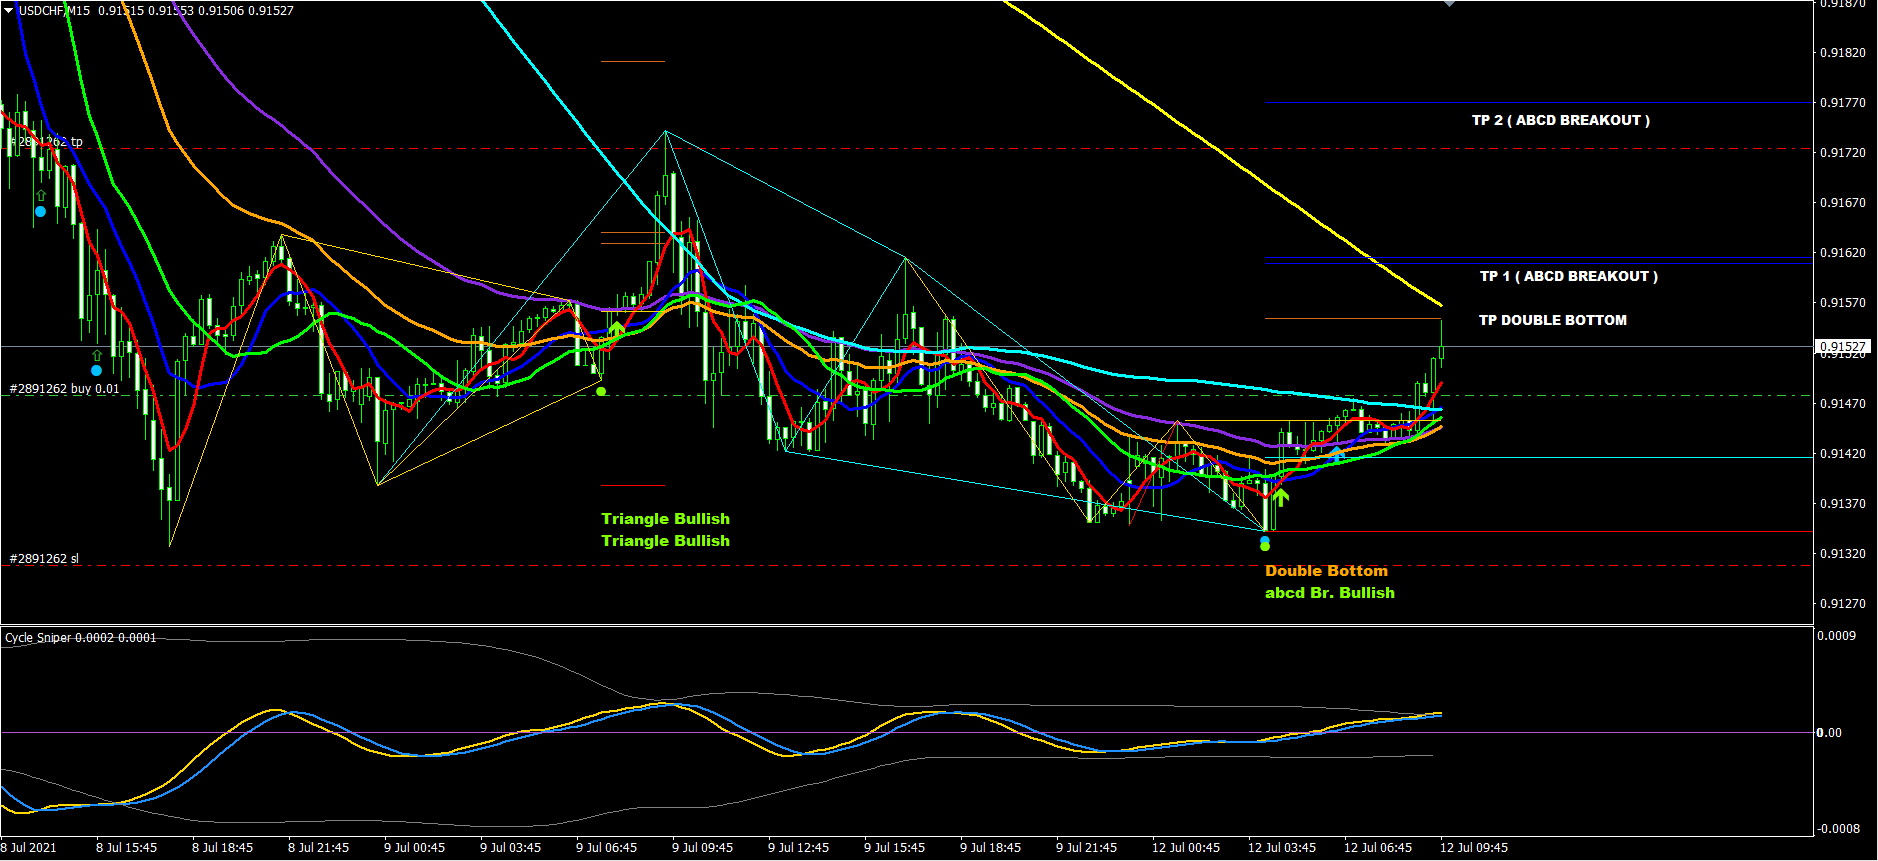
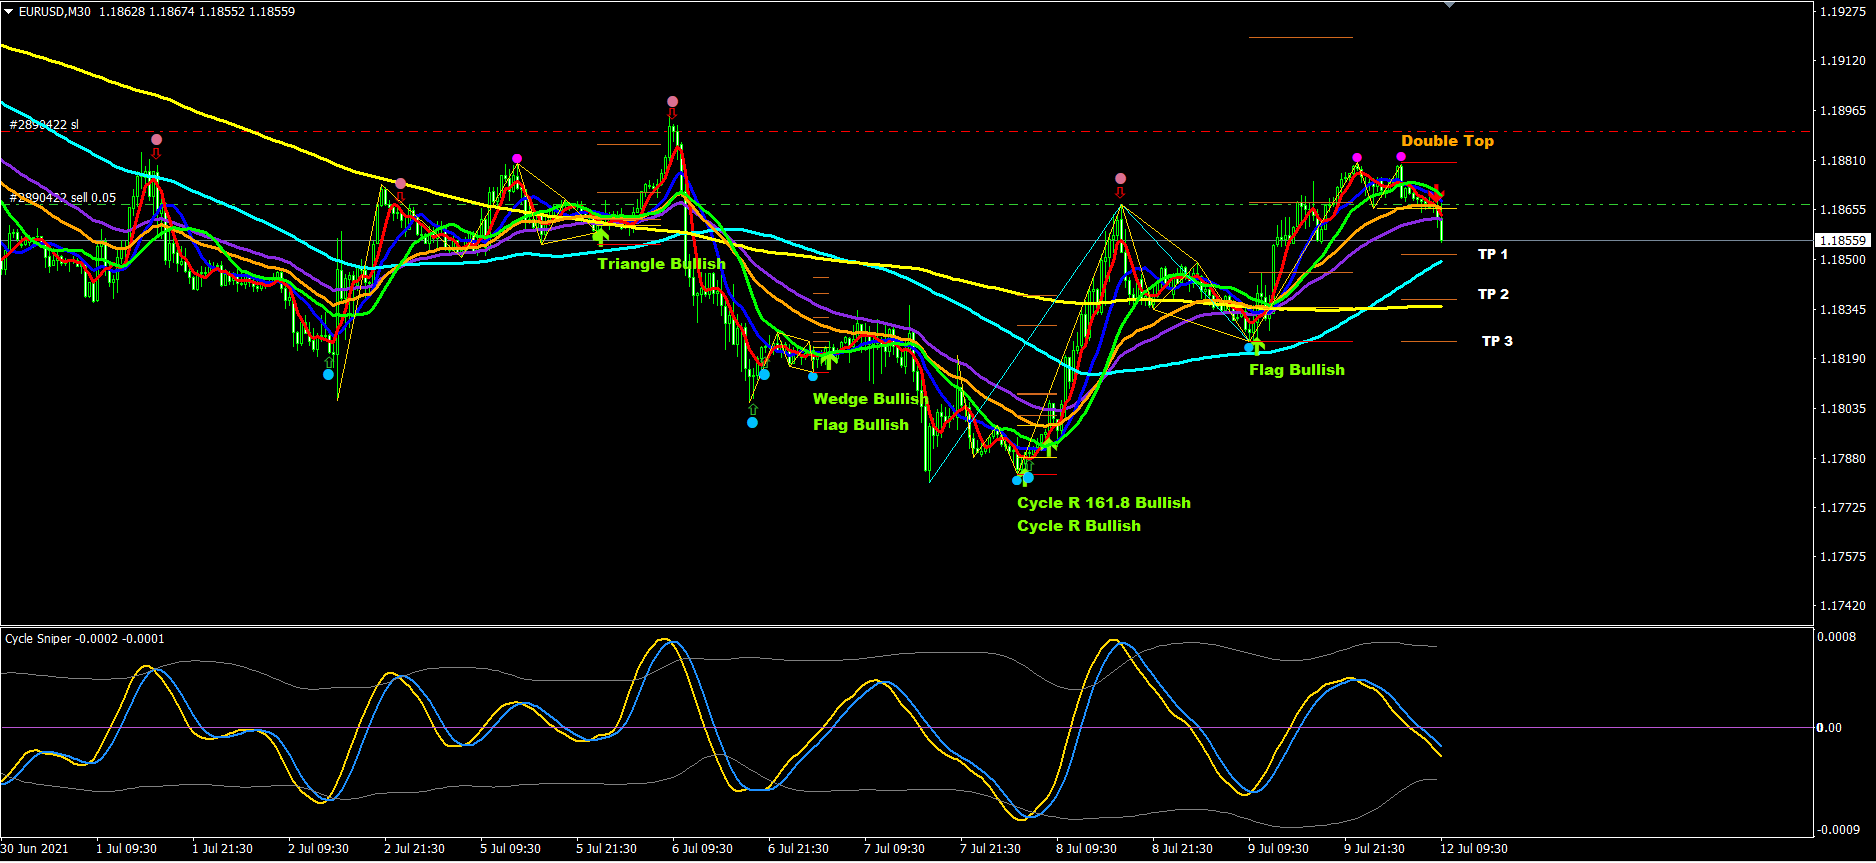
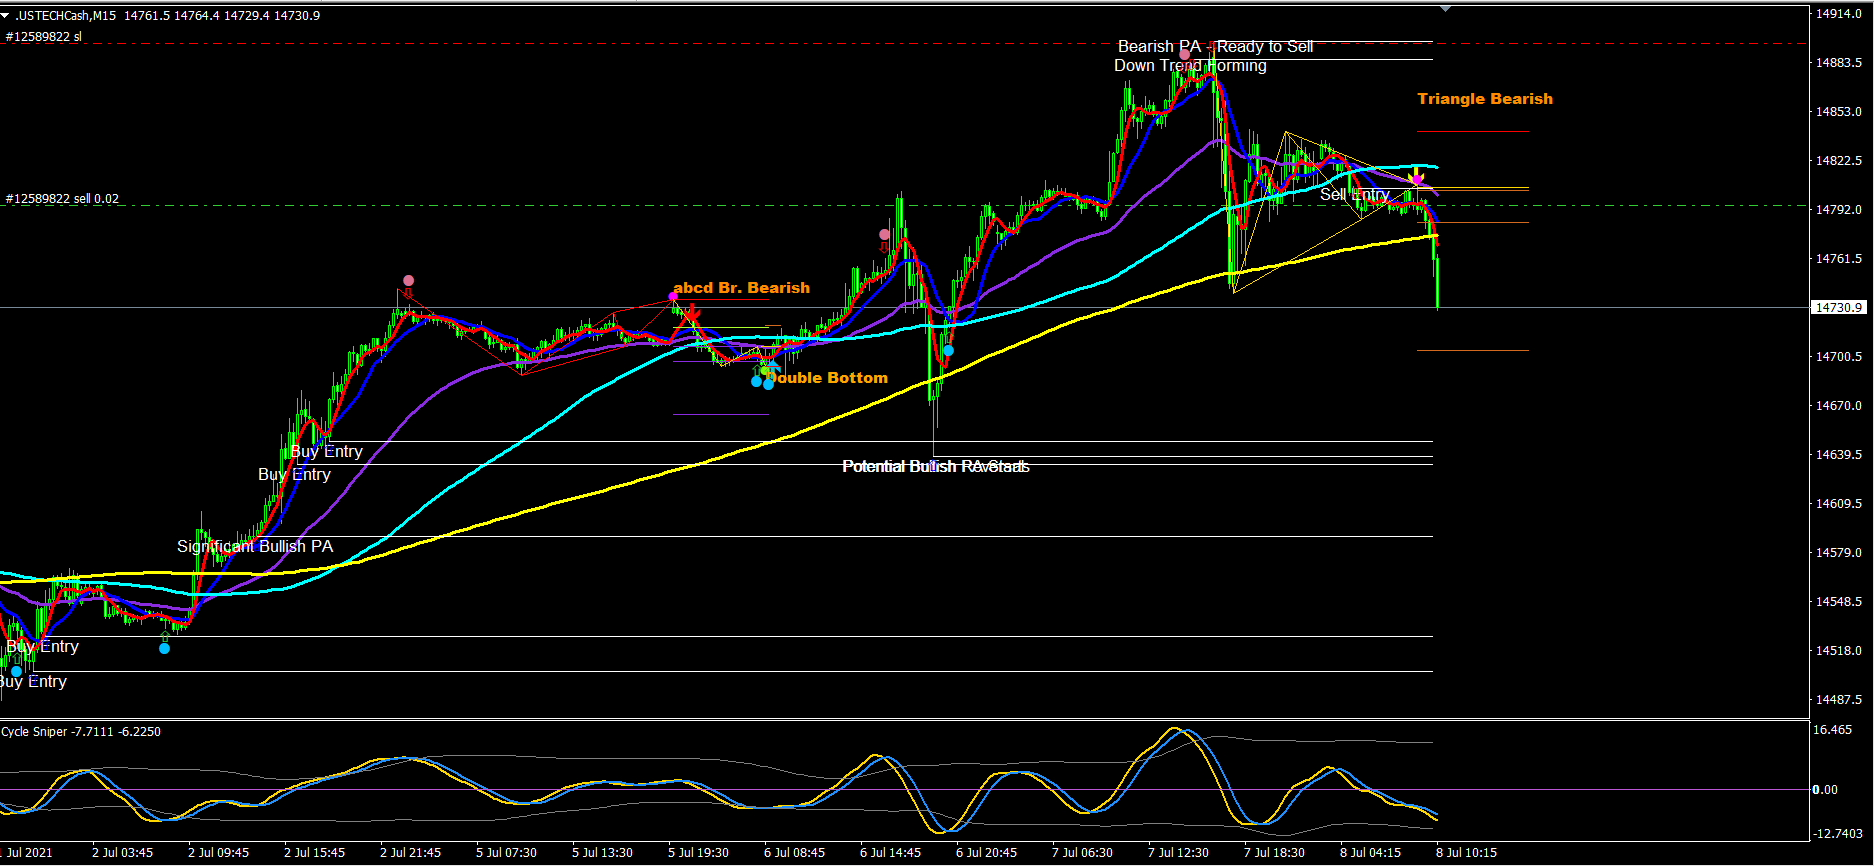
🎯 Our Best Selling MT4 Indicator (Cycle Sniper): https://bit.ly/3VkZlMM
📧 Contact: [ itradeandwin@gmail.com ]
Twitter: https://twitter.com/itradeandwin
Disclaimer: Educational purposes only. Not financial advice.
What We Cover:
📊 Daily Market Prep: Pre-market analysis before London/NY sessions (S&P 500, Nasdaq, Gold, Forex).
💻 Algorithmic Trading: Practical Pine Script & MQL development, optimization, and backtesting.
🔄 Live Trading: Real-time execution showing how systemic indicators perform under true market conditions.
Instruments We Focus On:
Global Indices, US & Global Stocks, Commodities, FX Currencies, Gold, and Crude Oil.
Subscribe to master the charts and automate your trading ideas.
Our You Tube Channel: https://www.youtube.com/@traderstimestv
🎯 Our Best Selling MT4 Indicator (Cycle Sniper): https://bit.ly/3VkZlMM
📧 Contact: [ itradeandwin@gmail.com ]
Twitter: https://twitter.com/itradeandwin
Disclaimer: Educational purposes only. Not financial advice.