Thomas Tiozzo / Venditore
Prodotti pubblicati

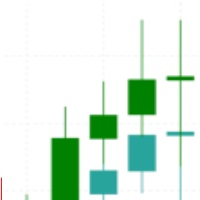
Are you tired of the uncertainty that arises when your orders fail to stop at a specific line due to the spread? Look no further! Introducing our indicator that plots candlesticks based on the Ask price instead of the traditional bid-based chart commonly used in MQL4. With this indicator, you can say goodbye to the frustrations caused by the bid-based chart, as it provides you with a more accurate representation of market movements. By utilizing the Ask price, which represents the price at whic

Vi presentiamo l'indicatore Donchian Channels per MQL4, uno strumento potente di analisi tecnica progettato per aumentare il successo delle vostre operazioni. Questo indicatore è composto da quattro linee che rappresentano i limiti superiori e inferiori del movimento dei prezzi in un periodo specificato. Con l'indicatore Donchian Channels potete facilmente individuare potenziali rotture e inversioni di tendenza sul mercato. La linea superiore mostra il massimo più alto del periodo specificato, m

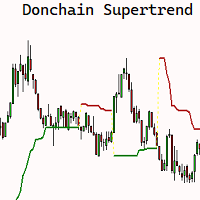
L'indicatore SuperChannel per MQL4 è un POTENTE strumento di ANALISI TECNICA progettato per aiutarti a prendere decisioni di trading informate. Basato sulla popolare TECNOLOGIA di indicatore SUPERTREND, questo indicatore offre un approccio UNICO Utilizzando MASSIMI e MINIMI a n periodi invece dell'Average True Range (ATR) per costruire la linea. L'indicatore SuperChannel ti consente di identificare facilmente le tendenze del mercato e di individuare i punti di ingresso e di uscita ottimali per l

quante volte è il range della candela proporzionato all'atr?
QUESTO è L'INDICATORE DI CUI AVEVI BISOGNO!!!
ti aiuterà a capire meglio il mercato con informazioni utili. fammi sapere nei commenti se ti piace l'indicatore e fammi sapere se ci sono migliorie che posso applicare, sarò felice di apportarle!
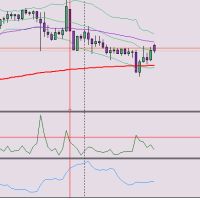
l'indicatore restituisce un rapporto tra RANGE e ATR.

**** SPECIAL GIFT **** Since this is my first strategy sold here, i want to give it for a special price for the first 100 buyers :) **** SPECIAL GIFT ****
https://www.instagram.com/reel/DHZE3P1IBED/ <-- here a live bt of my best backtest with this strategy, i bet you can beat me :D a unique strategy based on candlestick patterns and Bollinger Bands to identify and execute trading opportunities. It aims to capitalize on market momentum by analyzing the 'weight' or strength of candlesticks, com

Are you tired of the uncertainty that arises when your orders fail to stop at a specific line due to the spread? Look no further! Introducing our indicator that plots candlesticks based on the Ask price instead of the traditional bid-based chart commonly used in MQL4. With this indicator, you can say goodbye to the frustrations caused by the bid-based chart, as it provides you with a more accurate representation of market movements. By utilizing the Ask price, which represents the price at whic