Ivan Stefanov / Profil
- Informations
|
8+ années
expérience
|
23
produits
|
74
versions de démo
|
|
0
offres d’emploi
|
0
signaux
|
0
les abonnés
|
Ivan Stefanov
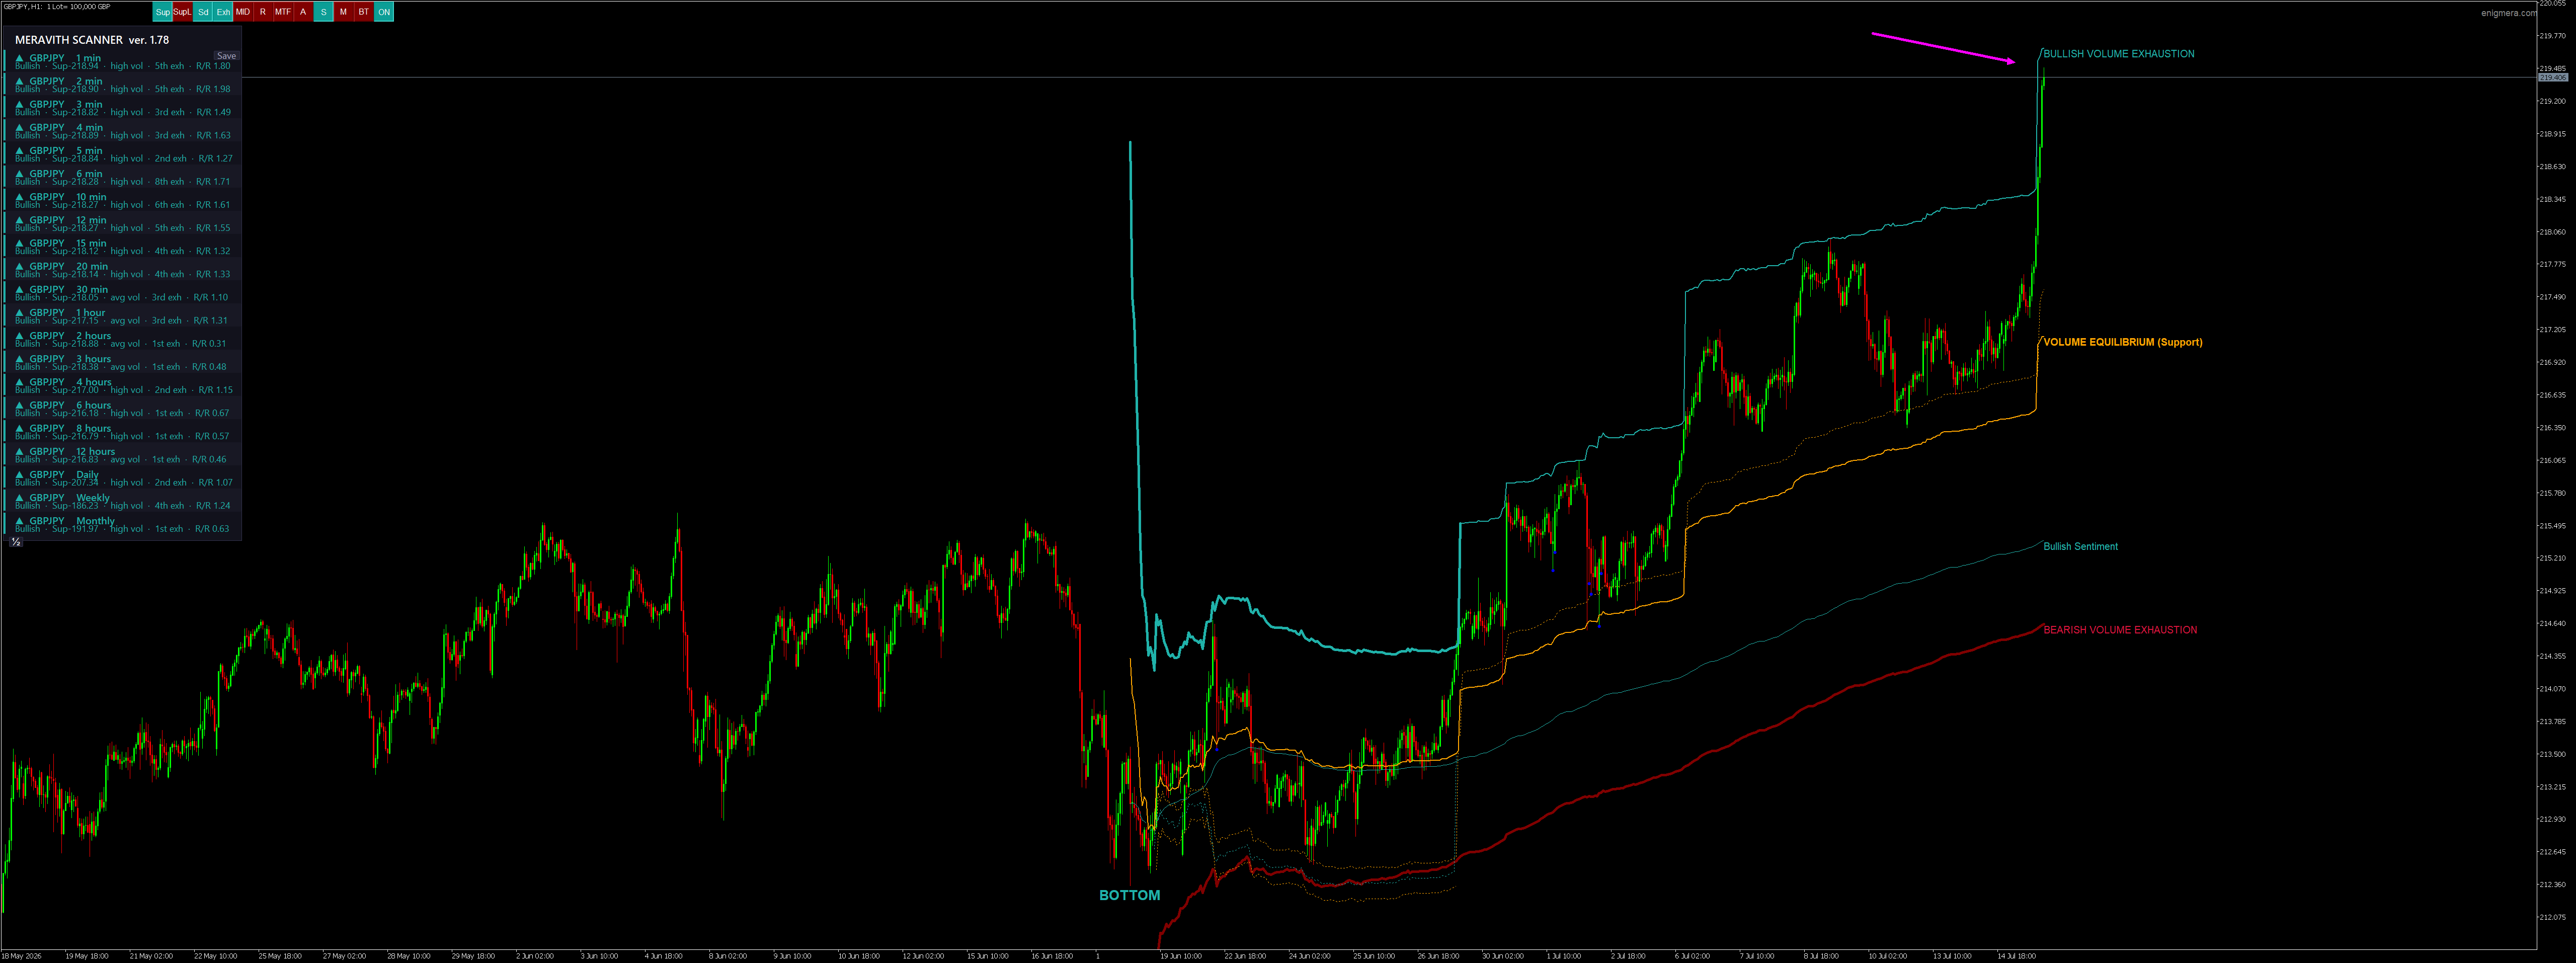
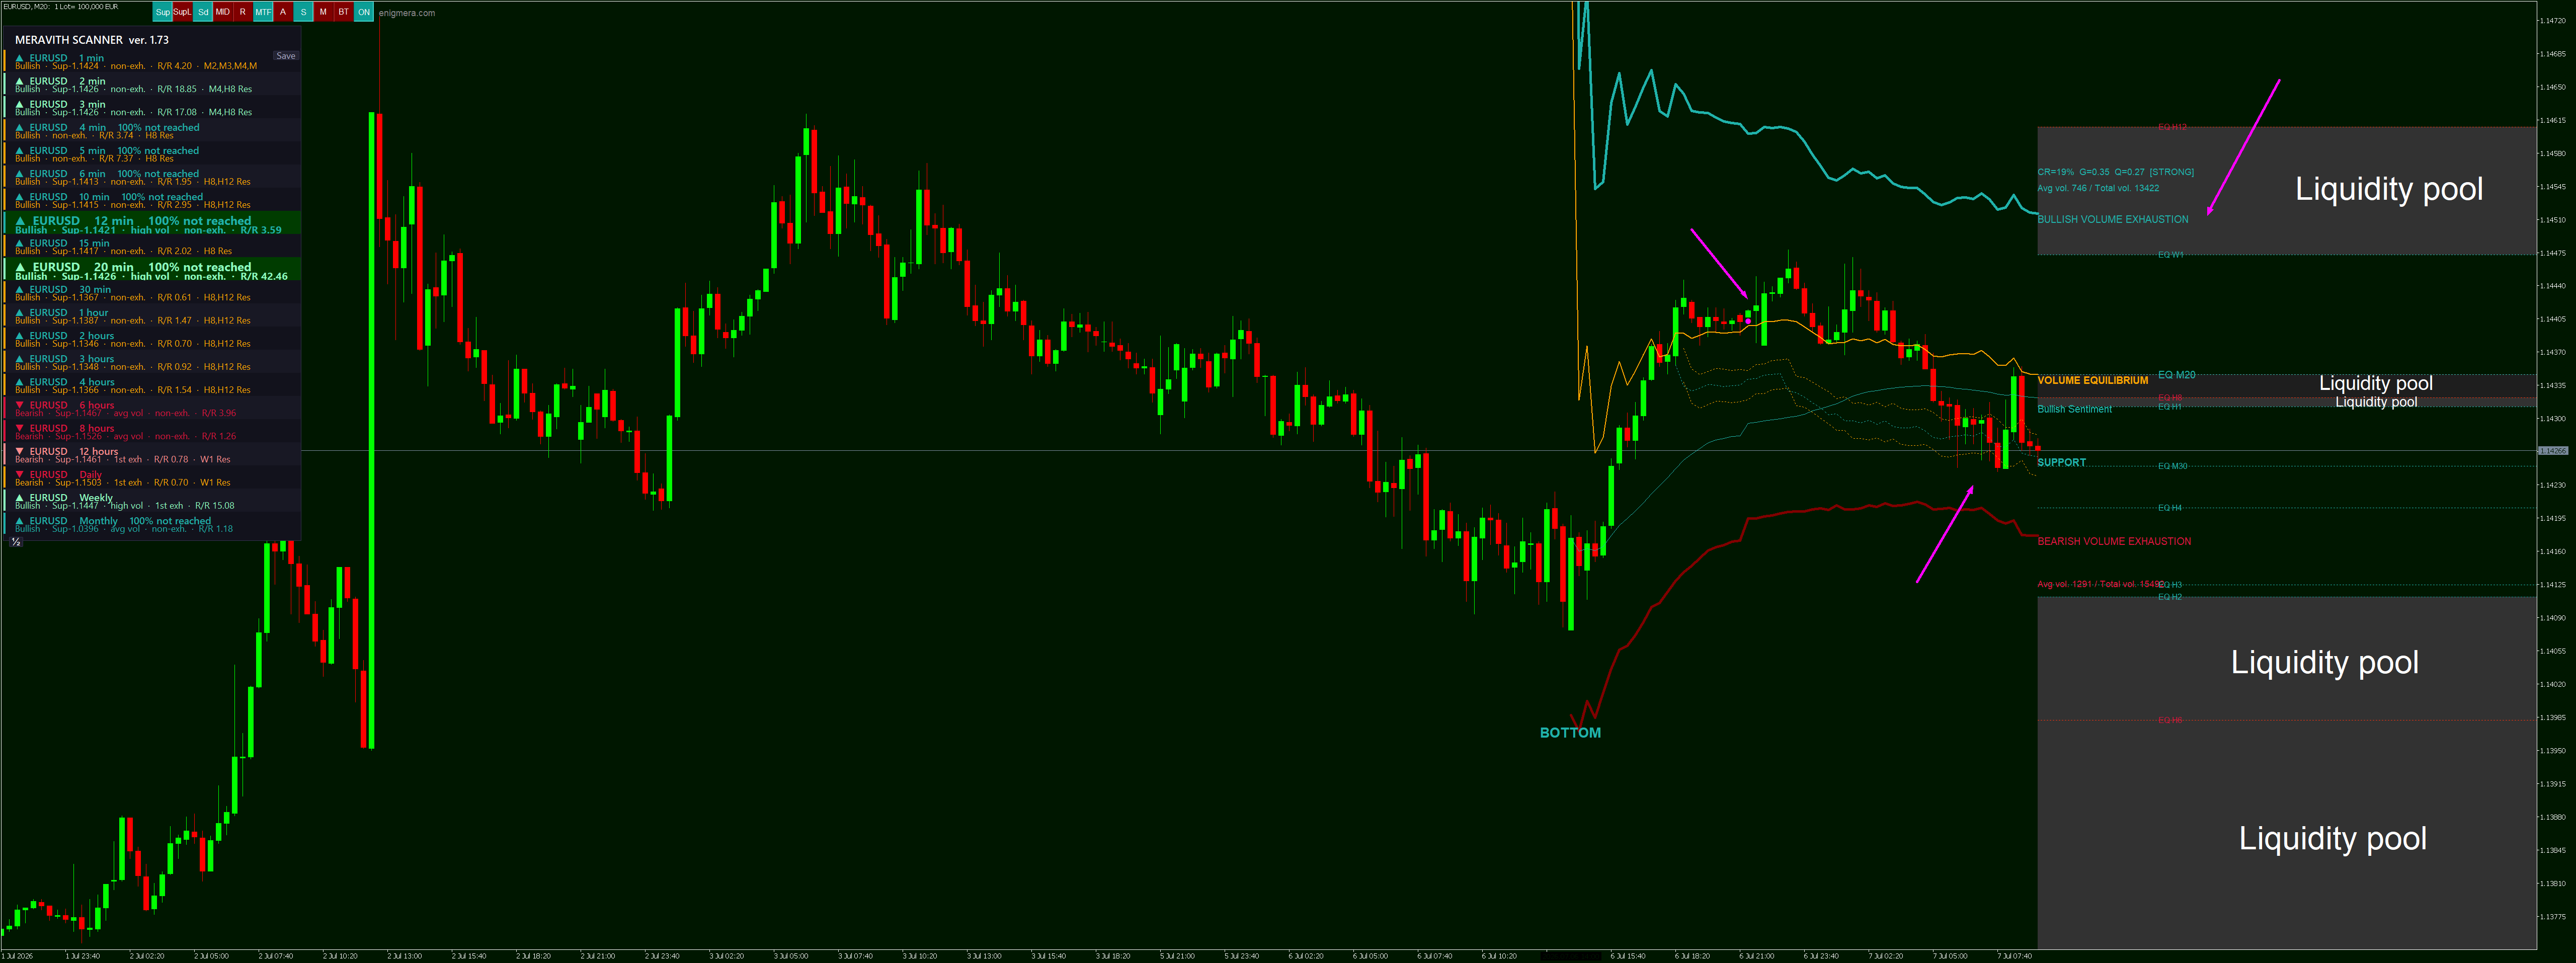
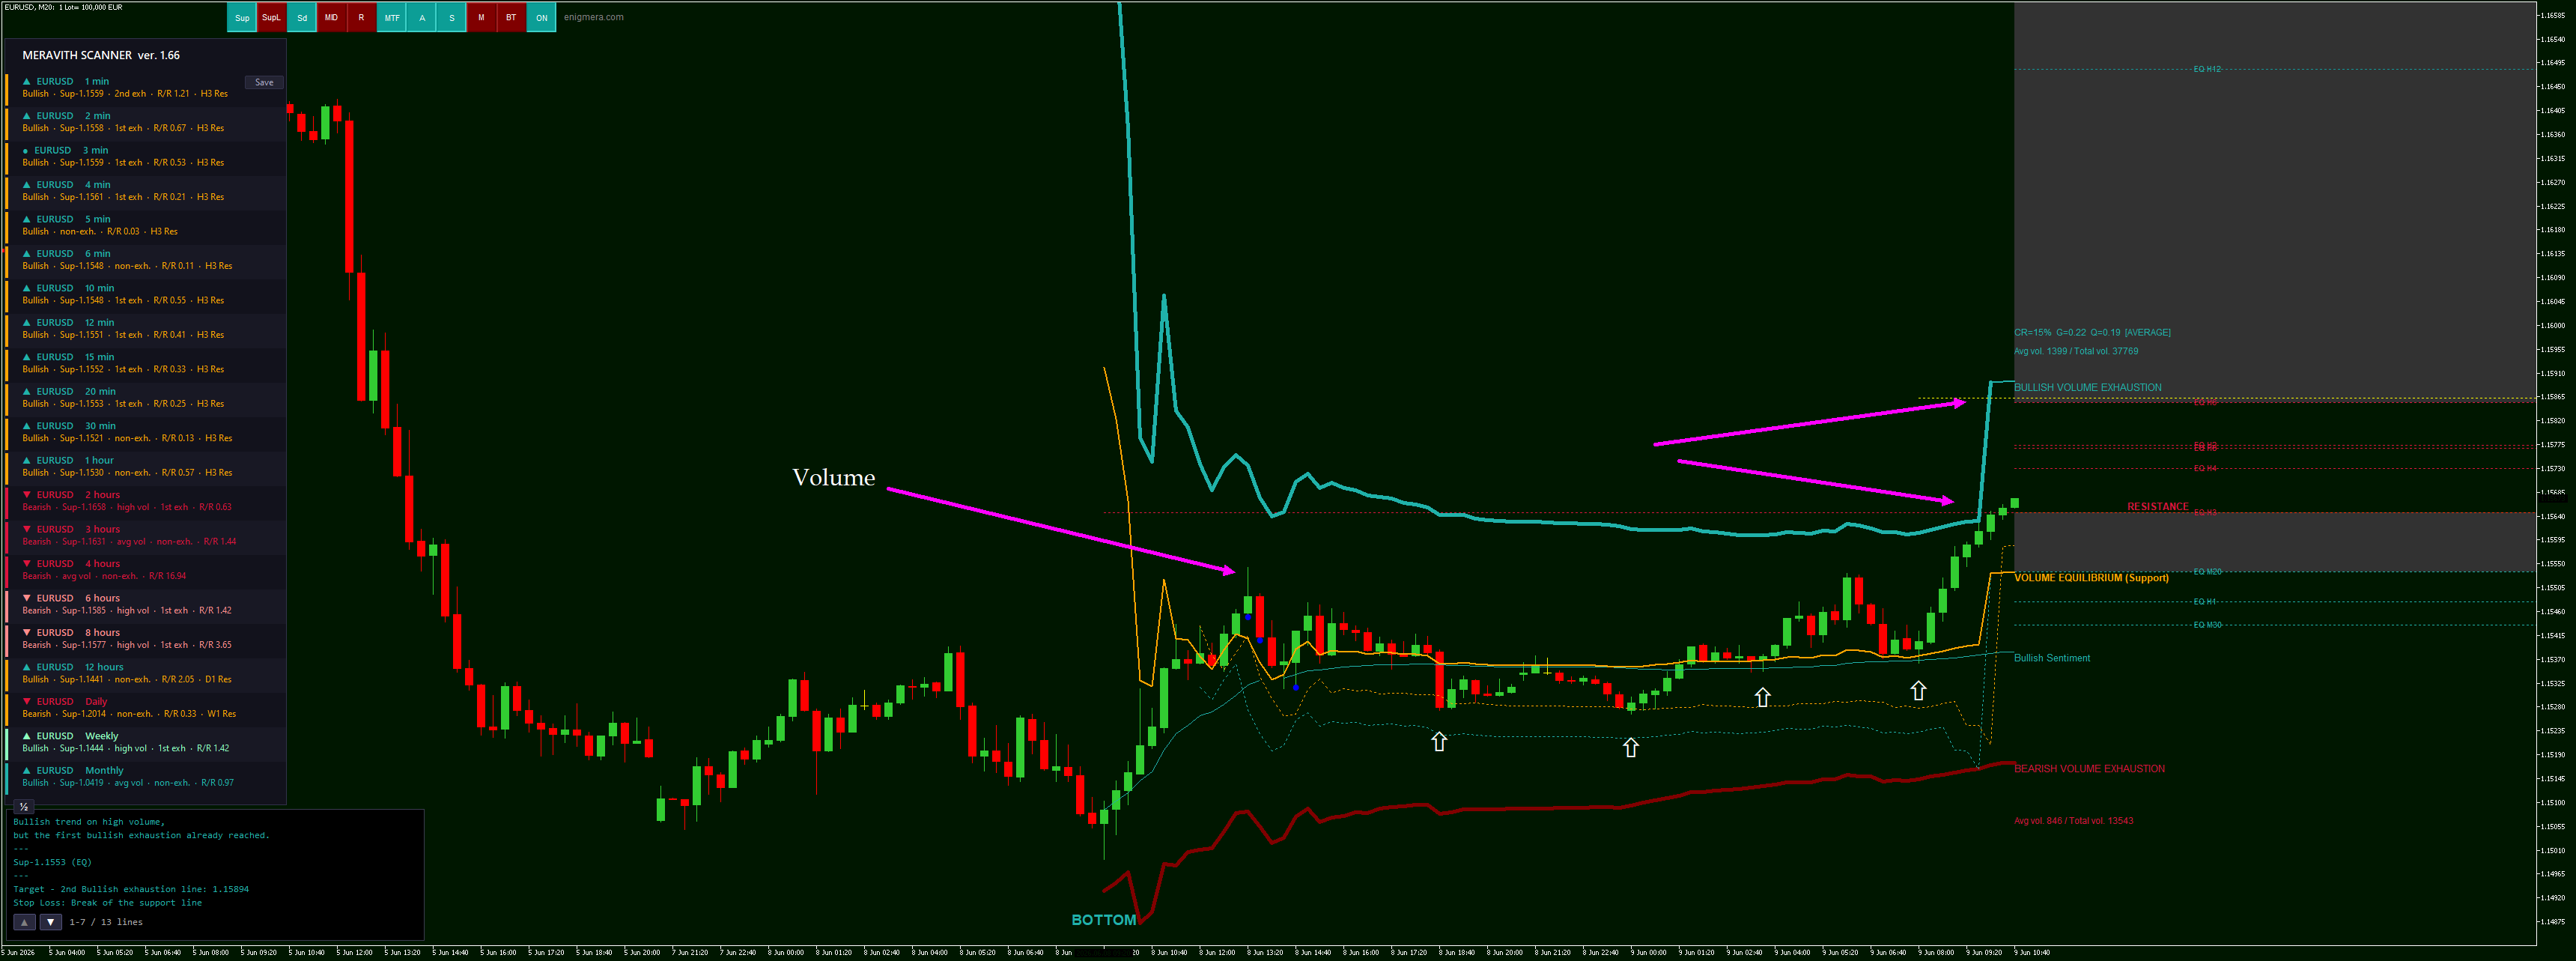
Please note that with Meravith, you can measure not only from a top or bottom, but from any point you consider important. Also observe how the new volume affects the distance indicated by the arrows.
Ivan Stefanov
Produits publiés
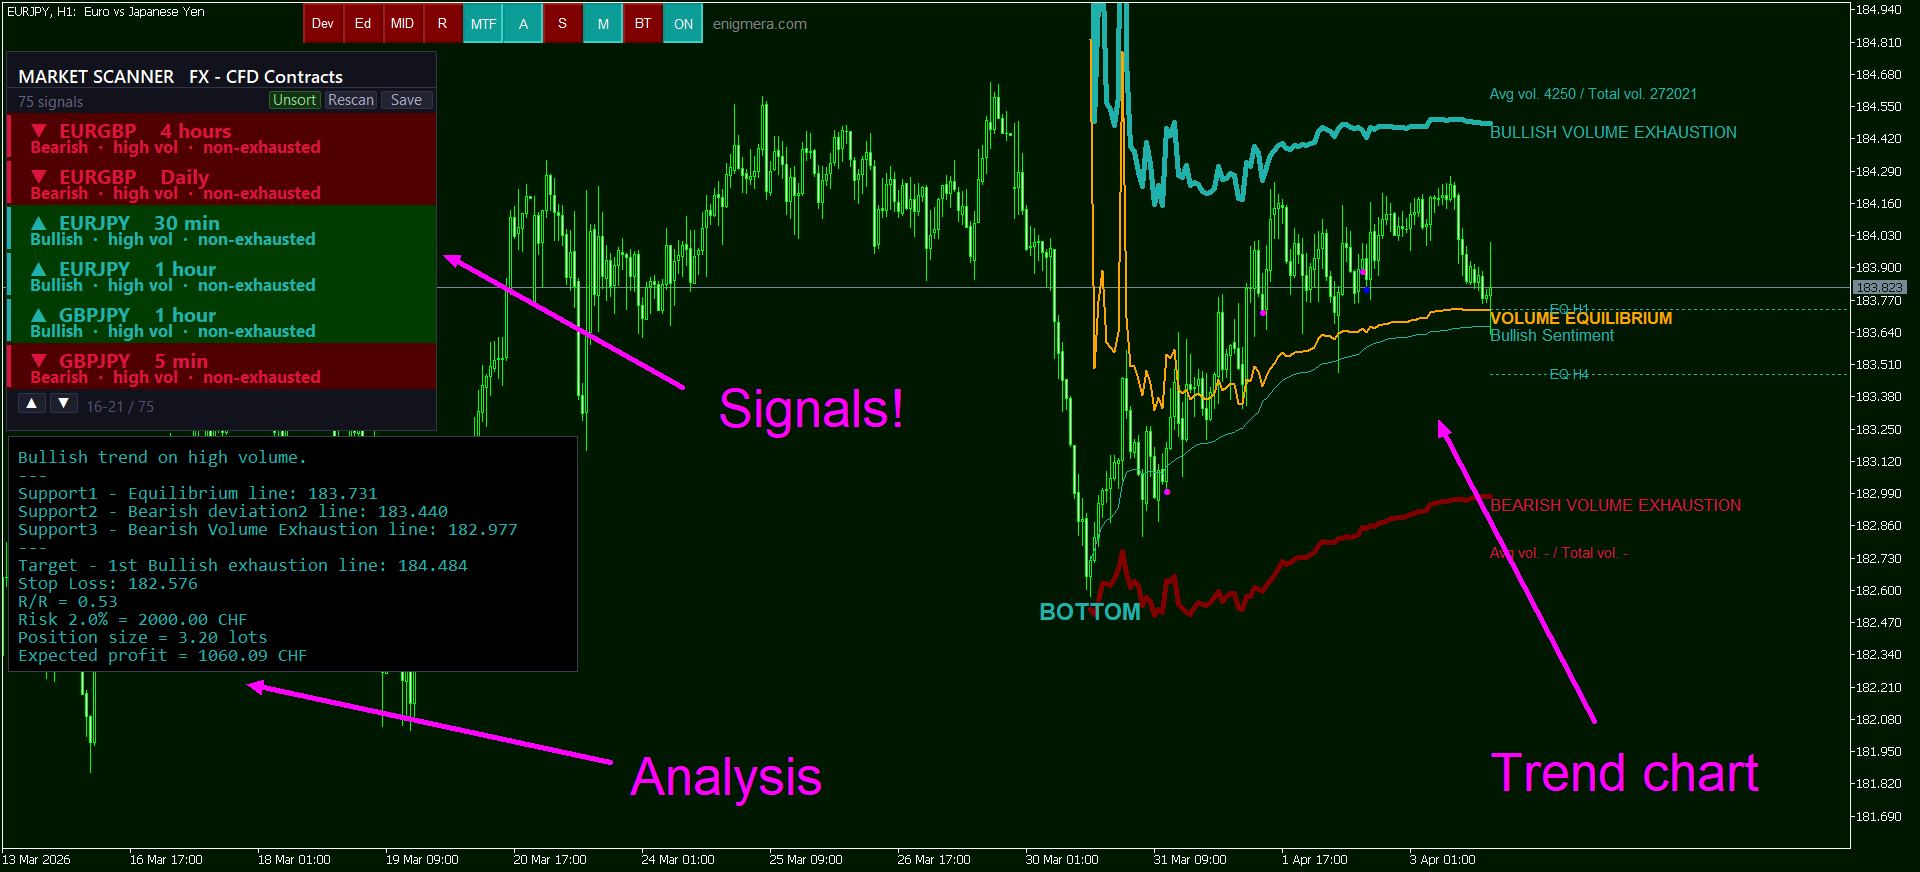
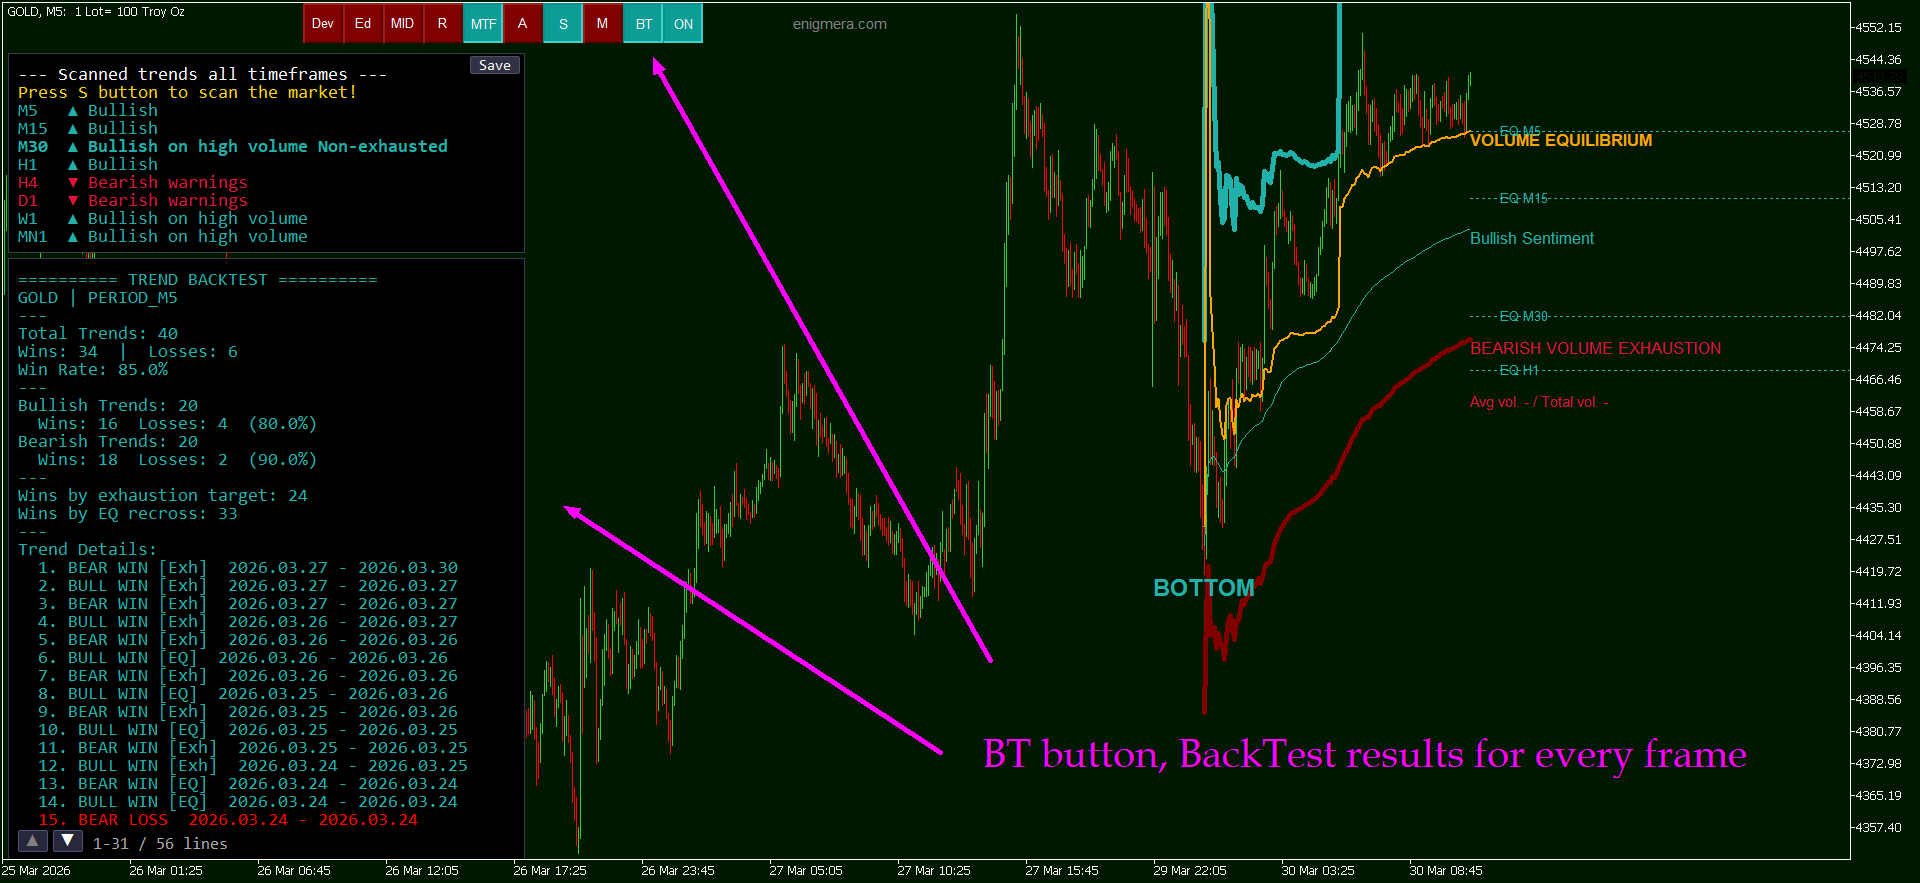
Outil des market makers. Meravith va : Analyser toutes les unités de temps et afficher la tendance actuellement en vigueur. Mettre en évidence les zones de liquidité (équilibre des volumes) où le volume haussier et baissier est égal. Afficher tous les niveaux de liquidité provenant de différentes unités de temps directement sur votre graphique. Générer et présenter une analyse de marché sous forme de texte pour votre référence. Calculer les objectifs, les niveaux de support et les points de
Ivan Stefanov
The new Speculator version. Volume profile included as an option.
Mode 1 - the profile is calculating from the initial point of the indicator to the most current candle.
Mode 2 - the profile is calculating from top to bottom (or viceversa)
Mode 1 - the profile is calculating from the initial point of the indicator to the most current candle.
Mode 2 - the profile is calculating from top to bottom (or viceversa)
Ivan Stefanov
Very good tricky example of this morning.
In Elliott Wave Theory, a triangle forms in wave 4 or B — never in wave 2.
It’s a pattern that confirms the trend.
Let’s look at the example above.
This is indeed a triangle, and it has broken to the upside, which means that when you see it, you should start buying immediately.
However, there’s a nuance here — volume. You can’t see the volume, and that makes it hard to know whether this triangle will actually break and only then produce a move either up or down.
This is where Transaction Speed can help determine direction.
Notice how the entire triangle is located within the accumulation zone — not just a part of it.
If volume were accumulating only in the area near the bottom of the supposed wave 4, then there would be no problem with buying. But in this case, the triangle has absolutely no significance, because it’s not the one defining the levels.
In such a scenario, the triangle can be easily invalidated and is not a reliable pattern.
Keep in mind that, very often at the end of many trends, similar situations form that look like triangles but aren’t — and when everyone expects continuation, the price makes a sharp reversal.
Actually the market will respect not the triangle, but the Transaction Speed levels i.e. the accumulated volume.
In Elliott Wave Theory, a triangle forms in wave 4 or B — never in wave 2.
It’s a pattern that confirms the trend.
Let’s look at the example above.
This is indeed a triangle, and it has broken to the upside, which means that when you see it, you should start buying immediately.
However, there’s a nuance here — volume. You can’t see the volume, and that makes it hard to know whether this triangle will actually break and only then produce a move either up or down.
This is where Transaction Speed can help determine direction.
Notice how the entire triangle is located within the accumulation zone — not just a part of it.
If volume were accumulating only in the area near the bottom of the supposed wave 4, then there would be no problem with buying. But in this case, the triangle has absolutely no significance, because it’s not the one defining the levels.
In such a scenario, the triangle can be easily invalidated and is not a reliable pattern.
Keep in mind that, very often at the end of many trends, similar situations form that look like triangles but aren’t — and when everyone expects continuation, the price makes a sharp reversal.
Actually the market will respect not the triangle, but the Transaction Speed levels i.e. the accumulated volume.
Ivan Stefanov
Wan Suryolaksono
2025.07.29
Now it is still going down even lower, and there is no support in sight yet.
Ivan Stefanov
2025.07.31
The support and target are relative concepts. It is of paramount importance where we can collect the earned.
Ivan Stefanov
Speculator, USD/JPY 4h,
Falling below upper deviation to the support then back to the deviation line.
Ivan Stefanov
Speculator, EUR/USD 5 minAmerican session and Asian after that. The market entered below the upper deviation giving a short signal then dropped to the support.
: