There is not a problem with timeframes - you can see it : You can download Metatrader 5 from the links (located below this thread) and select your broker after that, If your question is about
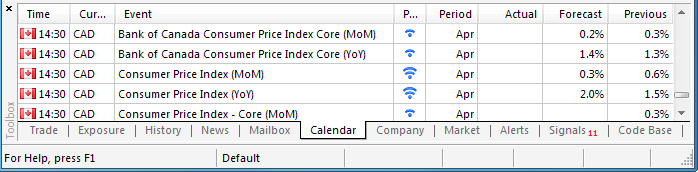
Trading the News: Canada Consumer Price Index (based on dailyfx article ) Canada Consumer Price Reading of 2.0% Will Mark Highest Price Since April 2012, Core Rate of Inflation to Increase for Third
"Оптогану" чипы не светят Основатели компании "Оптоган" Максим Одноблюдов, Алексей Ковш и Владислав Бугров покинули бизнес. Это произошло по инициативе компании "Роснано", которая в прошедшем году
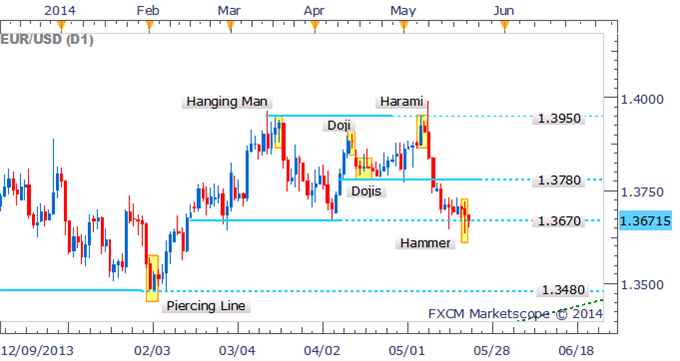
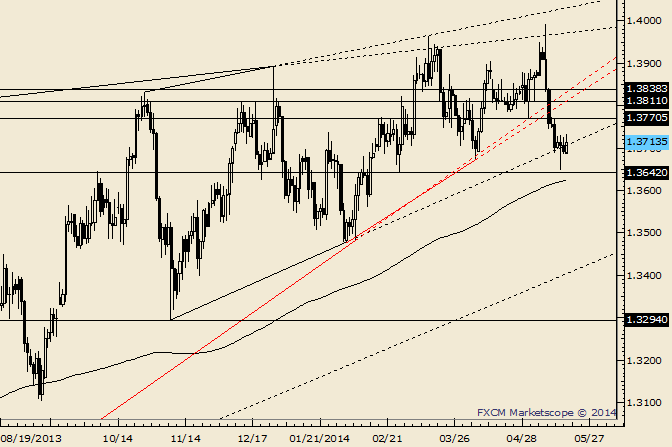
It continues to tease traders near critical support at 1.3670 with the Hammer formation on the daily suggesting the bulls are not prepared to relinquish their grip on the pair just yet. However, before suggesting a potential bounce back to 1.3780, the reversal signal needs to see confirmation from a successive up-day. A daily close below 1.3670 would signal strong conviction amongst the bears and open up the next noteworthy level of support at 1.3480.
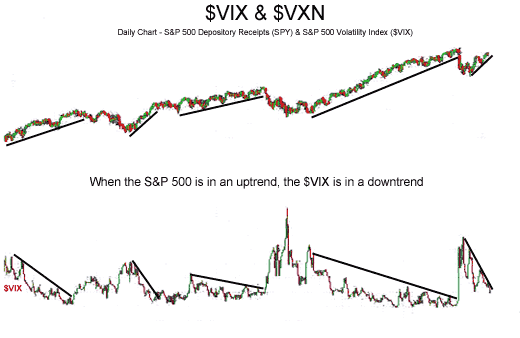
Strategy Video: Strategy For Low and Extreme Volatility Conditions The VIX Volatility Index slipped below 12% for only the third time in the past 7 years, Activity levels in the FX and other financial
2014-05-22 01:45 GMT (or 03:45 MQ MT5 time) | [CNY - HSBC Manufacturing PMI] past data is 48.1, forecast data is 48.1, actual data is 49.7 according to the latest press release if actual > forecast =
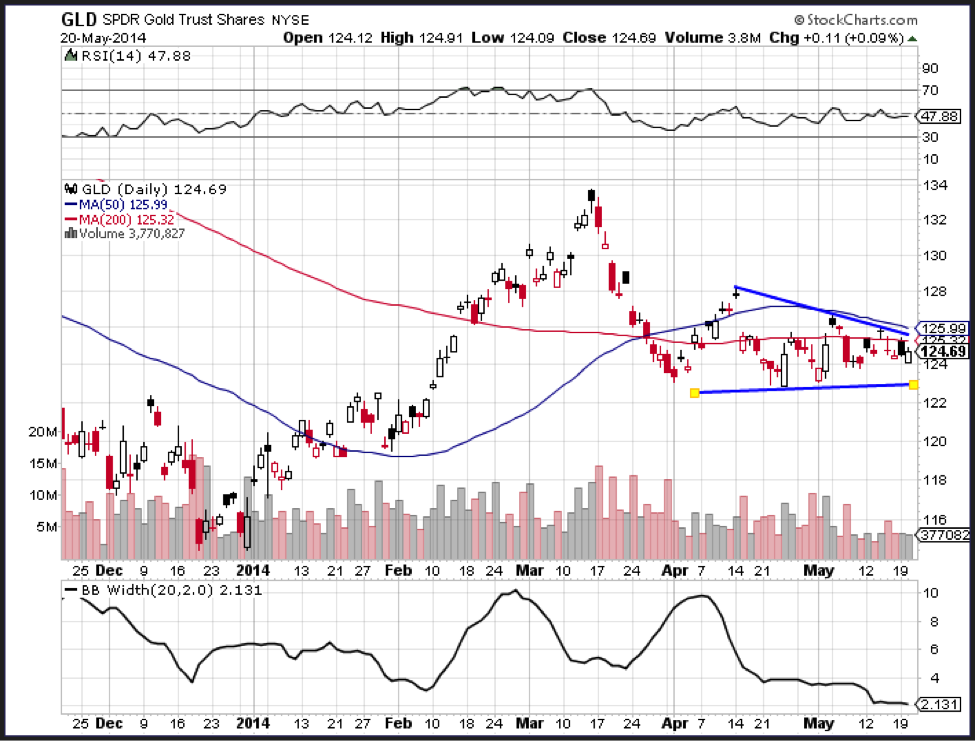
Gold prices have been stuck in neutral since early April as it consolidates near 1300. The GLD ETF fell below 124 in early April and bouncing off the 50-62% retracement few times. A lower high formed in early May and a descending triangle could be taking shape now. This is a bearish continuation pattern and a break below the April lows would signal a continuation of the March decline. The May highs mark a resistance zone in the 126-127 area.
A break above this zone is needed to negate the descending triangle and turn bullish on bullion. Gold needs to break 1320 to get some upside traction.
The 50-day moving average on the GLD is poised to close below the 200-day moving average, which is referred to as the death cross. When this occurs, a long term trend is considered in place and gold prices will likely continue to trend lower.
The Bollinger band width, which is calculated by subtracting the Bollinger band high (two standard deviations above the 20-day moving average) from the Bollinger band low (two standard deviations below the 20-day moving average). The end product is a representation of historical volatility as it shows that net standard deviation of the GLD time series. The low levels of historical volatility reflect the current consolidation in gold prices and reflects that prices could quickly jump with a new catalyst.
The Silver ETF (SLV) fell back to the December-January lows at the end of April and then moved into a tight consolidation. The Bollinger band width indicator has been below 5% for most of the last five weeks. Even though this volatility contraction is occurring near support, the trend since late February is clearly down. A move above this level would exceed the upper band and break the late April high. Such a breakout would suggest a successful support test and reverse the 12-week downtrend.
Trading the News: Bank of England Minutes Bank of England (BoE) to Reiterate Updated Growth & Inflation Forecast, Is There a Growing Dissent in the Monetary Policy Committee (MPC)? The Bank of England
The sharp EUR/USD reversal supports the long discussed ending diagonal (wedge) interpretation. Diagonals are often fully retraced (sometimes quickly), which yields a target of 1.3294.
-Thursday’s reversal following the dip under 1.3672 gives scope to a rally attempt. 1.3758+- is resistance.
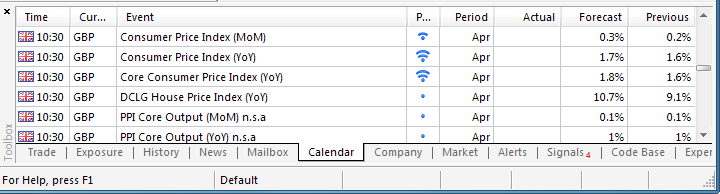
Trading the News: U.K. Consumer Price Index (based on dailyfx article ) U.K. Consumer Price Index (CPI) to Increase for First Time in 2014, Core Inflation to Rise 1.8%- Fastest Rate of Growth Since
Папригуний стрэказа, Абальделие глаза. Цэлий лэта толка пригал, Водка жраль, нагами дригал, И работат нэ хатель! Патаму и ни вспатель! А мураш завскладам биль, В юрта он в мешках насиль - Чай, урюк, киш-мищ, хурьма... Гатавлялься на зима. А Стрекоз над ним смеяль, Вотка жраль, нагой балталь! - Ти смеёшся пачему? Гаварит Мураш ему, - Скоро с неб вада летит, Где патом твая сидит? Стреказа "Ха-Ха" запэл, Вдаль паслал и улетел. Скоро с нэб вада пашоль, Стреказа к Мураш пришоль. - Вах! Салям! Мароз в степе! Ти пусти мене к себе. А пака на двор хана Буду я тибе жина. А Мураш анашкой пых, - Твоя думаль я - кутых? За лепешка спат с табой? Думаишь такой тупой? Целий лето толко пригаль, Жраль арак, нагами дригаль, Не здаровался са мной, Кель атсюда! Пестни пой! В этай басен правда есть, Если хочиш фкусно есть, Лэтам нада рабатАть, А ЗИМОЙ НАГА БАЛТАТЬ!
There is very interesting and unique situation for USDJPY for now : breakdown for D1 and W1 timeframes. D1 timeframe : Chinkou Span line of Ichimoku indicator is crossing historical price on open bar
Os objetos gráficos agora estão disponíveis no MetaTrader 5 iOS . Realize análise técnica em seu iPhone e iPad usando várias linhas, canais, ondas de Elliott, Gann, ferramentas Fibonacci e formas geométricas. Agora o MetaTrader 5 Mobile está a