|
6+ années
expérience
|
5
produits
|
23
versions de démo
|
|
0
offres d’emploi
|
0
signaux
|
0
les abonnés
|
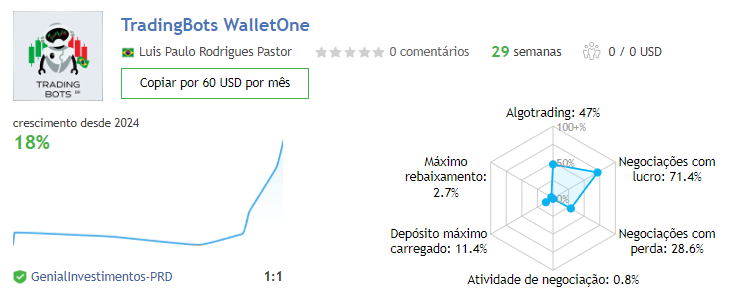
Hello, we develop indicators and EA according to your needs.
Contact us if we can meet your demand.
Follow our page on Instagram @tradingbots.br
Contact us if we can meet your demand.
Follow our page on Instagram @tradingbots.br