Nikolay Raykov
Nikolay Raykov
  • Intellectual Architect à World Trade Market GmbH
  • Autriche
  • 321
5 (1)
  • Informations
Aucun
expérience
2
produits
32
versions de démo
0
offres d’emploi
1
signaux
0
les abonnés
Intellectual Architect à World Trade Market GmbH
FINANCIAL SERVICES INDUSTRY

Accomplished senior business manager and analyst offering 20+ years of experience in financial markets. Gained tremendous international finance and regulatory experience setting up companies and commercial operations.
Nikolay Raykov
Nikolay Raykov
Bitcoin Weekly Outlook

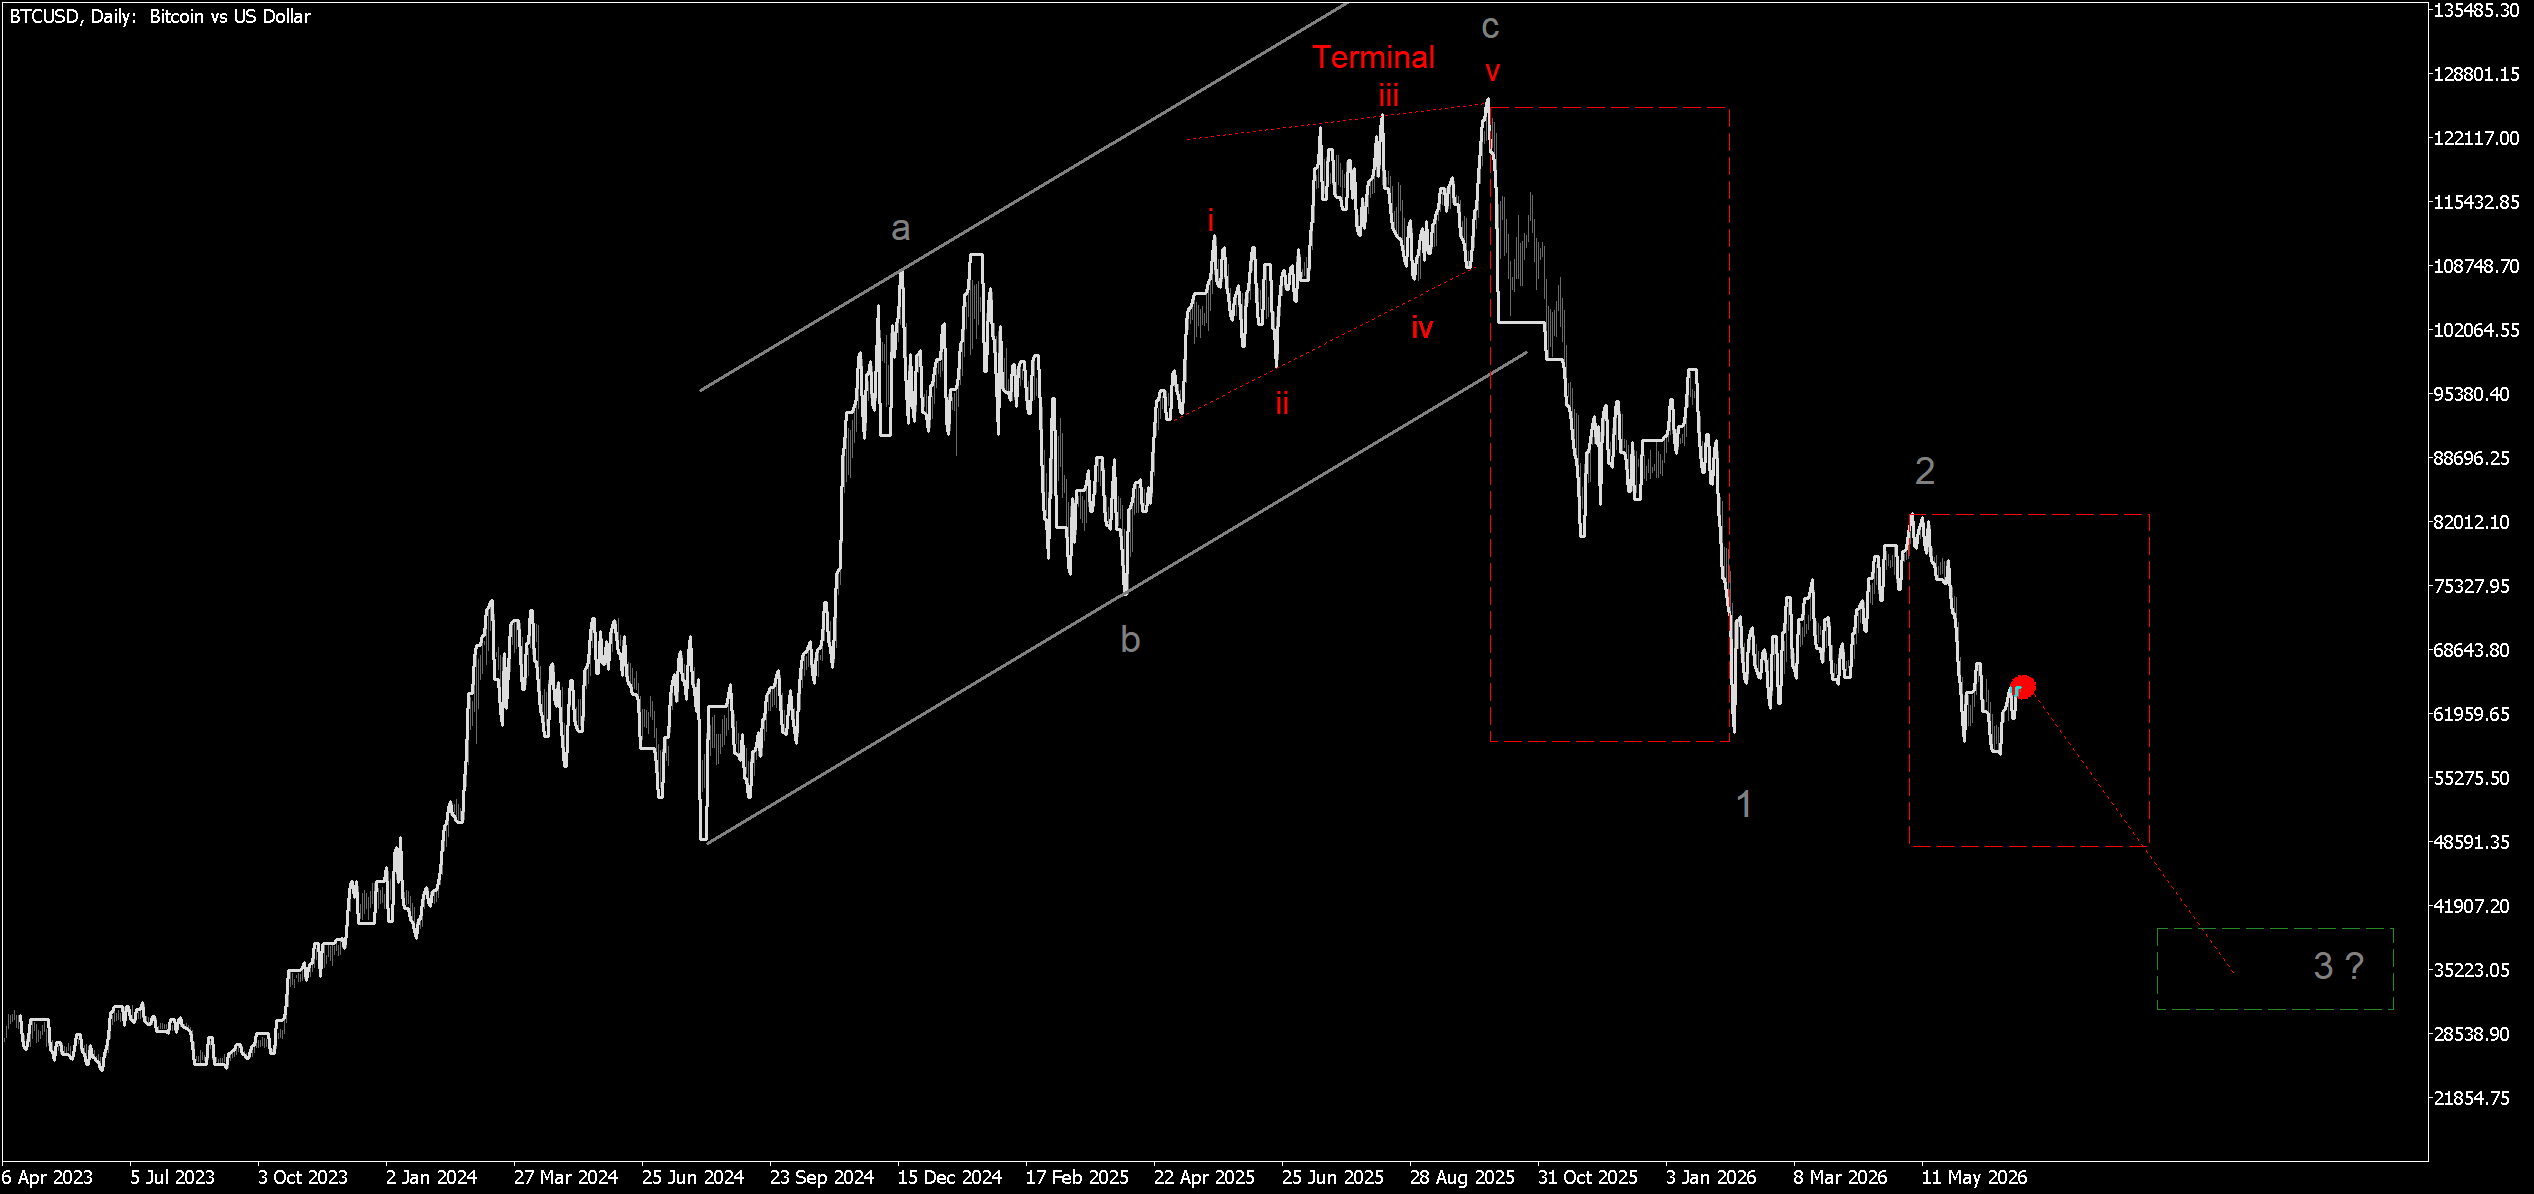
The projection suggests that Bitcoin could approach or break $50,000 later this year. After wave 3 completes, a strong bounce may follow and could make many traders believe the bear market is over. However, the structure still warns that one more final decline may be needed, potentially pushing Bitcoin below the mid-$40,000 area before a more important bottom forms.

Bottom line:
Bitcoin remains vulnerable while the weekly structure continues to point lower. The key downside areas to watch are around $50,000 first, and potentially the mid-$40,000 zone later if the final Terminal decline develops.

Educational analysis only. Not financial advice or a trade recommendation.
kmtl
kmtl 2026.07.14
If this count is right, my wallet is about to learn what "wave 3" feels like. 😅
Nikolay Raykov
Nikolay Raykov 2026.07.15
That's exactly why we wait for confirmation... Wave 3 should hit the market, not your wallet. 😄
Nikolay Raykov
Nikolay Raykov
T-Notes Monthly Outlook: Bearish Structure Points Toward Higher Yields

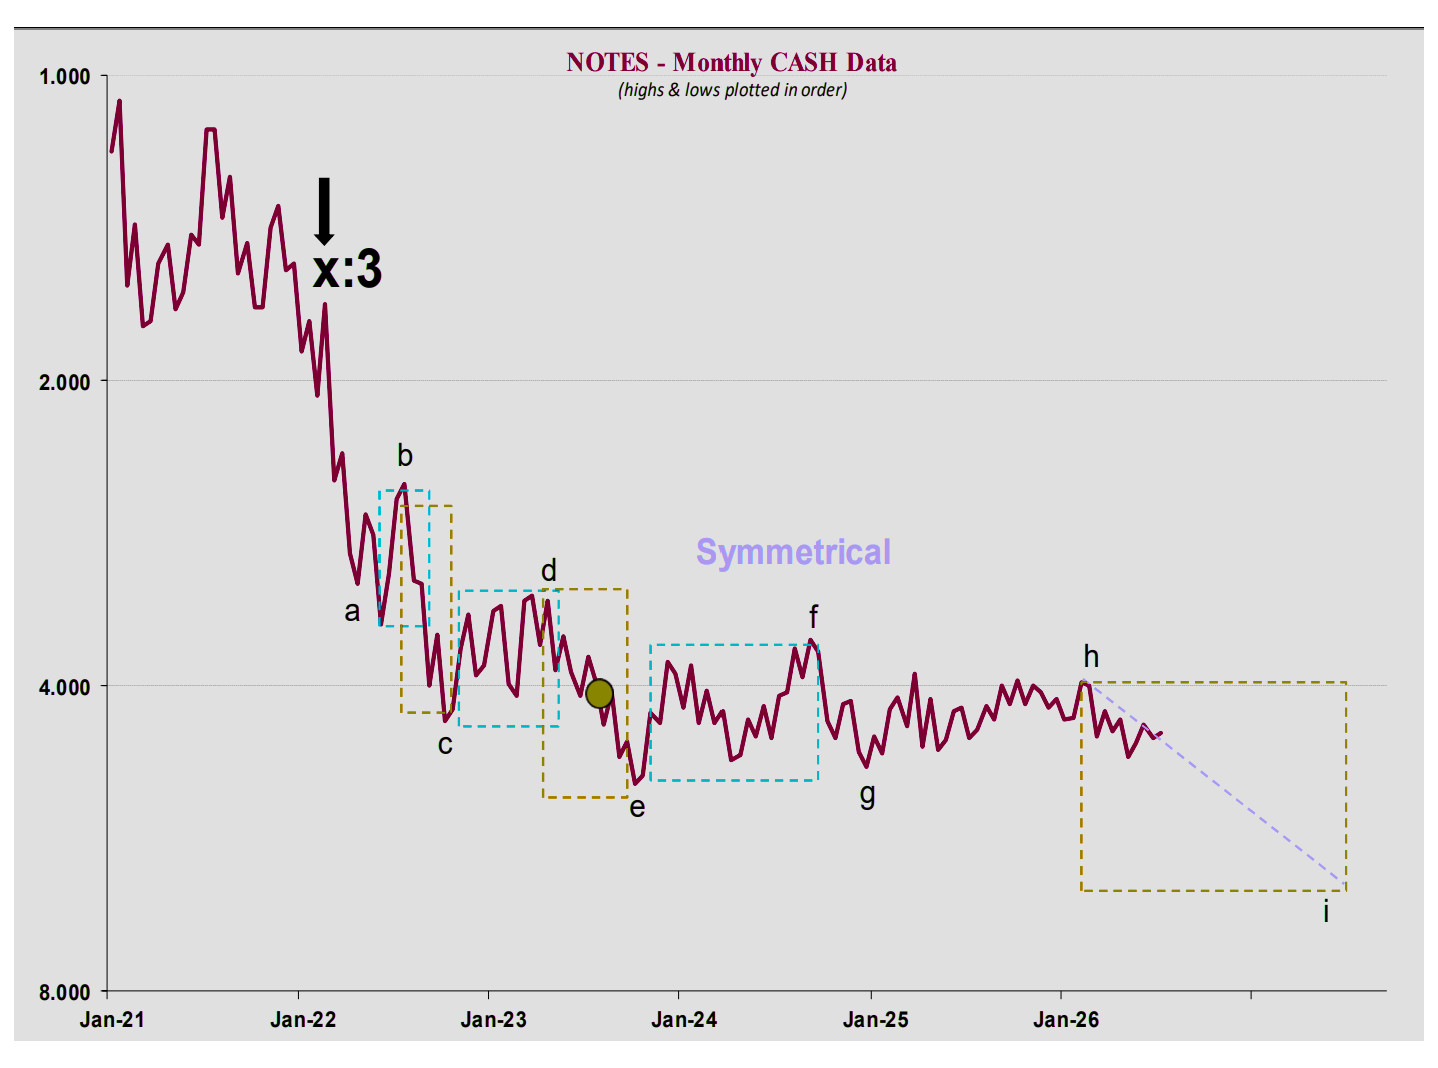
U.S. Treasury Notes continue to show a bearish structure on the monthly chart. From a NeoWave perspective, the current price action appears to be part of a larger *Symmetrical pattern*, with *wave i* now likely forming to the downside.

The recent sell-off has simplified the structure of *wave h*, making it more logical to place *wave g* in early 2025 and *wave h* at this year’s high. If this interpretation is correct, the market is now developing the final bearish leg of this monthly structure.

Because T-Note prices and yields move inversely, further weakness in Notes implies further upside pressure on rates. The current projection suggests that yields could move toward approximately *7.00%* by *Q1–Q2 2027*. If price action slows and drifts to the right of the projected path, the time target could shift into *2028*.
Cross-Asset Impact

A continued decline in T-Notes usually means a rising-yield environment. This can support:

* U.S. Dollar / DXY
* banks
* insurance companies
* financial stocks
* selected *value stocks*

At the same time, rising yields may pressure:

* Gold
* Silver
* EUR/USD
* Nasdaq
* growth stocks
* REITs
* highly leveraged companies

Higher yields tend to attract capital into U.S. fixed-income assets, which can support the dollar. They can also help financial companies through stronger net interest margins. However, rising yields usually make non-yielding assets like gold less attractive and can pressure growth stocks by reducing the present value of future earnings.

Bottom Line

The monthly T-Notes chart remains bearish. If the NeoWave count is correct, *wave i* is now developing lower, with the larger structure pointing toward higher yields and a possible move toward *7.00%* rates by 2027 or, if delayed, 2028.

Until the market shows clear reversal evidence, the broader outlook continues to favor *lower T-Notes and higher yields*.
Disclaimer

This analysis is for educational and informational purposes only. It is based on NeoWave methodology and technical interpretation and does **not** constitute financial advice, investment advice, or a recommendation to buy or sell any financial instrument.
Nikolay Raykov
Nikolay Raykov
T-Notes Weekly Market Outlook: NeoWave Diametric Structure and Cross-Asset Impact
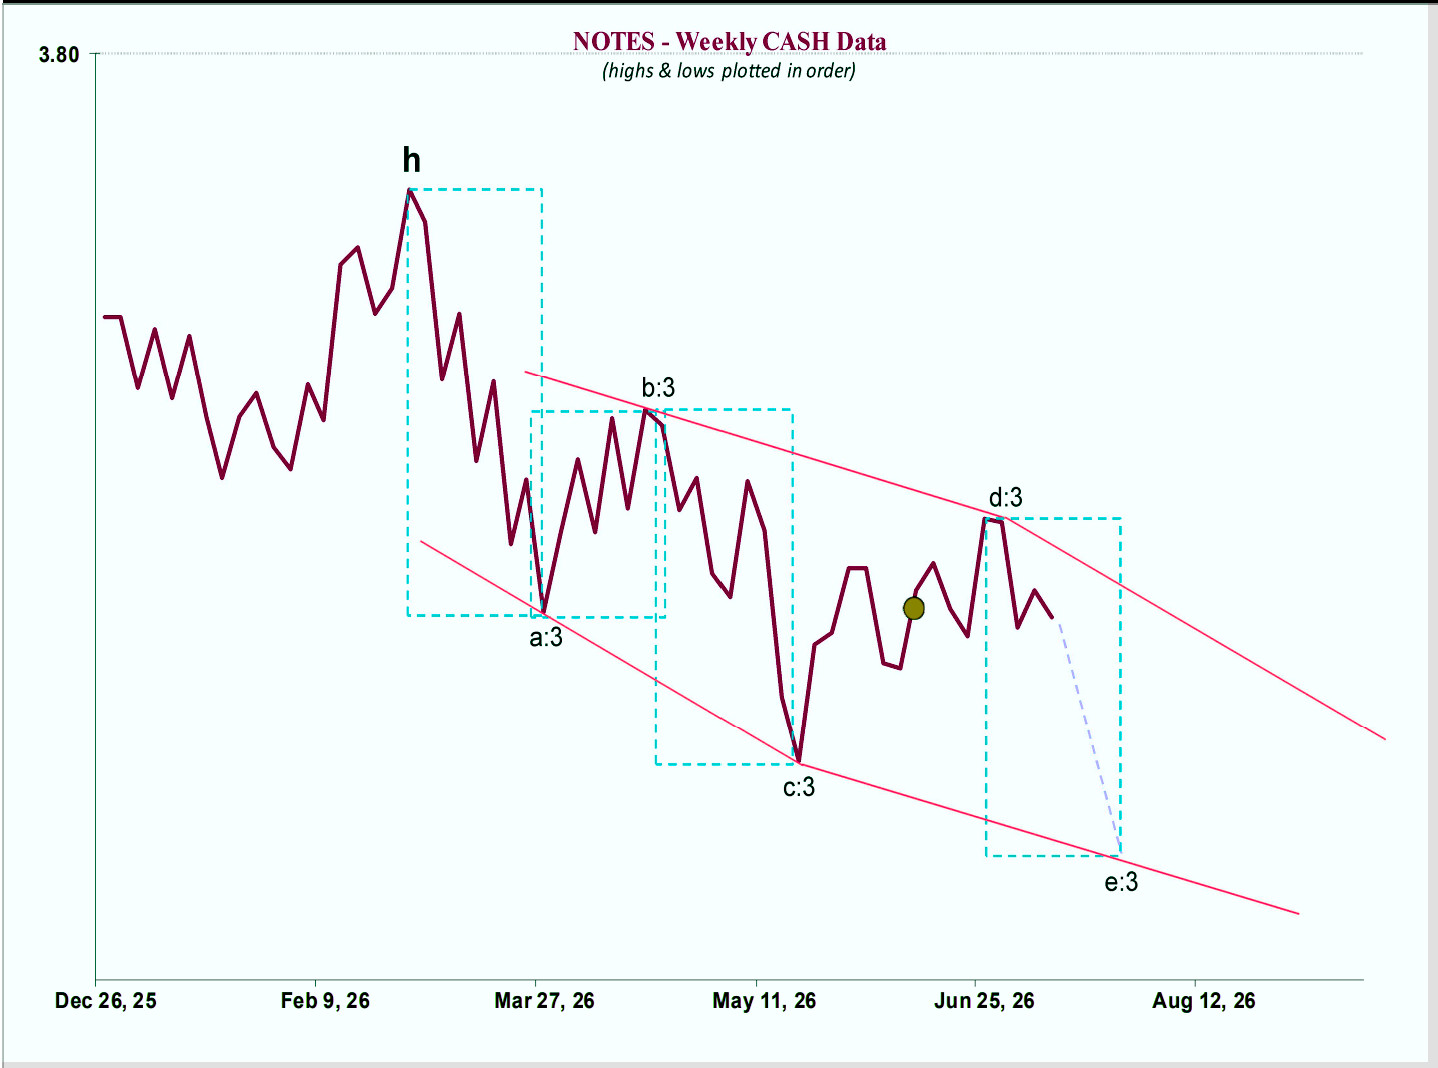
U.S. Treasury Notes continue to show a bearish technical structure on the weekly chart. From a NeoWave perspective, the current price action appears to be forming a Diametric pattern, suggesting that the decline from the February high may not yet be complete.
The most important factor in this analysis is the speed of movement. The downward moves in T-Notes have been larger and faster than the upward recoveries. This behavior usually confirms that the larger-degree trend remains bearish.
The rallies, on the other hand, appear slower, more overlapping, and corrective in nature. This supports the current wave labeling, where the lows are marked as a–c–e, while the rally peaks are marked as b–d.
Based on the chart structure, waves a, b, c, and d appear to have already formed. If this interpretation is correct, the market may now be preparing for, or already entering, wave e to the downside.
This would mean that T-Notes still have room for another meaningful decline before the current weekly pattern reaches completion.
The time similarity between waves a, b, and c also supports the Diametric interpretation. The structure does not look like a simple impulse or a basic correction. Instead, it shows alternating legs, overlapping price behavior, and a clear difference in speed between bearish and bullish phases.
That is why the current formation is best interpreted as a complex corrective structure within a larger bearish trend.
Sell Zone
The most important bearish area is around the wave d region.
This area represents the likely end of the last corrective rally. It is important because price remains below the descending resistance line, while the upward movement into that zone appears corrective rather than impulsive.
From a structural point of view, the wave d area is the logical sell zone, assuming the current labeling is correct.
A bearish continuation scenario remains valid as long as price stays below the key resistance area and downside speed begins to increase again.
Buy Watch Zone
The next possible bullish area would only become interesting near the expected completion of wave e.
This should not be treated as an automatic buy signal. It is only a zone to watch for potential reversal confirmation.
A valid bullish setup would require additional evidence, such as:
• downside exhaustion;
• bullish divergence;
• a reversal pattern;
• loss of downside momentum;
• or a breakout above the descending resistance line after wave e is complete.
Until that confirmation appears, the chart remains bearish.
Cross-Asset Implications
The importance of this T-Notes decline goes far beyond the bond market.
When T-Note prices fall, yields rise. Rising yields can create a powerful chain reaction across currencies, equities, commodities, and risk assets.
Stronger U.S. Dollar
Higher yields tend to support the U.S. Dollar, because global capital is attracted toward higher-return U.S. fixed-income assets.
When investors can receive better returns from U.S. government debt, demand for dollars often increases. This can support the Dollar Index (DXY) and put pressure on major currency pairs against the USD.
This environment often means:
• DXY may strengthen;
• EUR/USD may weaken;
• GBP/USD, AUD/USD, and NZD/USD may also come under pressure;
• USD/JPY and USD/CHF may remain supported, depending on risk sentiment.
For this reason, a bearish trend in T-Notes can indirectly create a bullish backdrop for the U.S. Dollar.
Support for Banks and Financial Stocks
Rising yields can also benefit parts of the financial sector, especially banks, insurers, brokers, and selected financial companies.
Banks may benefit because higher interest rates can improve net interest margins. This means banks may earn more from the difference between what they pay on deposits and what they receive from loans or other interest-bearing assets.
Insurance companies may also benefit because they often invest large pools of capital into bonds and fixed-income products. Higher yields can allow them to generate better returns on those portfolios over time.
This does not mean that all financial stocks will automatically rise, but relative to growth stocks, the financial sector can often perform better in a rising-yield environment.
Pressure on Gold
Gold is usually sensitive to rising yields because it does not pay interest.
When bond yields rise, investors may prefer assets that generate income instead of holding a non-yielding asset like gold. This creates an opportunity-cost problem for precious metals.
As a result, falling T-Notes and rising yields often create pressure on:
• Gold;
• Silver;
• and other precious metals.
However, this relationship is not always perfect. If rising yields are caused by fears about debt sustainability, inflation, or financial instability, gold can sometimes rise together with yields.
So the key point is:
In a normal rising-yield environment, gold is usually under pressure. But if the market begins to fear the debt problem itself, gold may start behaving as a safe-haven asset again.
Pressure on Nasdaq and Growth Stocks
Nasdaq and growth stocks are among the most sensitive assets to rising yields.
The reason is valuation. Many technology and growth companies are priced based on expected future earnings. When yields rise, the discount rate used to value those future earnings also rises. This reduces the present value of future cash flows and can pressure high-valuation stocks.
This is why rising yields often create weakness in:
• Nasdaq;
• technology stocks;
• AI and growth names;
• speculative growth companies;
• unprofitable or highly valued companies.
The higher yields move, the harder it becomes for growth stocks to justify expensive valuations unless earnings growth remains extremely strong.
Therefore, if T-Notes continue to fall and yields continue to rise, Nasdaq may remain vulnerable to corrections, volatility, and sector rotation.
Pressure on REITs and Highly Leveraged Companies
A rising-yield environment can also hurt REITs and highly leveraged companies.
REITs are sensitive because they often depend on borrowing costs and dividend attractiveness. If government bonds offer higher yields, REIT dividends may become less attractive by comparison. At the same time, refinancing debt becomes more expensive.
Highly leveraged companies may also face pressure because:
• interest expenses rise;
• refinancing becomes more costly;
• profit margins can shrink;
• investors demand higher risk premiums.
This means rising yields can create a difficult environment for companies that depend heavily on cheap financing.
Market Impact Summary
A continued decline in T-Notes generally supports:
• U.S. Dollar / DXY;
• banks;
• insurance companies;
• financial stocks;
• sometimes value stocks.
It usually creates pressure on:
• Gold;
• EUR/USD;
• Nasdaq;
• growth stocks;
• REITs;
• highly leveraged companies.
In short, falling T-Notes usually signal a rising-yield environment. Rising yields tend to favor capital preservation, cash flow, financials, and the U.S. Dollar, while pressuring long-duration assets such as gold, growth stocks, and real estate-related securities.
This makes the T-Notes chart especially important, because it can act as a leading macro signal for several other markets at the same time.
Bottom Line
The weekly T-Notes chart continues to favor a bearish interpretation.
The current structure is best explained as a Diametric, with waves a, b, c, and d likely already completed. If this interpretation is correct, then wave e should now develop to the downside.
The key technical idea is simple:
• The market remains bearish while declines are faster and stronger than rallies.
• The wave d area acts as the logical sell zone.
• The projected wave e termination area becomes only a buy watch zone, not an automatic buy signal.
• Falling T-Notes imply rising yields, which can affect USD, Gold, EUR/USD, Nasdaq, financials, and other major markets.
Until the market shows clear evidence of reversal, the structure continues to suggest lower T-Notes and higher yields.
________________________________________
Disclaimer
This analysis is based on NeoWave methodology and technical chart interpretation. It is provided for educational and informational purposes only.
It does not constitute financial advice, investment advice, trading advice, or a recommendation to buy or sell any financial instrument.
All trading and investment decisions should be made independently and with proper risk management. Markets involve risk, and past patterns or technical structures do not guarantee future results.
Nikolay Raykov
Nikolay Raykov
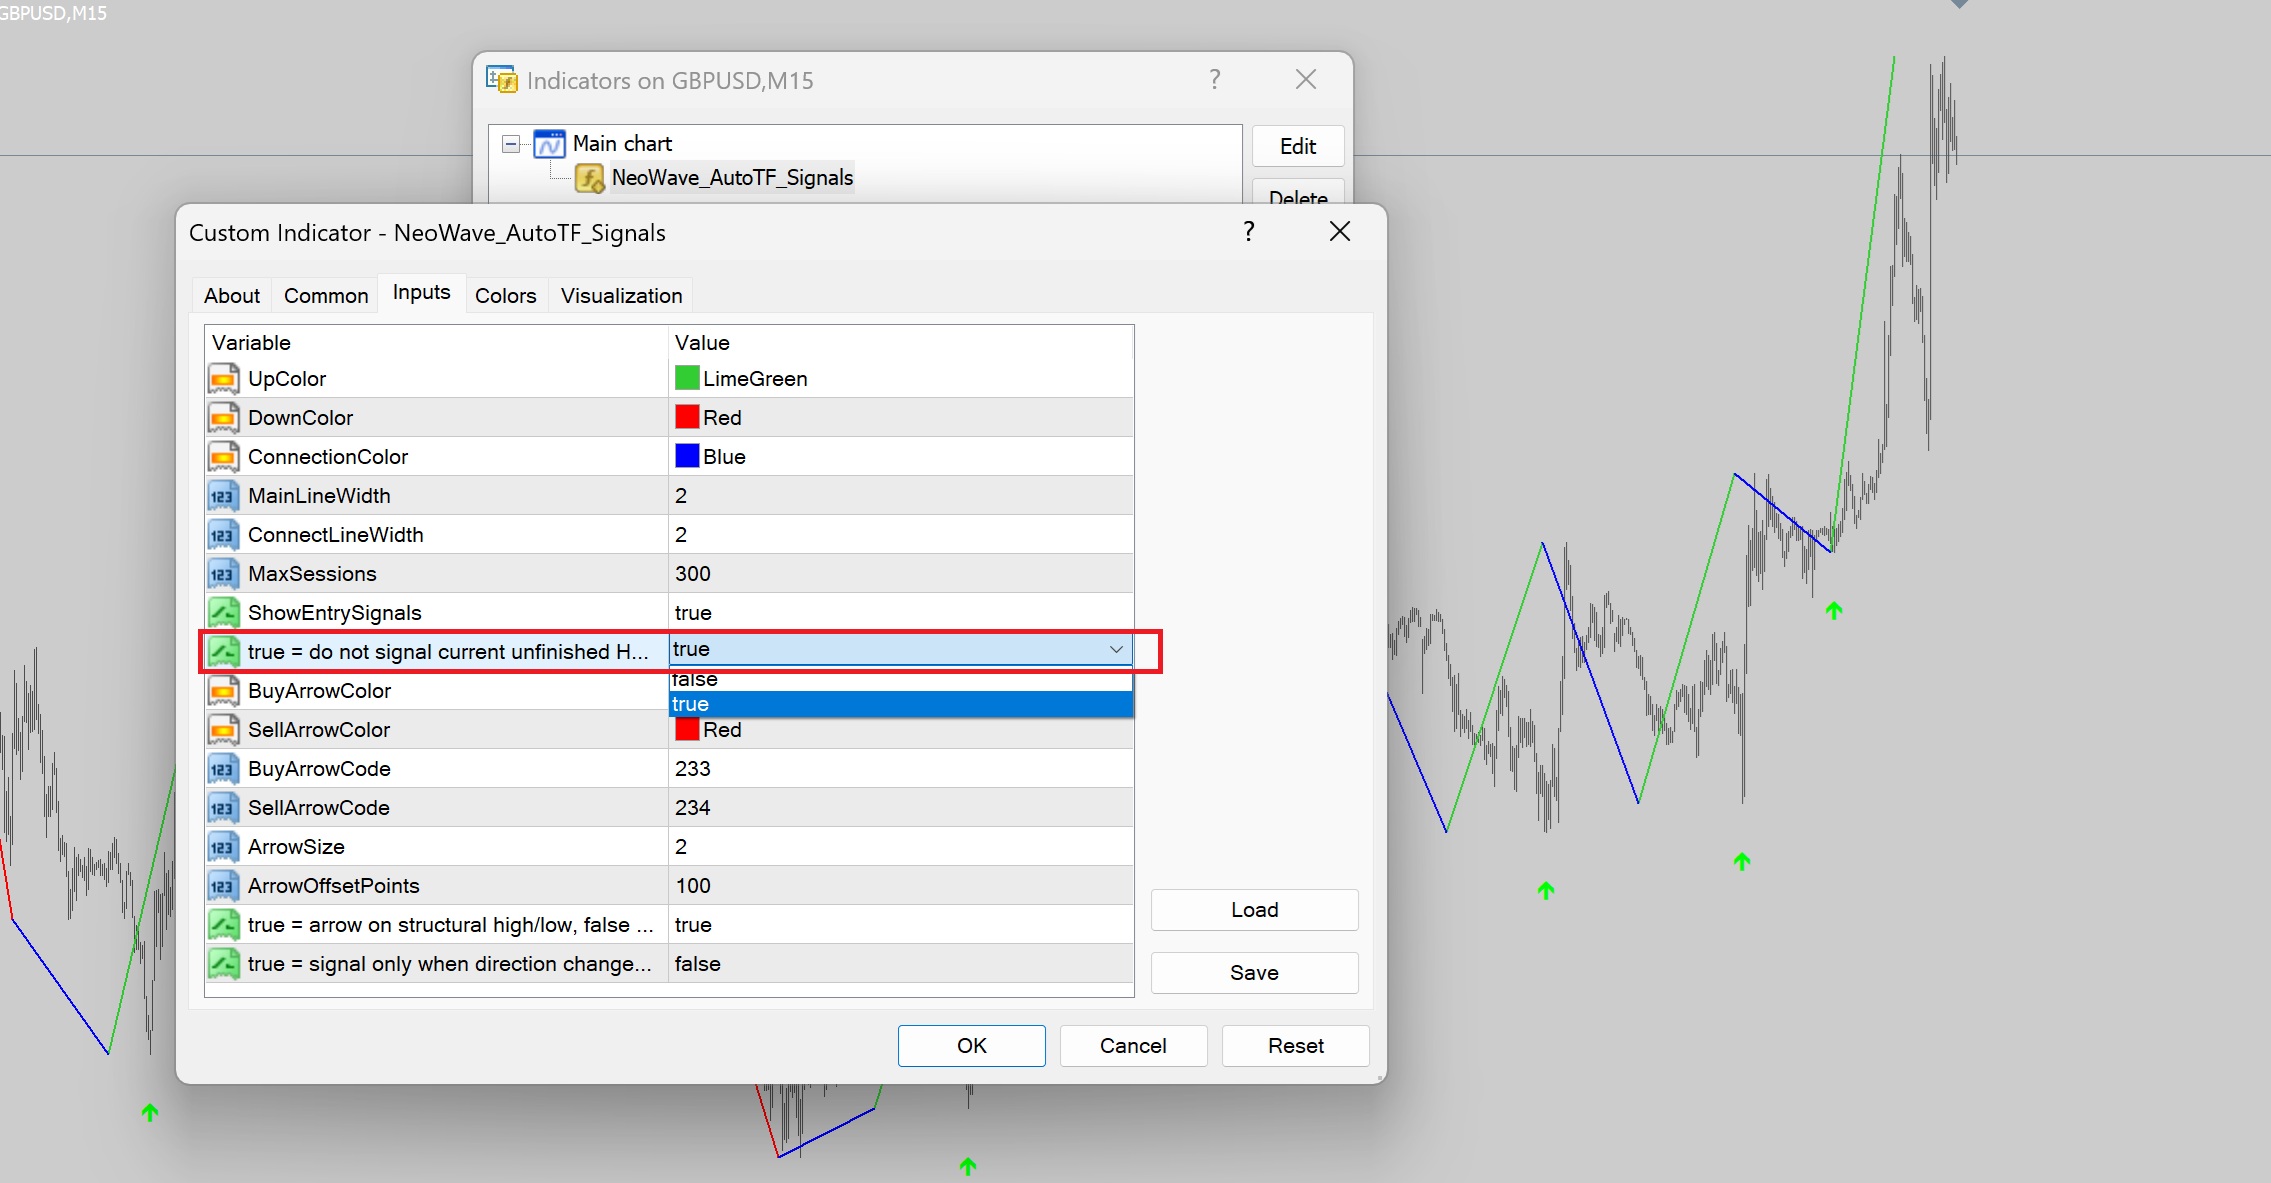
The setting highlighted in red controls whether the indicator is allowed to generate signals on the **currently forming (unfinished) swing**.

* **TRUE (Recommended):** The indicator **does not generate signals on the current unfinished swing**. It waits until the swing is confirmed, which provides more stable and reliable signals and avoids temporary changes while the market is still developing.

* **FALSE:** The indicator **can generate signals on the current unfinished swing**. This gives earlier signals, but they may disappear or move if the market continues to develop, since the swing has not yet been confirmed.

For the most reliable results, I recommend keeping this option set to **TRUE**, especially when trading live. This reduces false or changing signals and ensures that entries are based on confirmed market structure.
Nikolay Raykov
Nikolay Raykov
Euro will rally a little more or waste time going sideways
but within the next 1-2 months, this year’s low should be broken with
1.1000 a likely target before the end of summer.
Nikolay Raykov
Nikolay Raykov
The two violent declines this year (1st in January
and 2nd in March) make it clear Gold has begun
a 1-2 year bear market. During that time frame,
the minimum downside target for Gold is $3900
but it could drop much lower!
Nikolay Raykov
Enregistré à MQL5.community