https://www.youtube.com/watch?v=i2Vax0L98l8
HOW TO SELECT A TARGET GROUP AND INTERPRET THE 3X SIGNALS
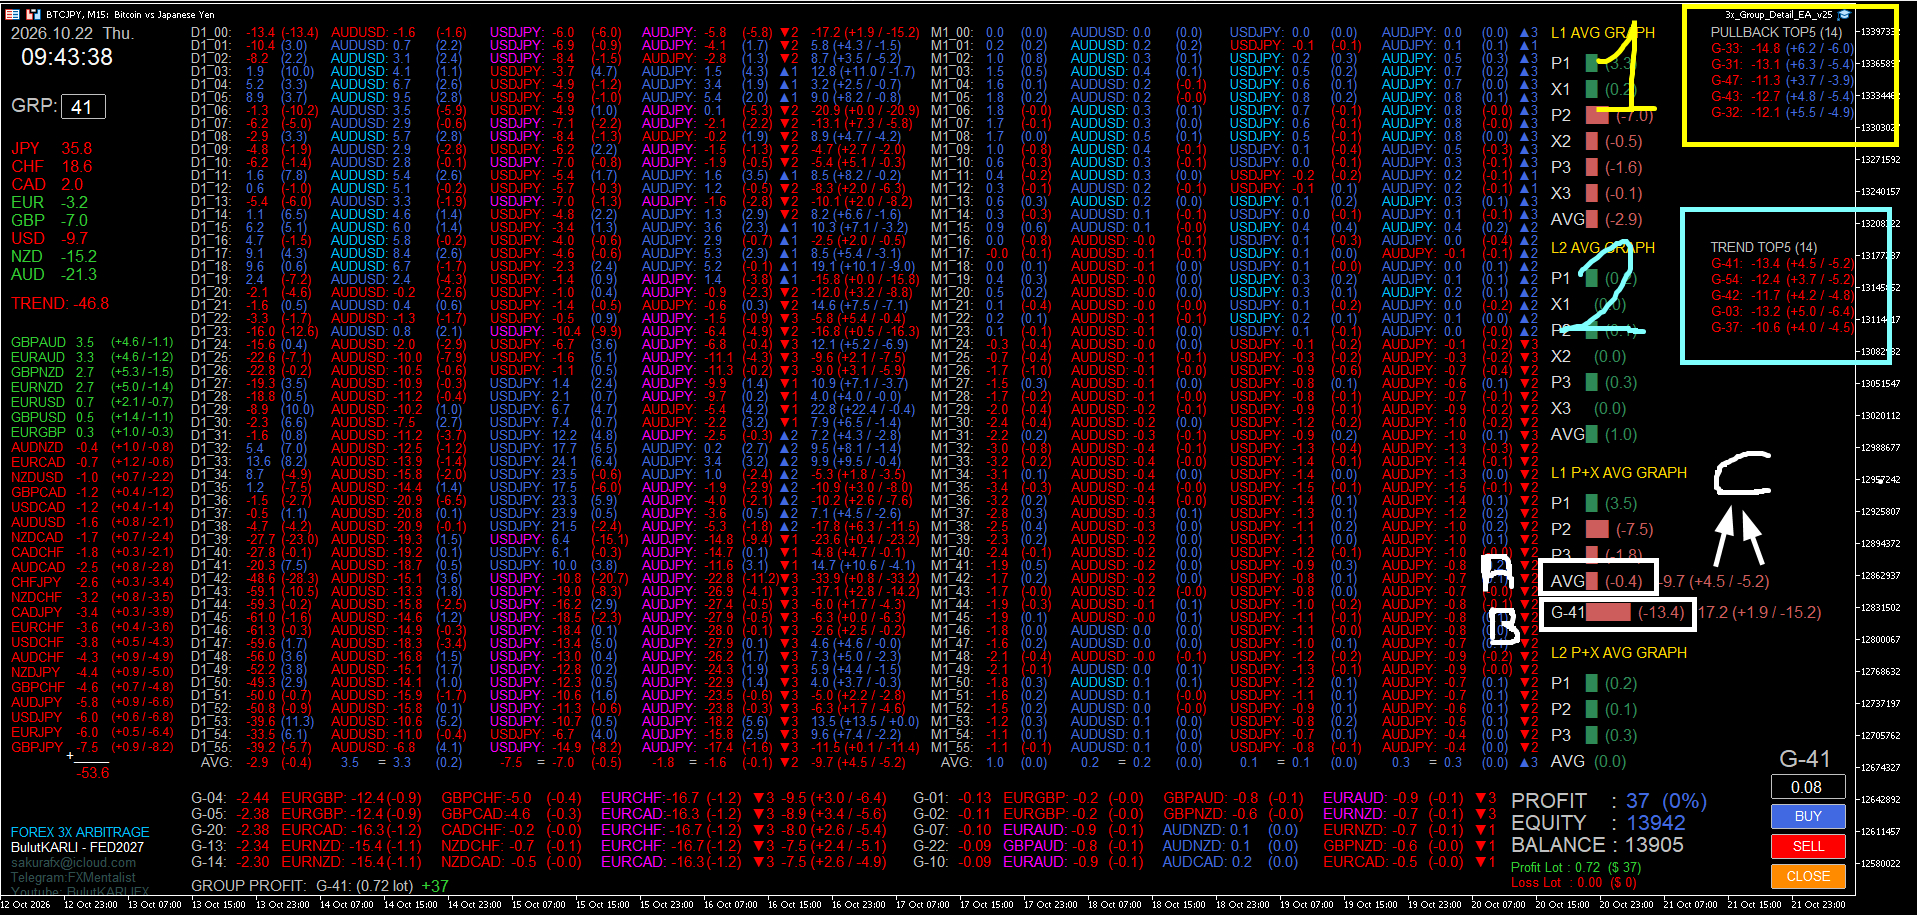
AREA 1: TOP 5 GROUPS WITH THE BEST TREND PULLBACKS
This area lists the top five groups showing the best pullbacks within their trends. Generally, Groups #1 and #2 are preferred.
Trend BUY: A group enters the list when the price pulls back.
Trend SELL: A group enters the list when the price makes an upward corrective move.
AREA 2: TOP 5 GROUPS MOVING MUCH FASTER THAN THEIR AVERAGE TREND SPEED
This area lists the top five groups whose movements are significantly faster than their average trend speed. Generally, Groups #1 and #2 are preferred.
Trend SELL: A group enters the list when the price falls much faster than its normal trend speed.
Trend BUY: A group enters the list when the price rises much faster than its normal trend speed.
SELECTING THE TARGET GROUP
The target group is selected from these two lists on the right side of the dashboard.
In every 3X group, the main pair is always the C pair, meaning the third pair on the far right.
If a group generates a signal in both Area 1 and Area 2 at the same time, and the values displayed next to its group number are approximately equal, the final selection is made by examining the charts of the three currency pairs in that group.
Once a target group has been selected, the first value to examine is the AVG value in Section A.
A. AVG — THE GROUP'S OVERALL TREND DIRECTION
The AVG value in Section A indicates the overall direction of the 3X group.
Example: Group #41
Group #41 appears in Area 2 as a signal indicating that the group is moving much faster than its normal trend speed.
Its AVG value is -0.4.
The average intraday movement that produced this value consists of:
Average upward movement: +4.5
Average downward movement: -5.2
Average intraday high-to-low movement range: 9.7
The values are interpreted as follows:
AVG: (-0.4) — 9.7 (+4.5 / -5.2)
-0.4: The group's average trend direction and strength.
9.7: The average intraday high-to-low movement range.
+4.5: The average upward movement during the day.
-5.2: The average downward movement during the day.
B. ACTIVE DAY VALUE — TODAY'S DIRECTION AND MOMENTUM
The value in Section B is the Active Day Value. It shows the direction and movement of the 3X group during the current trading day.
For Group #41, the calculations show:
Today's upward movement: +1.9
Today's downward movement: -15.5
Current AVG value (AVD): -13.4
This indicates that the group has experienced a substantial downward move during the current trading day.
WHY WE LOOK FOR A BUY ON GROUP #41
Group #41 is a target because it appears in Area 2, which identifies groups moving much faster than their normal trend speed.
The group's overall trend direction, indicated by the AVG value in Section A, is SELL (-0.4).
However, today's AVG value in Section B is -13.4, indicating a sharp downward move that is far greater than the group's average trend value.
We therefore look for a BUY opportunity, expecting a corrective rebound toward the group's average movement speed.
The objective is to capture a temporary recovery after an unusually fast decline.
C. SIGNAL QUALITY — COMPARING TODAY'S AVG WITH THE AVERAGE DOWNWARD MOVEMENT
In Section C, we perform the final signal-quality check.
If the group's overall trend direction is SELL, we examine the negative value in Section C. In this example, that value is -5.2.
The further today's AVG value moves in the negative direction beyond this reference level, the stronger the potential BUY signal for a corrective rebound.
In other words, the more today's downward movement exceeds the group's average downward movement of -5.2, the more pronounced the potential deviation from its normal movement range.
FINAL SUMMARY: GROUP #41 — BUY SETUP
Group #41 is ranked first among the top five targets in Area 2.
The conditions are as follows:
Section A: The group has a negative AVG value of -0.4, indicating an overall SELL direction.
Section B: Today's AVG value is -13.4, indicating an unusually sharp downward move.
Section C: The average downward movement reference is -5.2. Today's AVG of -13.4 is substantially more negative than this reference.
Under these conditions, we look for a BUY opportunity across all three currency pairs in the 3X group, expecting the group to rebound at least toward the -5.2 reference level in Section C.
The trading idea is to capture the corrective move from the current extreme downward deviation toward the group's average downward movement level.
HOW TO SELECT A TARGET GROUP AND INTERPRET THE 3X SIGNALS
AREA 1: TOP 5 GROUPS WITH THE BEST TREND PULLBACKS
This area lists the top five groups showing the best pullbacks within their trends. Generally, Groups #1 and #2 are preferred.
Trend BUY: A group enters the list when the price pulls back.
Trend SELL: A group enters the list when the price makes an upward corrective move.
AREA 2: TOP 5 GROUPS MOVING MUCH FASTER THAN THEIR AVERAGE TREND SPEED
This area lists the top five groups whose movements are significantly faster than their average trend speed. Generally, Groups #1 and #2 are preferred.
Trend SELL: A group enters the list when the price falls much faster than its normal trend speed.
Trend BUY: A group enters the list when the price rises much faster than its normal trend speed.
SELECTING THE TARGET GROUP
The target group is selected from these two lists on the right side of the dashboard.
In every 3X group, the main pair is always the C pair, meaning the third pair on the far right.
If a group generates a signal in both Area 1 and Area 2 at the same time, and the values displayed next to its group number are approximately equal, the final selection is made by examining the charts of the three currency pairs in that group.
Once a target group has been selected, the first value to examine is the AVG value in Section A.
A. AVG — THE GROUP'S OVERALL TREND DIRECTION
The AVG value in Section A indicates the overall direction of the 3X group.
Example: Group #41
Group #41 appears in Area 2 as a signal indicating that the group is moving much faster than its normal trend speed.
Its AVG value is -0.4.
The average intraday movement that produced this value consists of:
Average upward movement: +4.5
Average downward movement: -5.2
Average intraday high-to-low movement range: 9.7
The values are interpreted as follows:
AVG: (-0.4) — 9.7 (+4.5 / -5.2)
-0.4: The group's average trend direction and strength.
9.7: The average intraday high-to-low movement range.
+4.5: The average upward movement during the day.
-5.2: The average downward movement during the day.
B. ACTIVE DAY VALUE — TODAY'S DIRECTION AND MOMENTUM
The value in Section B is the Active Day Value. It shows the direction and movement of the 3X group during the current trading day.
For Group #41, the calculations show:
Today's upward movement: +1.9
Today's downward movement: -15.5
Current AVG value (AVD): -13.4
This indicates that the group has experienced a substantial downward move during the current trading day.
WHY WE LOOK FOR A BUY ON GROUP #41
Group #41 is a target because it appears in Area 2, which identifies groups moving much faster than their normal trend speed.
The group's overall trend direction, indicated by the AVG value in Section A, is SELL (-0.4).
However, today's AVG value in Section B is -13.4, indicating a sharp downward move that is far greater than the group's average trend value.
We therefore look for a BUY opportunity, expecting a corrective rebound toward the group's average movement speed.
The objective is to capture a temporary recovery after an unusually fast decline.
C. SIGNAL QUALITY — COMPARING TODAY'S AVG WITH THE AVERAGE DOWNWARD MOVEMENT
In Section C, we perform the final signal-quality check.
If the group's overall trend direction is SELL, we examine the negative value in Section C. In this example, that value is -5.2.
The further today's AVG value moves in the negative direction beyond this reference level, the stronger the potential BUY signal for a corrective rebound.
In other words, the more today's downward movement exceeds the group's average downward movement of -5.2, the more pronounced the potential deviation from its normal movement range.
FINAL SUMMARY: GROUP #41 — BUY SETUP
Group #41 is ranked first among the top five targets in Area 2.
The conditions are as follows:
Section A: The group has a negative AVG value of -0.4, indicating an overall SELL direction.
Section B: Today's AVG value is -13.4, indicating an unusually sharp downward move.
Section C: The average downward movement reference is -5.2. Today's AVG of -13.4 is substantially more negative than this reference.
Under these conditions, we look for a BUY opportunity across all three currency pairs in the 3X group, expecting the group to rebound at least toward the -5.2 reference level in Section C.
The trading idea is to capture the corrective move from the current extreme downward deviation toward the group's average downward movement level.