Conheça o Mercado MQL5 no YouTube, assista aos vídeos tutoriais
Como comprar um robô de negociação ou indicador?
Execute seu EA na
hospedagem virtual
hospedagem virtual
Teste indicadores/robôs de negociação antes de comprá-los
Quer ganhar dinheiro no Mercado?
Como apresentar um produto para o consumidor final?
Indicadores Técnicos para MetaTrader 4 - 12

Forex Gump is a fully finished semi-automatic trading system. In the form of arrows, signals are displayed on the screen for opening and closing deals. All you need is to follow the instructions of the indicator. When the indicator shows a blue arrow, you need to open a buy order. When the indicator shows a red arrow, you need to open a sell order. Close orders when the indicator draws a yellow cross. In order to get the most effective result, we recommend using the timeframes H1, H4, D1. There

Este indicador do painel de controle de zona de oferta e demanda com vários períodos e vários símbolos envia alertas quando o preço atinge uma zona de oferta / demanda. Também é possível usá-lo para ser alertado sobre topos / fundos duplos regulares em vez de zonas. Ele pode ser usado com todos os intervalos de tempo de M1 a MN. É possível usar RSI, divergência (MACD, OsMA, RSI ou Awesome) e filtros de padrões de velas (barra de pinos, engolfing, pinça e estrela da manhã / noite) para filtrar ap

TDI Multi Timeframe Scanner: This Dashboard indicator uses the TDI (Trader's Dynamic Index) Indicator to find best trades. Extra indicators and detailed description is here: https://abiroid.com/product/tdi-scanner-dashboard
Checks for: - SharkFin Pattern Free indicator for SharkFin: https://www.mql5.com/en/market/product/42405/ - TDI Trend: Strong/Weak Trend Up/Down - TDI Signal: Strong/Medium/Weak Signal for Buy/Sell - Consolidation - Overbought/Oversold - Volatility Bands - Previous Day/Week

This indicator finds Three Drives patterns. The Three Drives pattern is a 6-point reversal pattern characterised by a series of higher highs or lower lows that complete at a 127% or 161.8% Fibonacci extension. It signals that the market is exhausted and a reversal can happen. [ Installation Guide | Update Guide | Troubleshooting | FAQ | All Products ] Customizable pattern sizes
Customizable colors and sizes
Customizable breakout periods Customizable 1-2-3 and 0-A-B ratios
It implements visua
FREE

MT5 Version Available Here: https://www.mql5.com/en/market/product/50048
Telegram Channel & Group : https://t.me/bluedigitsfx
V.I.P Group Access: Send Payment Proof to our Inbox
Recommended Broker: https://eb4.app/BDFXOsprey *All In One System Indicator, Breakthrough solution for any Newbie or Expert Trader! The BlueDigitsFx Easy 123 System makes it easy to identify important areas of market structure. It alerts you to changes in market structure which typically occur when a reve
This indicator finds the "Double Bottom" and "Double Top" technical analysis patterns, shows them on the chart of the currency pair and can signal if the pattern was formed recently. These patterns are reversal, often after the emergence of the trend turns back or a correction occurs. In order not to search for them yourself, it is enough to add the indicator to the chart, after that, you can change different timeframes in order to quickly find such figures on one of the timeframes. There are so
FREE
Thank you for your interest in "Goldfish Indicator". I have been trading since 2008. I usually trade on Renko chart in reversal pattern with Goldfish Indicator. If you share your vps details with me, I will connect your account (Live/Demo). To get proper results copy my trades for at least 30 days. Minimum Deposit: $1000 Leverage: 100:1 Profit Target: Monthly average profit target is 10% to 20%+/- Draw-down: The average drawdown is 10% to 20% Risk
Warning: Trading financial products on margin
FREE
AW Super Trend - Este é um dos indicadores de tendência clássicos mais populares. Possui uma configuração simples, permite trabalhar não apenas com a tendência, mas também exibe o nível de stop loss, que é calculado por este indicador. Benefícios:
Instrumentos: Pares de moedas , ações, commodities, índices, criptomoedas. Prazo: М15 e superior. Tempo de negociação: 24 horas por dia. Mostra a direção da tendência atual. Calcula o stop loss. Pode ser usado ao trabalhar com negociação. Tr
FREE

Earn trading cryptocurrencies nowadays. (2023)
Hello Everyone I would like to introduce you to my short guide about Trading with cryptocurrency pretty short but can be useful for everyone for this year, with patterns based on past experiences, could help those who want to earn with cryptocurrencies. Here im attaching the archive with full guide. https://files.catbox.moe/quwwzw.rar
FREE
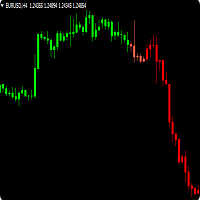
Trendfinder SMA are Colored candlesticks showing the trend based on two Simple Moving Averages and the slope of the slow moving average. This indicator will give you the color change on the next bar on the confirmation candle and will never repaint Trendfinder SMA is optimize to trade on any market and to be used trending and None trending markets. PLEASE TAKE NOTICE: For best results use this indicator as an extra tools after you have completed your regular analysis and use it for alerts base
FREE

Are you tired of drawing trendlines every time you're analyzing charts? Or perhaps you would like more consistency in your technical analysis. Then this is for you. This indicator will draw trend lines automatically when dropped on a chart. How it works Works similar to standard deviation channel found on mt4 and mt5. It has 2 parameters: 1. Starting Bar 2. Number of bars for calculation The starting bar is the bar which drawing of the trend lines will begin, while the number of bars for c
FREE

Introduction
The Price Action, styled as the "Smart Money Concept" or "SMC," was introduced by Mr. David J. Crouch in 2000 and is one of the most modern technical styles in the financial world. In financial markets, Smart Money refers to capital controlled by major market players (central banks, funds, etc.), and these traders can accurately predict market trends and achieve the highest profits.
In the "Smart Money" style, various types of "order blocks" can be traded. This indicator

O indicador mostra o tempo atual nos principais mercados do mundo. Ele também exibe a sessão atual. Muito fácil de usar. Não ocupa muito espaço no gráfico. Ele pode ser usado em conjunto com Expert Advisors e outras painéis, como o VirtualTradePad . Versão com relógio analógico visualizado no gráfico.
Outras características: Existe uma opção nos parâmetros de entrada: dicas Show/Hide (mostrar/ocultar) clicando com o mouse sobre um botão, você também pode selecionar o idioma das dicas em Inglê
FREE

Gold TL MTF - this is a fine stock technical indicator. The indicator algorithm analyzes the movement of the asset price and reflects trend lines along the fractals of a specific timeframe (TF).
Benefits of the indicator: The indicator produces signals with high accuracy. The confirmed signal of the indicator does not disappear and is not redrawn. You can trade on the MetaTrader 4 trading platform of any broker. You can trade any assets (currencies, metals, cryptocurrencies, stocks, indices
FREE

Peak Trough Analysis is the great tool to detect peaks and troughs in your chart. Peak Trough Analysis tool can use three different peaks and troughs detection algorithm. The three algorithm include the orignal Fractals Indicator by Bill Williams, the Modified Fractals indicator and ZigZag indicator. You can use this peak and trough analysis tool to detect the price pattern made up from Equilibrium Fractal-Wave process. For further usage, there are good guide line on how to use this peak trough
FREE

COLORED TREND MA / MACD CANDLES draw MA Candles above/below Moving Average in a single color draw MA as a leading Line like a Supertrend draw MA as a Channel => MA High and Low draw MACD Candles above and below 0 and Signal-Line
Your Advantage: a simple view of the trend direction a simple view over the higher trend direction a calmer chart for the eye clear rules can be defined Settings: Bars to process : 6000 is my default, this value is up to you Value Quick-Set : pre-Settings MACD 12 / 26
FREE
Time your Entry and Exits with Average True Range (ATR) Trailing Stops ATR Trailing Stops are primarily used to protect capital and lock in profits on individual trades but they can also be used, in conjunction with a trend filter, to signal entries. The indicator will help make your calculation of stop loss easier as it will be visually aiding you in choosing where to put your stoploss level on the chart by calculating the current value of ATR indicator. For those who are unfamiliar with ATR, i
FREE

QualifiedEngulfing - é a versão gratuita do indicador ProEngulfing ProEngulfing - é a versão paga do indicador Advance Engulf, faça o download aqui. Qual a diferença entre a versão gratuita e paga do ProEngulfing ? A versão gratuita tem a limitação de um sinal por dia. Apresentamos o QualifiedEngulfing - Seu indicador profissional de padrões Engulf para o MT4 Desbloqueie o poder da precisão com o QualifiedEngulfing, um indicador de última geração projetado para identificar e destacar padrões En
FREE
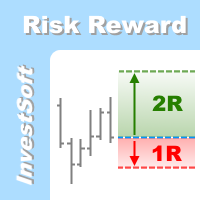
This is the forex visual orders tool & forex position size (lot) calculator with intuitive panel. Risk Reward Ratio Indicator works on all kind of symbols: currency pairs, indices, metals, commodities, cryptocurrencies, etc.
If you want to make sure that Risk Reward Ratio Indicator works on your favorite symbols contact us ( visit our profile ) and ask for 7-day free trial to test this tool without limits. If you want to place orders easier, faster and more intuitive? If you like to mark tr

RaysFX TMAT3 è uno strumento potente che combina due tipi di medie mobili per aiutarti a identificare e seguire le tendenze del mercato. L’indicatore utilizza una media mobile triangolare centrata (TMA) e un T3 Moving Average. Queste due medie mobili lavorano insieme per fornire segnali di trading chiari e tempestivi. Quando il T3 Moving Average è inferiore alla TMA, l’indicatore considera che la tendenza del mercato sia al rialzo e genera un segnale di acquisto. Al contrario, quando il T3 Movin

Overview
The Volume SuperTrend AI is an advanced technical indicator used to predict trends in price movements by utilizing a combination of traditional SuperTrend calculation and AI techniques, particularly the k-nearest neighbors (KNN) algorithm.
The Volume SuperTrend AI is designed to provide traders with insights into potential market trends, using both volume-weighted moving averages (VWMA) and the k-nearest neighbors (KNN) algorithm. By combining these approaches, the indicat

*This is tradingview bot converted to mql4*
The UT Bot Alert Indicator is an advanced technical analysis tool designed to help traders optimize their trading performance. This innovative indicator is based on the proven UT Bot system, which utilizes multiple indicators to deliver accurate signals that can help traders make better decisions. The UT Bot Alert Indicator provides a range of features that can help you stay on top of market trends and capitalize on opportunities. Here are some of i
FREE
.See screenshots of the indicator. Uses information about the current trend. It is based on the classic ADX indicator. Gives a signal to enter a trade using a non-standard strategy.
Settings: Name Description Period of ADX The period of the classic ADX indicator Distance between +D & -D lines Distance between + D and -D lines . Determines the strength of the trend. Freshness of the signal (bars) Checking the freshness of a buy or sell signal.
Selects the very first signal in the span.
The nu
FREE

Heikin Ashi is Japanese for "average bar", and may make it easier for you to identify trends. Our version of this popular indicator adjusts the size of the candles based on the zoom level of your chart, making it appear more naturally just like the traditional candlesticks. The colors are selected based on the color scheme you use on your charts, but can be customized anyway you would like. You may also choose whether to display only the Heikin Ashi candles, or show the other selected chart as w
FREE

O Indicador Chart High Low é um indicador para META TRADER 4, com a função de analisar e mostrar os níveis MÁXIMO semanal MÍNIMO semanal, MÁXIMO mensal e MÍNIMO mensal. Isso pode ajudar muito na hora de criar TrendLine ou até mesmo traçar sua linha de FIBONNACI, não sendo necessário acessar sites de Internet para analisar os níveis de MÁXIMA/MINÍMO. Em análises gráfica, pode auxiliar na quebra de níveis de MÁXIMA/MÍNIMA, criações de breakOut suporte e resistência. Há funções de "marcar" no indic
FREE

Double top and bottom indicator is a pattern scanning indicator which scans the tops and bottoms using zig zag pattern. When it find price bouncing back from the same point twice after a long trend then it generate arrow signals whenever the last resistance points is broken for double bottom and last support price broken for double top. Unlike other top bottom scanner it does not give only 1 signal. it alerts user when ever the last support /resistance is broker from double top/bottom pattern un
FREE

This indicator identifies swing highs and swing lows in the price chart by comparing the Highs and lows of each candle to a specified number of candle before and after it. Once it has identified the swing highs and swing lows, it can use them to determine potential support and resistance levels. A support level is formed when the price drops and bounces back up from a swing low, indicating that there is buying pressure at that level. A resistance level is formed when the price rises and reve
FREE
Wedge Chart Pattern Indicator - Unleash the Power of Wedge Patterns in Your Trading Embark on a journey of precision trading with the "Wedge Chart Pattern Indicator." Crafted for MetaTrader, this advanced tool is your ultimate companion for identifying wedge chart patterns, empowering you to make informed and strategic trading decisions. Whether you're a seasoned trader or just starting, this indicator simplifies the process of spotting wedge patterns, providing you with a valuable edge in the m
FREE

Uma implementação pessoal de blocos de pedidos, uma estratégia de negociação de posição simples, mas eficaz. O negociador deve entrar no mercado ou procurar negociações na direção do último bloco de ordem, se a faixa de preço não foi violada na direção oposta ao rompimento. Blocos abertos não são desenhados para maior clareza.
[ Guia de instalação | Guia de atualização | Solução de problemas | FAQ | Todos os produtos ] Um bloco aberto de alta é a primeira barra de alta após uma nova baixa do m
A liquidez é um aspecto importante no mercado, especialmente para investidores institucionais, pois eles precisam de muita liquidez para entrar ou sair do mercado.
O dinheiro inteligente atua como criador de mercado para o rebanho. Em outras palavras: o dinheiro inteligente é a contrapartida do excesso de posições longas ou curtas que estão sendo mantidas pelo rebanho. Se o rebanho tiver net short, o dinheiro inteligente será net long. Se o rebanho tiver uma rede longa, o dinheiro inteligente
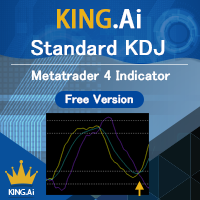
The standard KDJ indicator is presented by KING.Ai. This indicator were built base on the the theory of KDJ . KDJ is a very effective and useful strategy to trade especially in swing trading. Method to apply (please also refer to the graphic): 80/20 rule: Price from bottom to top 20 to 80. And price from top to bottom 80 to 20. Both is enter market signal. Indicator period: The indicator is made by period 9,3,3 KING.Ai Forex trader believe that such strategy must complement with other indicato
FREE

Introduction
"Smart money" is money invested by knowledgeable individuals at the right time, and this investment can yield the highest returns.
The concept we focus on in this indicator is whether the market is in an uptrend or downtrend. The market briefly takes a weak and reversal trend with "Minor BoS" without being able to break the major pivot.
In the next step, it returns to its main trend with a strong bullish move and continues its trend with a "Major BoS". The "order bloc

Currency Strength Meter is the easiest way to identify strong and weak currencies. This indicator shows the relative strength of 8 major currencies + Gold: AUD, CAD, CHF, EUR, GBP, JPY, NZD, USD, XAU. Gold symbol can be changed to other symbols like XAG, XAU etc.
By default the strength value is normalised to the range from 0 to 100 for RSI algorithm: The value above 60 means strong currency; The value below 40 means weak currency;
This indicator needs the data of all 28 major currency pair

Ou M oving A verage S upport R esistance Bands .
O indicador MASR Bands é uma média móvel rodeada por duas bandas que funcionam juntas como níveis de suporte e resistência. Estatisticamente, as bandas MASR contêm velas de preço 93% do tempo. Aqui está como ele é calculado em etapas: 1. A primeira etapa é calcular o máximo mais alto (HHV) e o mais baixo (LLV) para um período X de tempo.
2. A segunda etapa é dividir HHV por LLV para obter a largura da distância entre eles como uma porcentag

O indicador mostra os níveis redondos no gráfico. Eles também são chamados de níveis psicológicos , bancários ou de jogador principal. Nestes níveis, há uma verdadeira luta entre touros e ursos, o acúmulo de muitas ordens, o que leva ao aumento da volatilidade. O indicador se ajusta automaticamente a qualquer instrumento e período de tempo. Quando o nível 80 é rompido e testado, nós compramos . Quando o nível 20 é rompido e testado, nós vendemos . A meta é 00. Atenção. Dev
FREE

This indicator calculates buy and sell signals by using MACD indicator on two timeframes. MACD is a trend-following showing the relationship between two moving averages of the closing price. The MACD is calculated by subtracting the 26-period Exponential Moving Average (EMA) from the 12-period EMA.The result of that calculation is the MACD line. A nine-day EMA of the MACD called the "signal line".
This indicator has 2 modes to calculate the buy/sell signals: - MACD crosses 0 line - MACD cro
FREE

Updates
9/12/2023 - If you are looking for the Spock EA, I don't sell it anymore. DM me for more info.
24/10/2023 - Check out my other products. Starting to roll out some EAs & indicators based on this range.
Currently there is no MT5 version. I am using MT4 myself.
So I will spend my time mostly to develop more extensive stats for the Stats version and maybe even an EA. But I might develop a MT5 version.
All depends on the demand. Meaning, the more people request it, the bigger the
FREE

A combined indicator of two famous indicators: RSI , Bollinger Bands Can be used in all currency pairs Can be used in all time frames with many signals Very simple and fast to use
Description:
This indicator is made from the combination of RSI and Bollinger Bands indicators
As you can see, it shows good signals and is worth using and testing
We hope you are satisfied with this indicator
Settings: show past show candle: Displays the number of candles that the indicator calculates.
For
FREE

Introduction Excessive Momentum Indicator is the momentum indicator to measure the excessive momentum directly from raw price series. Hence, this is an extended price action and pattern trading. Excessive Momentum Indicator was originally developed by Young Ho Seo. This indicator demonstrates the concept of Equilibrium Fractal Wave and Practical Application at the same time. Excessive Momentum detects the market anomaly. Excessive momentum will give us a lot of clue about potential reversal and

Tired of plotting trendlines? The PZ TrendLines indicator applies a mechanical approach to the construction of trend lines for you! [ Installation Guide | Update Guide | Troubleshooting | FAQ | All Products ] It can draw up to 18 trendlines Trendlines can be optionally based on fractals Each line represents a breakout level Each trendline can be broken or rejected Configurable amount of lines Configurable colors
Support I am happy to provide free products but given my limited time, they come
FREE

This Weis Wave Volume indicator is a tool to help traders identify the current price trend. Understanding volume can provide insight into a market's behavior to help you determine its overall health. The most important rule is this: volume precedes price. Typically, before a market price moves, volume comes into play. It has 2 main colors histogram which are green and red. – Green indicates an upward wave. The more the price increases, the bigger the green volume gets. – The red color shows a d
FREE

PrecisionWedge Detector X
Description: PrecisionWedge Detector X is an innovative indicator designed to identify and analyze wedge patterns on financial charts with unparalleled accuracy and precision. Developed using advanced algorithms, this indicator provides traders with a powerful tool to detect potential trading opportunities based on wedge formations. Key Features: Automatic Wedge Detection: Powered by sophisticated algorithms, PrecisionWedge Detector X automatically scans price data to
FREE

The VWAP Level indicator is a technical analysis tool that calculates the weighted average price for the traded volumes of a specific asset. The VWAP provides traders and investors with the average price of an asset over a specific time frame.
It is commonly used by investors to compare data on "passive" trading operations, such as pension funds and mutual funds, but also by traders who want to check if an asset has been bought or sold at a good market price.
To calculate the VWAP level we
FREE

Fibonacci Sniper MT4 - No Repaint
Features:
- Indicator sends signals and notifications on key Fibonacci Retracement and Fibonacci Extensions Levels
- Once the buy/sell signal is set, targets ( TP1 TP2 TP3 )and stop loss levels are drawn by the indicator.
- Fibonacci Calculations and Custom Patterns are identified by the last 3 or 5 Zig Zag exterum.
- You can easily identify key harmonic patterns like Gartley, Bat, Butterfly and Crab patterns.
Important Settings: - Choose the Zig
The indicator highlights the value in "over Sold" and "over Bought" zones. in addition, arrow indicates the return of the value from the extreme zone. Indicator can be easily customized by the user including change of colors, with, levels and arrows. Combination with other market signals and analysis is necessary and provides more stable results. Alert is also available for user.
FREE

Break It Down is based on the Directional Movement Index and tells the trader when a market trend probably maxed out and ready to fall back. This pattern is more predictable when we apply this system only when the market is rallying but within a trading range. Because traders Sell off in fear the market often moves faster when declining! When this happens, good moves can occur. As traders are no longer interested in the trend, the volume will decline and the price will usually fall back on itsel
FREE
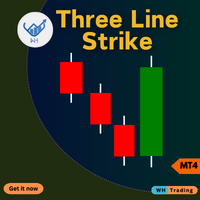
Indicador de ataque de três linhas para MetaTrader 4 (MT4). Esta ferramenta avançada foi projetada para ajudá-lo a identificar possíveis reversões no mercado com precisão e facilidade.
Quer você seja um trader iniciante ou experiente, este indicador pode aprimorar suas decisões comerciais e maximizar seus lucros. Contact me after purchase for guidance Características principais: Sinais de reversão precisos : detecte possíveis reversões de tendência com base no padrão de ataque de três
Advanced Order Block Breaker Scanner
This Scanner is free to download but is dependent on you owning the advance order block breaker indicator. Need to purchase the indicator here: https://www.mql5.com/en/market/product/59127
MT5 version: https://www.mql5.com/en/market/product/62769
The Scanner will show you on a single chart all the timeframes (M1 to Monthly) with their own status for the indicator: advance order block breaker Scan all time frame and all symbol: breaker's smart al
FREE

Description :
VWAP (Volume-Weighted Average Price) is the ratio of the value traded to total volume traded over a particular time horizon. It is a measure of the average price at which pair is traded over the trading horizon. Read More.
All Symbols and All Timeframes are supported.
Indicator Inputs :
VWAP Mode : Mode of VWAP Calculation. Options can be selected : Single,Session,Daily,Weekly,Monthly
Volumes : Real Volumes,Tick Volumes
Price Type : Used price for ca
Mars 12 is a Pullback indicator is a powerful indicator of Pullback trade for any par and any timeframe. It doesn't requires any additional indicators for the trading setup.The indicator gives clear signals about opening and closing trades.This Indicator is a unique, high quality and affordable trading tool. Can be used in combination with other indicators Perfect For New Traders And Expert Traders Low risk entries. Never repaints signal. Never backpaints signal. Never recalculates signal.

Trend Plus Trendplus Indicator Time Frame: Suitable for any time frame. Purpose: Trend Prediction. Blue and red candle indicate the buy and sell call respectively. Buy: When the blue candle is formed buy call is initiated. close the buy trades when the next red candle will formed. Sell: When the Red candle is formed Sell call is initiated. close the Sell trades when the next blue candle will formed. Happy trade!!
FREE

The " YK Find Support And Resistance " indicator is a technical analysis tool used to identify key support and resistance levels on a price chart. Its features and functions are as follows:
1. Displays support and resistance levels using arrow lines and colored bands, with resistance in red and support in green.
2. Can be adjusted to calculate and display results from a specified timeframe using the forced_tf variable. If set to 0, it will use the current timeframe of the chart.
3. Uses t
FREE

Session Killzone Indicator
Indicator that helps you to identify the killzone times of both London and NewYork sessions which usually is the most times for high volatility and taking liquidity from the market. Killzone times are configurable through indicator parameters. The indicator adjusts the range of the killzones based on the daily trading range.
FREE

Uma vantagem que lhe falta para se tornar um profissional.
Siga o sistema passo a passo que detecta os movimentos mais poderosos!
Explore os modelos de mercado que oferecem a oportunidade de obter lucros significativos com base em uma estratégia testada e testada.
Aproveite sua importante vantagem Você tem acesso a um indicador único que o levará ao próximo nível!
Envie todas as perguntas para mensagens privadas!
Os benefícios que você obtém Um algoritmo único baseado no movimento de
FREE

The Forex Trend Scanne r is a powerful tool designed to revolutionize currency strength analysis. It caters to traders of all levels, offering guidance on what to trade and in which direction. This versatile model allows users to include any currency-related symbol, such as Gold (XAU/USD), Silver (XAG/USD), and even Bitcoin (BTC/USD). With compatibility across all time frames and default settings covering 28 major pairs, it provides comprehensive insights for informed trading decisions. Whether
FREE

Turbo Trend technical analysis indicator, which determines the direction and strength of the trend, and also signals a trend change. The indicator shows potential market reversal points. The indicator's intelligent algorithm accurately determines the trend. Uses only one parameter for settings. The indicator is built for simple and effective visual trend detection with an additional smoothing filter. The indicator does not redraw and does not lag. Take profit is 9-10 times larger than stop loss

Ultimate Trend Finder (Multi Pair And Multi Time Frame) : ---LIMITED TIME OFFER: NEXT 25 CLIENTS ONLY ---46% OFF REGULAR PRICE AND 2 FREE BONUSES ---SEE BELOW FOR FULL DETAILS Institutional traders use moving averages more than any other indicator. As moving averages offer a quick
and clear indication of the institutional order flow. And serve as a critical component in the decision making
within numerous institutional trading rooms.
Viewing the market through the same lens as the i

Download the free version here. Divergence Divergence refers to when the price of a currency pair moves in one direction while the trend indicator is moving in the opposite direction. With divergence, there can be positive and negative signals. Divergences in Forex trading are quite common signals of technical analysis. These are basic early Forex signals indicating the trend reversal and filter false signals. Application of this indicator It is usually not easy to detect divergences by the t
FREE

Apresentamos-lhe um indicador que não só melhora o aspeto visual do gráfico, como também lhe confere um carácter vivo e dinâmico. O nosso indicador é uma combinação de um ou mais indicadores de média móvel (MA), que mudam constantemente de cor, criando um aspeto interessante e colorido.
Este produto é uma solução gráfica, por isso é difícil descrever o que faz em texto, é mais fácil de ver descarregando-o, além de que o produto é gratuito. Este indicador é adequado para bloggers que queiram c
FREE
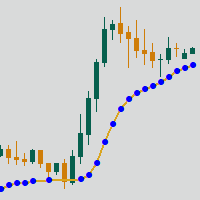
Adaptive Moving Average (AMA) is a trend indicator using moving average and market noise filter. Indicator feature are blue and red points, showing the power of trend. Recommendations for trading: Auxiliary Indicator Detecting trend Detecting power of trend Detecting potential reversal points Main indicator Shows entry points for swing trading Serves as dynamic support and resistance Recommendations for use: Any instrument Any timeframe Input parameters: Period - AMA period Fast Period - fast
FREE

O indicador exibe gráficos minimizados de qualquer símbolo em qualquer período de tempo. O número máximo de gráficos exibidos é 28. Os gráficos podem ser localizados na janela principal e inferior. Dois modos de exibição: velas e barras. A quantidade de dados exibidos (barras e velas) e os tamanhos dos gráficos são ajustáveis. Parâmetros: Corner - exibe o canto inicial (selecionado da lista) CandleMode - modo de exibição: verdadeiro - velas, falso - barras ShowLastBid - ativa / desativa a última
FREE

Suporte e Resistência Ômega
Um indicador exclusivo para estratégias de comprar na baixa e vender na alta **
Previsor de preço futuro de alta precisão para alta ou baixa de qualquer produto para gráficos semanais, diários, de 4 horas e até de 1 hora **
https://youtu.be/HIt75qICSeM
Este indicador pode ser usado apenas para negociação ou em combinação com outras estratégias Fornecendo níveis de preços altos e baixos para o alvo esperado e pontos de inflexão, suporte e resistência exclusi
FREE

This is the free version of the Supply&Demand + Trendline + Trend tool. This version works only with EURCHF! You find the full version here: https://www.mql5.com/en/market/product/67274
PAAIOS stands for Price Action All In One Solution. And that is the purpose of the Indicator. It should give you a tool to improve your trading decisively because you get the crucial information at a glance. The indicator simplifies the search for strong signals. It shows trend lines, demand and s
FREE
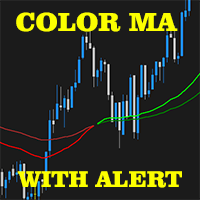
2 EMA Color Alerts Indicator is a powerful tool for any trader looking to stay on top of market movements. By using exponential moving averages (EMAs), this indicator can provide early warning signals for potential market reversals and trend changes. One of the key features of the 2 EMA Color Alerts Indicator is its customizable alerts. With this feature, traders can set their own parameters for receiving alerts, such as the EMA periods and the type of alert (e.g. sound, pop-up, email). This al
FREE

The indicator builds a Renko chart in the sub window for the current symbol. The bars are formed from live data and the desired bar size can be set in the inputs tab. Most importantly, because the Renko chart only uses price to construct bars and ignores time, the indicator can be applied to any time frame and same results can be achieved. Recommended usage
As Renko charts are famous for eliminating noise so traders can use this tool to see clear picture of the trend to help their analysis, ent
FREE
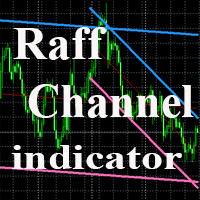
The indicator plots a trend channel using the technique by Gilbert Raff. The channel axis is a first-order regression. The upper and lower lines show the maximum distance the Close line had moved away from the axis line. Therefore, the upper and lower lines can be considered as resistance and support lines, respectively. A similar version of the indicator for the MT5 terminal
As a rule, most movements of the price occur within a channel, going beyond the support or resistance line only for a s
FREE

Note: This is an Arrows Only Indicator. Get paid scanner or free TDI extra indicators here: https://abiroid.com/product/tdi-sharkfin-arrows-and-scanner/
About:
This is a TDI Arrow Indicator for finding the Shark Fin Pattern. It will show an arrow in the current bar if RSI sharkfin is finished forming in previous bar.
What is Shark Fin TDI Pattern?
Upper Shark Fin: In TDI Indicator when Green RSI breaks above a certain level and also breaks upper Volatility band and then breaks below that
FREE
This indicator was developed to facilitate the analysis of BBMA Oma Ally strategy In the previous version, it's almost similar scanner indicator was built the indicator identifies the basic pattern of BBMA Oma Ally (reentry, MHV, rejection EMA50 and extreme) To get information on the chart, please download the BBMA Labels indicator via this link In BBMA Oma Ally advanced strategy, to validate reentry on a major timeframe, a "full setup" is required on a lower timeframe
The full setup structu
FREE

Introducing the Consecutive Green/Red Candle Alert Indicator for MT4 - Your Trend Spotting Companion! Are you ready to take your trading to the next level? We present the Consecutive Green/Red Candle Alert Indicator, a powerful tool designed to help you spot trends and potential reversals with ease. Whether you're a new trader looking for clarity in the market or an experienced pro seeking additional confirmation, this indicator is your trusted companion. Key Features of the Consecutive Green/Re
FREE
O indicador de tendência AI é um indicador comercial inovador criado usando tecnologias avançadas de rede neural para determinar com precisão a direção da tendência nos mercados financeiros. Este indicador fornece aos traders uma ferramenta de tomada de decisão intuitiva e informativa, baseada em uma análise aprofundada da dinâmica dos preços.
Características principais:
Rede Neural para Previsão de Tendências: O indicador de tendências de IA usa uma poderosa rede neural treinada em uma gra
FREE
O Mercado MetaTrader oferece um local conveniente e seguro para comprar aplicativos para a plataforma MetaTrader. Faça download de versões de demonstração gratuitas de Expert Advisors e indicadores a partir do seu terminal para testes no Testador de Estratégia.
Teste os aplicativos em diferentes modos para monitoramento do desempenho e assim fazer um pagamento para o produto que você deseja, usando o sistema de pagamento MQL5.community.
Você está perdendo oportunidades de negociação:
- Aplicativos de negociação gratuitos
- 8 000+ sinais para cópia
- Notícias econômicas para análise dos mercados financeiros
Registro
Login
Se você não tem uma conta, por favor registre-se
Para login e uso do site MQL5.com, você deve ativar o uso de cookies.
Ative esta opção no seu navegador, caso contrário você não poderá fazer login.