Conheça o Mercado MQL5 no YouTube, assista aos vídeos tutoriais
Como comprar um robô de negociação ou indicador?
Execute seu EA na
hospedagem virtual
hospedagem virtual
Teste indicadores/robôs de negociação antes de comprá-los
Quer ganhar dinheiro no Mercado?
Como apresentar um produto para o consumidor final?
Indicadores Técnicos para MetaTrader 4 - 7

TD Combo is better when you have sharp directional moves, because it requires only thirteen price bars from start to finish compared to TD Sequential which needs at least 22 bars. The criteria for a Setup within TD Combo are the same with those required for a Setup within TD Sequential. The difference is that the count starts at bar 1 of the setup and not from bar 9 and TD Combo requires four conditions to be satisfied simultaneously.
Requirements for a TD Combo Buy Countdown
- Close lower

Super Trend Pro Its simple. as you see in product picture you can find out how it work. We Use Several MA and use Statistics and Probability inside the code to draw nice, great and pure Trend Detection. Do you like it? Yes me too Here, Super trend pro with 100% non-repainting indicator
Input Parameter is clear and simple.
Inputs Period 1 --------------------------->>>> Use for mathematical calculating
Period 2 --------------------------->>>> MA Period
Indicator Type ------------------->>>>
FREE

Scanning Multi Symbols Scalping Signals based on 3 kinds of Market Analysis methods. Trend, Signal, and Reversator. And each method consists of its own multi timeframes algorithm functions. Summarized to become clear signals direction BUY/SELL, including the signals strength scoring and sending message to all available alert tools. Displayed on a User Friendly and customizable Dashboard. Size, colors, coordinates, highlight, hidden/show and more. Base Timeframe: M15. And M5 to Daily to confirm

VR Cub é um indicador para obter pontos de entrada de alta qualidade. O indicador foi desenvolvido para facilitar cálculos matemáticos e simplificar a busca por pontos de entrada em uma posição. A estratégia de negociação para a qual o indicador foi escrito tem provado a sua eficácia há muitos anos. A simplicidade da estratégia de negociação é a sua grande vantagem, o que permite que até mesmo os comerciantes novatos negociem com sucesso com ela. VR Cub calcula os pontos de abertura de posição e

Este é sem dúvida o indicador de reconhecimento automático de formação de preço harmônico mais completo que você pode encontrar para a MetaTrader Platform. Ele detecta 19 padrões diferentes, leva as projeções de Fibonacci tão a sério quanto você, exibe a Zona de Reversão Potencial (PRZ) e encontra níveis adequados de stop loss e take-profit. [ Guia de instalação | Guia de atualização | Solução de problemas | FAQ | Todos os produtos ]
Detecta 19 formações harmônicas de preços diferentes
Tr

O indicador exibe lucro (perda) no símbolo atual. Você pode arrastar e soltar livremente a linha para exibir o lucro ou perda atual.
Parâmetros Calculation in money or in points — calcule o lucro/perda em pontos ou dinheiro. Add pending orders to calculate — leve em consideração os pedidos pendentes nos cálculos. Magic Number (0 - all orders on symbol) — número mágico, caso seja necessário avaliar pedidos específicos. Offset for first drawing (points from the average price) — deslocamento
FREE

O indicador exibe o perfil de volume horizontal na área especificada (BOX) e o volume máximo (POC).
Características do produto. 1. Você pode usar ticks ou apenas preço. 2. Espaçamento de grade adaptável (M1-MN). 3. Etapa de pesquisa adaptável de alto volume (mediana) dependendo do tamanho da caixa. 4. Cor camaleão automática para linhas e botões de caixa. 5. Várias caixas, fáceis de criar e excluir. 6. 70% de área de volume (ativar nas configurações). 7. Há um alerta para tocar na linha de vol
O indicador RSI Pro Analyzer é uma ferramenta poderosa projetada para traders que buscam tomar decisões informadas em vários intervalos de tempo simultaneamente. Este indicador utiliza o RSI para fornecer sinais de sobrecompra, sobrevenda e tendência , facilitando a identificação de oportunidades de entrada no mercado. Sua principal vantagem é a facilidade de leitura graças aos códigos de cores claros e distintos para indicar as diferentes condições do mercado.
O indicador exibe valores RSI e
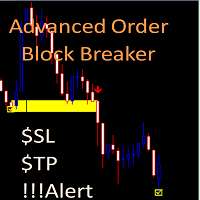
Advanced Order Block Breaker The price has been reduced from 65$ discount to 35$!!!
Dashboard: Free scanner to monitor All pairs and timeframes here: https://www.mql5.com/en/market/product/59151 MT5 version Indicator: https://www.mql5.com/en/market/product/62769 Market structure changes as price reverses And filter with all import features built inside one tool. Breaker's smart algorithm detects the reverses, filters out market noise and gives entry signals with exit levels. Test th

** All Symbols x All Timeframes scan just by pressing scanner button ** ***Contact me after purchase to send you instructions and add you in "RSI scanner group" for sharing or seeing experiences with other users.
Introduction RSI divergence is a main technique used to determine trend reversing when it’s time to sell or buy because prices are likely to drop or pick in the charts. The RSI Divergence indicator can help you locate the top and bottom of the market. This indicator finds Regular div
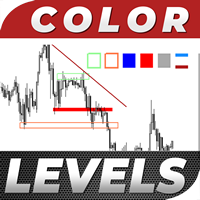
Color Levels is a convenient tool for traders using a Trendline and a Rectangle in their technical analysis. It allows setting two empty rectangles, three filled ones, and two tredlines. The indicator parameters are very simple and divided into numbered blocks: The ones beginning with 1 and 2 - empty rectangle (frame) parameters; 3, 4, and 5 - filled rectangle parameters; 6 and 7 - trendline parameters. Simply click a desired object and it will appear in the upper left corner. Main Adjustable Pa
FREE
The Omega Trend Indicator is an advanced tool that has been specifically designed to detect market trends early, and follow them efficiently. The indicator draws two lines. The main (thicker) Trend Line represents the presumed lower or upper volatility limits of the current market trend. A break in the main Trend Line indicates a potential reversal or shift in the movement of the trend. The Trend Line also indicates the best point to place a stop loss order. In Omega Trend Indicator, the Trend L
FREE

Индикатор строит блоки заказов (БЗ) по торговой системе (ТС) Романа. Поиск блоков осуществляется одновременно на двух таймфремах: текущем и старшем (определяемым в настройках). Для оптимизации и игнорирования устаревших блоков в настройках задается ограничение количества дней в пределах которых осуществляется поиск блоков. Блоки строятся по правилам ТС состоящем из трех шагов: какую свечу вынесли (что?); какой свечой вынесли (чем?); правило отрисовки (как?).
FREE

The GGP Chandelier Exit Alert MT4 Indicator is a volatility-based indicator that identifies stop loss exit points for long and short trading positions. Chandelier Exit is based on the Average True Range (ATR) indicator. It is designed to keep traders in the trend until a defined trend reversal happens. Traders use CE to maximize their returns in a trade and make stop loss exit decisions. It is based on the principle that a trend reversal is highly probable when the price of an asset moves ag

With PA analyzer you will see a different perspective of price action , once you have unlocked the full potential of it, this tool will be essential part of your trading system. PA Analyzer enables market price analysis and automatically marks support and resistance in all time frames. This indicator makes it easy to see whether the price is in range or trend, and generates dynamic profit take targets for the current time frame and the next higher time frame. This allows you to find target co
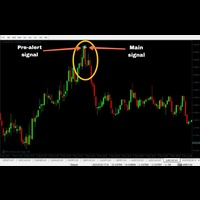
100% non-repaint MT4 indicator with advance pre alert
Recommended candle timeframe M15
Trade expiry 15 minutes
Call buffer 0
Put buffer 1
Intrabar
Pros Neural Network based Advance price action algorithms Advance trend filtering algorithms Advance consolidation filtering algo
Pre-alert (get ready) signals
Non-delay indications
Auto-trading supported
100% Non repaint
100% No lag
No recalculating
Lifetime license
Cons Very few signals
Instructions to use
1 Do not ente
FREE

The Inversion Fair Value Gaps (IFVG) indicator is based on the inversion FVG concept by ICT and provides support and resistance zones based on mitigated Fair Value Gaps (FVGs). Image 1
USAGE Once mitigation of an FVG occurs, we detect the zone as an "Inverted FVG". This would now be looked upon for potential support or resistance.
Mitigation occurs when the price closes above or below the FVG area in the opposite direction of its bias. (Image 2)
Inverted Bullish FVGs Turn into P

It identifies the pivot, support, and resistance price levels of the selected timeframe and then draws lines onto the chart. FEATURES: Option to specify the Timeframe Period in the PivotSR calculation. Option to display the PivotSR of the last candle, of every candle, or of the current candle. Options for displaying labels, line thickness, and line color. PivotSR can be interpreted as reversal levels or past price reactions that can be used as the basis for current price analysis. Some traders b
FREE

Market Heartbeat in your hand! Introduction The Market Heartbeat indicator with a special enhanced algorithm (volume, money flow, cycle of market and a secret value) is a very repetitive trend finder with a high success rate . Interestingly, this Winner indicator indicates that the trend has changed its direction or the end of a trend retracement or even appears at the range market. The Market Heartbeat can use in scalping trading or trend trading. It finds immediately with alarm, notification a

Scanner Dashboard for Best Heiken Ashi VQZZ Arrows Indicator here: https://www.mql5.com/en/market/product/45900 Updated description and all extra indicators/templates are here: https://abiroid.com/extras/best-heiken-ashi-vqzz-system-extras
Please note that if you are using too many pairs/timeframes, then VQZZ calculations might slow down the dashboard. So be careful not to use too many VQZZ Higher timeframes if you are using too many pairs.
Dashboard Symbols:
Please refer to Screenshots f
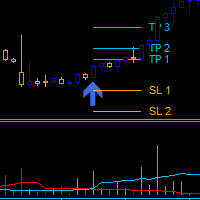
Dark Power is an Indicator for intraday trading. This Indicator is based on Trend Following strategy, also adopting the use of an histogram to determine the right power . We can enter in good price with this Indicator, in order to follow the strong trend on the current instrument. The histogram is calculated based on the size of the bars and two moving averages calculated on the histogram determine the direction of the signal
Key benefits
Easily visible take profit/stop loss lines Int

PTS - Buscador de Compras por Divergência da Precision Trading Systems
O Buscador de Divergência de Precisão foi projetado para encontrar fundos de mercado com precisão milimétrica e frequentemente o faz.
Na análise técnica, a arte de escolher fundos geralmente é muito mais fácil do que escolher topos; este item foi projetado precisamente para essa tarefa. Após a identificação de uma divergência de alta, é prudente esperar que a tendência se reverta antes de comprar. Você pode usar um mínim

Professional histogram (PH) é uma ferramenta altamente eficiente e confiável para negociar forex, CFDs e opções binárias.
O PH é fácil de usar e configurar para iniciantes e comerciantes experientes.
Ao contrário da maioria dos indicadores, o Professional Histogram encontra tendências mais longas e fornece menos sinais falsos.
Quando uma compra ou um sinal de venda aparece, um alerta é acionado, permitindo que você abra uma posição em tempo hábil e evite ficar sentado no seu PC o tempo

Did You Have A Profitable Trade But Suddenly Reversed? In a solid strategy, exiting a trade is equally important as entering.
Exit EDGE helps maximize your current trade profit and avoid turning winning trades to losers.
Never Miss An Exit Signal Again
Monitor all pairs and timeframes in just 1 chart www.mql5.com/en/blogs/post/726558
How To Trade You can close your open trades as soon as you receive a signal
Close your Buy orders if you receive an Exit Buy Signal. Close your Sell orde
O indicador mostra o volume vertical. As configurações têm 2 coeficientes para determinar o alto e o extremo, e 1 para determinar o baixo volume. Um algoritmo semelhante também é usado no indicador UDP1 Volume Pixel . Quando o volume especificado é detectado, o histograma é colorido na cor correspondente. A largura do histograma é selecionada automaticamente, dependendo da escala. Como regra geral, o preço reage ao volume máximo e mínimo. Mas é necessário usar sinais de confirmação.
Parâmetro
FREE

A simple indicator that automatically highlights all FVGs (Fair Value Gaps) formed on the chart, as well as FVGs on history. It is possible to select colors for FVGs of different directions (long or short), select the time interval, select the color of middle point and you can also choose whether to delete filled FVGs or leave them on the chart (the option is beneficial for backtesting). The indicator can be very useful for those, who trade according to the concept of smart money, ICT, or simply
FREE
A Powerful Solution That Analyze The Renko And The Standard Charts And Filters Out The Noise Or The Narrow Range Moves And Gives Entry And Exit Signals. A statistics window is included to show the net points gained from these signals taking into considerations the spread of the pair and to evaluate accurately the overall performance.
Advantages It Provides A Clear Buy and Sell signals with take profit and stoploss levels. A Statistical analysis that offers an accurate image of net gained point

The Slope Scanner is a Multi-Currency, Multi-Timeframe scanner of The Slope indicator. It calculates the slope of the price, and displays its direction for each symbol and each timeframe on a display board. Check Video Below For Live Trading Demonstration. Get a 7-Day Free Trial Version: Click Here (Full Access to The Indicator for 7 Days) Key Features: Allows you to see Multiple Murrency signals from one chart Calculates the slope of the Pair on All Timeframes Get a Currency Slope Strength

The Accurate Gold indicator is a user-friendly tool that is both intuitive and simple to use , regardless of traders' level of experience. It is designed for traders seeking precise signals on the M5 timeframe in the gold market. This indicator employs advanced mathematical algorithms to analyze price movements and volume dynamics, generating accurate buy and sell signals. The distinctive features of this indicator, including its non-repainting nature, provide traders with valuable insights in

Direct translation of blackcat's L3 Banker Fund Flow Trend Oscillator. Get push notifications on your phone app when a signal bar has formed. Historical signals are shown with a red checkmark right on the main chart. Indicators uses two data calculations to check for a positive cross below 25% level. Long signals only! For any further questions feel free to contact me directly. Including requests for product improvements.

Contact me after payment to send you the user manual PDF file. Introduction Introducing the Wolfe Pattern Indicator, a powerful tool designed to help traders identify and capitalize on the elusive Wolfe Pattern in financial markets. This innovative indicator uses advanced algorithms to scan for the Wolfe Pattern in all symbols and time frames, providing traders with a unique edge in the market. How to trade with the Wolfe Pattern The Wolf Pattern is a rare and lucrative trading opportunity that
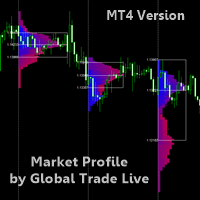
READ THE DESCRIPTION ITS IMPORTANT - ONLY TAKES 2 MINUTES - THIS IS A TOOL NOT A TRADING STRATEGY
Market Profile By Global Trade Live A Market Profile is a graphical representation that combines price and time information in the form of a distribution. A Market Profile is used to determine elapsed time, number of ticks and volumes traded at specific prices, or over a price interval, over a given period. A Market Profile also makes it possible to identify prices accepted or rejected by the ma
FREE
A top-quality implementation of the famous Super Trend indicator, which needs no introduction. It is completely loyal to the original algorithm, and implements many other useful features such as a multi-timeframe dashboard. [ Installation Guide | Update Guide | Troubleshooting | FAQ | All Products ] Easy to trade It implements alerts of all kinds It implements a multi-timeframe dashboard It is non-repainting and non-backpainting Input Parameters
ATR Period - This is the average true range peri
FREE

Fractals Dynamic Fractals Dynamic – é um indicador fractal livre modificado de Bill Williams, no qual você pode definir manualmente o número de barras à esquerda e à direita, construindo assim padrões exclusivos no gráfico. Agora, todas as estratégias de negociação baseadas ou baseadas no indicador Fractals Dynamic terão um sinal adicional.
Além disso, os fractais podem atuar como níveis de suporte e resistência. E em algumas estratégias de negociação para mostrar os níveis de liquidez. Par
FREE

Info Plus is a simple tool that displays the current status on an asset class. The information displayed by Info Plus includes: Bid Price The high and low of the day. Candle time left. Current spread. Selected timeframe. Asset class selected (Symbol). Pip value. Open Positions. Total pips booked. Pips per trade. Session times (they may not be accurate and are subject to changes). Date and time.
How it Works When loaded onto any chart, Info Plus automatically gets the following parameters: Bid
FREE

This indicator identifies and displays zones, as it were areas of strength, where the price will unfold. The indicator can work on any chart, any instrument, at any timeframe. The indicator has two modes. The indicator is equipped with a control panel with buttons for convenience and split into two modes. Manual mode: To work with manual mode, you need to press the NEW button, a segment will appear. This segment is stretched over the movement and the LVL button is pressed. The level is displayed

O indicador desenha automaticamente os níveis de Fibonacci com base no indicador ZigZag, sessões de negociação, fractais ou velas (incluindo períodos de tempo não padrão: ano, 6 meses, 4 meses, 3 meses, 2 meses) (Retração Fibo Automática). Você pode escolher qualquer período de tempo superior para o cálculo de Fibonachi. Os níveis são redesenhados sempre que a barra atual fecha. É possível ativar alertas ao cruzar os níveis especificados.
Você também pode analisar níveis no histórico. Para fa

FREE Heiken Ashi Smoothed indicator is fully adjustable, easy to use and comes with possibility to access the indicator via iCustom function so you can use it in your own trading software. Indicator can also pop up alerts when signal changes or send push notifications. For Metatrader 5 version click here: https://www.mql5.com/en/market/product/70825 For detailed information click: >>HERE<< Features
Easy to use Accessible via iCustom Fully adjustable Alerts and Push notifications Possi
FREE

Big summer sale. Save up to 40% on my products. ADR dashboard - save 9$! The intention of the dashboard is to provide a quick overview of the daily, weekly and monthly range of configured assets. In "single asset mode" the dashboard shows you possible reversal points directly in the chart, thus making statistics directly tradable. If a configured threshold is exceeded, the dashboard can send a screen alert, a notification (to the mobile MT4) or an email. There are various ways of using this inf
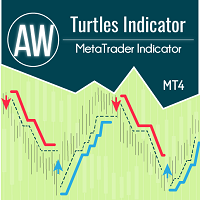
O indicador funciona de acordo com o sistema Turtle e classicamente assume um intervalo de tempo de 20 e 55 velas. Uma tendência é monitorada durante um determinado intervalo de tempo. A entrada é feita no momento da quebra do nível de suporte ou resistência. O sinal de saída é um rompimento de preço na direção oposta da tendência do mesmo intervalo de tempo. Vantagens:
Instrumentos: pares de moedas, ações, commodities, índices, criptomoedas Prazo: Classicamente D1, também adequado para traba
FREE

In statistics, Regression Channel is a approach for modelling the relationship between a scalar response (or dependent variable) and one or more explanatory variables (or independent variables).We Applied relative strength index(rsi) values to develop regression models of various degrees in order to understand relationship between Rsi and price movement. Our goal is range prediction and error reduction of Price divergence , thus we use Rsi Regression

Negociação dinâmica:
1.pp pivot
2. r1 r2 r3, s1 s2 s3 Necessary for traders: tools and indicators Waves automatically calculate indicators, channel trend trading Perfect trend-wave automatic calculation channel calculation , MT4 Perfect trend-wave automatic calculation channel calculation , MT5 Local Trading copying Easy And Fast Copy , MT4 Easy And Fast Copy , MT5 Local Trading copying For DEMO Easy And Fast Copy , MT4 DEMO Easy And Fast Copy , MT5 DEMO
Recomendamos fortemente indicadore
FREE

What if you could see trouble from far, just imagine having some ability to foresee danger. This indicator has the ability to see consolidations before they are clear to everyone else. In the market everything is always fun until the market starts consolidating and often times by the time people realise it it's often too late. This Indicator will spot consolidations very fast and let you know at the top right of the chart so that you can either avoid losses by stopping to trade using trend follo
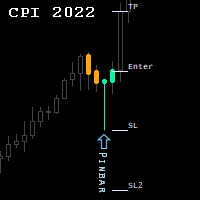
Candlestick Patterns Indicator.
NEW! FREE Candlestick Patterns Expert Advisor > https://www.mql5.com/en/market/product/105634?source=Site +Profile
The Indicator draws colored candlestick patterns, their description and future levels of Stop Loss / Take Profit. Combined with other market analysis, can greatly improve trading results. Indicator can be highly customized by the user including change of colors, fonts, levels, candle sizes etc...
developed, tested and optimized on " VantageM
FREE
This is an Elliot Waves Indicator Arrow for Major Swing's On default settings i have tested this on all Major 28 pairs and i have had great results Check out the comments section for more pictures and details. AFTER PURCHASE PLEASE WRITE A COMMENT SO I CAN SEND YOU Your Free GIFT
(Includes NON REPAINT VERSION OF SIGNAL)
you have a few options of placement and a few different options for colors. this is a very simple and effective signal.

This information indicator will be useful for those who always want to be aware of the current situation on the account. The indicator displays data such as profit in points, percentage and currency, as well as the spread for the current pair and the time until the bar closes on the current timeframe.
VERSION MT5 - More useful indicators
There are several options for placing the information line on the chart:
1. To the right of the price (runs behind the price);
2. As a comment (in the up
FREE

The indicator returning pivot point based trendlines with highlighted breakouts . Trendline caculated by pivot point and other clue are ATR, Stdev. The indicator also includes integrated alerts for trendlines breakouts and foward message to Telegram channel or group if you want. Settings · Lookback bar: Default 200 is number of bar caculate when init indicator. · Length: Pivot points period · Slope Calculation Method: Determines how this lope is calcula

ENIGMERA: O núcleo do mercado https://www.enigmera.com
Introdução Este indicador e sistema de negociação é uma abordagem notável aos mercados financeiros. ENIGMERA utiliza os ciclos fractais para calcular com precisão os níveis de suporte e resistência. Mostra a autêntica fase de acumulação e dá direcções e objectivos. Um sistema que funciona quer estejamos numa tendência ou numa correção.
Como é que funciona? O ENIGMERA é composto por três linhas: a linha de suporte/resistência, a linha

The Market Structures MT4 indicator finds and shows the Break Of Structures (BoS) pattern on the chart. The pattern is an important part of the Smart Money Concepts (SMC) system.
The appearance of a pattern means that the price breaks the last peak of an uptrend, or the last bottom of a downtrend. This indicates a change in the existing trend structure and the beginning of a new movement.
BOS is a technical analysis tool used to identify trend reversals.
The set of input parameters is simple
FREE
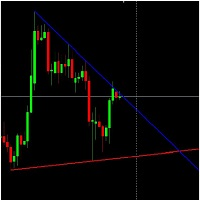
Standard Trend Lines (Automatic).
This indicator draws highly accurate trend lines.
It draws Trend Lines automatically.
This Trend Lines indicator was made by observing lot of discussions made about Trend Lines in forum.
The Trend Lines can also be used to create Expert Advisor.
Latest valid Trend Lines are drawn on Chart.
Trend Lines Work on basis of OHLC price data.
FREE

The balance of supply and demand is a simple and effective market analysis method. The supply and demand diagram can show you in advance, even before the trend reversal, where the supply ends and the demand is already emerging, where the demand ends and the supply is emerging, while substantially increasing the probability of making a deal in the right direction and with a high profit factor.
Indicator Signals The indicator uses the price/volume values to generate signals: ED – excess demand.
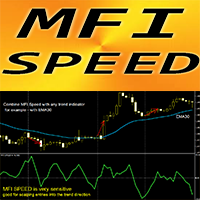
Indicador Forex "Velocidade MFI" para MT4
O cálculo deste indicador é baseado em equações da física. MFI Speed é a primeira derivada da própria MFI O Money Flow Index (MFI) é um oscilador técnico que utiliza dados de preços e volumes para identificar zonas de sobrevenda e sobrecompra. A velocidade da MFI é boa para escalar entradas dinâmicas na direção da tendência principal Use-o em combinação com um indicador de tendência adequado, por exemplo EMA padrão (como nas fotos) O indicador MFI Spe
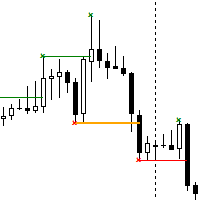
The Break of Structure (BoS) and Change of Character indicator is a powerful tool designed to identify significant turning points in price movements on financial charts within the MetaTrader 4 platform. By analyzing price action, this indicator highlights instances where the market shifts from a trend to a potential reversal or consolidation phase. Utilizing sophisticated algorithms, the indicator identifies breakouts where the structure of price movement undergoes notable changes. These breakou
FREE

Tick Sound will play a different sound each time a tick is triggered. When the tick is higher than the previous one, an "UP" sound is triggered When the tick is lower than the previous one, a "DN" sound is triggered The main sound i chose is a Sheppard Tone : it's an audio effect that simulates and endless ramping sound up or down which is perfect for this task. but you can also select 14 different pre-made up/dn sounds or use your own sounds
There are three main parameters for Tick Sound Ask
The leading indicator calculates the most likely places for a trend reversal or stop.
An example of use is shown on the screenshot using the ChainVector trading panel ( https://www.mql5.com/en/market/product/49155 ).
Support: https://www.mql5.com/en/channels/TrendHunter This indicator can be used as a stand-alone trading system or as an additional part of another trading system. Support : https://www.mql5.com/en/channels/TrendHunter
More products are available here: https://www.mql5.com
ChartSync Pro MT4 is an indicator, designed for the MetaTrader 5 trading terminals. It enables the trader to perform better multi-timeframe technical analysis, by synchronizing symbols and objects into virtually unlimited charts. Built by traders for traders! Telegram Premium Support - Dd you purchase the Chart Sync indicator and need a bit of help? Send us a screenshot with your purchase and your Telegram ID so we can add you to our premium support Telegram group. The indicator has various

FOLLOW THE LINE GET THE FULL VERSION HERE: https://www.mql5.com/en/market/product/36024 This indicator obeys the popular maxim that: "THE TREND IS YOUR FRIEND" It paints a GREEN line for BUY and also paints a RED line for SELL. It gives alarms and alerts of all kinds. IT DOES NOT REPAINT and can be used for all currency pairs and timeframes. Yes, as easy and simple as that. Even a newbie can use it to make great and reliable trades. NB: For best results, get my other premium indicators for more
FREE

Próxima geração de zonas automatizadas de oferta e demanda. Algoritmo novo e inovador que funciona em qualquer gráfico. Todas as zonas estão sendo criadas dinamicamente de acordo com a ação do preço do mercado.
DOIS TIPOS DE ALERTAS --> 1) QUANDO O PREÇO ATINGE UMA ZONA 2) QUANDO UMA NOVA ZONA É FORMADA
Você não recebe mais um indicador inútil. Você obtém uma estratégia de negociação completa com resultados comprovados.
Novas características:
Alertas quando o preço ati

The indicator analyzes the volume scale and splits it into two components - seller volumes and buyer volumes, and also calculates the delta and cumulative delta. The indicator does not flicker or redraw, its calculation and plotting are performed fairly quickly, while using the data from the smaller (relative to the current) periods. The indicator operation modes can be switched using the Mode input variable: Buy - display only the buyer volumes. Sell - display only the seller volumes. BuySell -
FREE
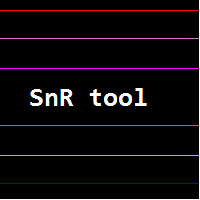
This is a SnR tool.
It is built based on the body candle.
It is a multi timeframe indicator.
There is a powerful scalabar for vertical line slides to limit the candle bars.
Color for each line can also be changed.
It can detect:
1. Support && Resistance
2. Support become Resistance && vice versa
3.Support become Resistance become Support && vice versa
It also can be used for trading tools and studies on SnR *New Version avaiable

MACD Scanner provides the multi symbols and multi-timeframes of MACD signals. It is useful for trader to find the trading idea quickly and easily. User-friendly, visually clean, colorful, and readable. Dynamic dashboard display that can be adjusted thru the external input settings. Total Timeframes and Total symbols as well as the desired total rows/panel, so it can maximize the efficiency of using the chart space. The Highlight Stars on the certain matrix boxes line based on the selected Scan M
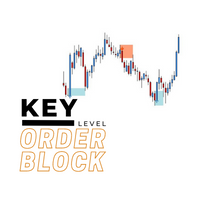
The key level order block indicator automatically draws order-blocks for you on the chart. The indicator compliments any strategy and can also be used as an independent tool. It can work with smart money concepts, harmonic patterns, supply and demand, flag patterns, Quasimodo strategy and many more.
Advantages
The key level order block DOES NOT RE-PAINT, giving you confidence when a signal appears and also helps when looking back. The key level order block includes an on/off button on th

The PERFECT TREND HIT creates BUY and SELL perfect trend arrow signals based on ADX EMA AND RSI And all filters inbuilt with accurate trend entries. Furthermore, the indicator and template display the trend direction, strength, and trade recommendation for independent price charts. ROCK WITH THE TREND Moreover, it shows the final trade recommendation to BUY or SELL with all filters and displays that information as arrow signals and pop up in the chart. The indicator works well for new and

MACD Intraday Trend é um indicador desenvolvido por meio de uma adaptação feita do MACD original criado por Gerald Appel na década de 1960. Ao longo dos anos de negociação, observou-se que alterando os parâmetros do MACD com as proporções de Fibonacci alcançamos uma melhor apresentação da continuidade dos movimentos de tendência, sendo possível detectar de forma mais eficiente o início e o fim de uma tendência de preço. Devido à sua eficiência na detecção de tendências de preços, também é possív
FREE

The indicator is designed to work on any trading platform. The program is based on proprietary algorithms and W.D.Ganna's mathematics, allowing you to calculate target levels of price movement based on three points with the highest degree of certainty. It is a great tool for stock trading. The indicator has three buttons: NEW - call up a triangle for calculation. DEL - delete the selected triangle. DELS - completely remove all constructions. The probability of achieving the goals is more than 80

Little Trade Helper is a fine tool for manual traders.
It can quickly draw trendlines and support/resistance lines that will help to identify good price levels for placing entries, or set SL/TP levels.
This indicator will not provide any direct buy/sell signals or notification, but is purely meant for those traders that want to get a quick graphical help in finding important levels on the chart. When switching to another timeframe, the indicator will immediately adjust and re-calculate all
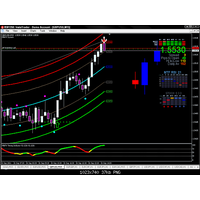
Gravity Timing Indicator -GTI-
O indicador GTI é o indicador mais fácil e preciso até agora. ele usa suporte e resistência de forma gravitacional. Trabalhar nele é tão fácil, ele consiste em 7 linhas, sendo as mais poderosas as linhas mais baixas e mais altas, então quando o indicador rebate, é o melhor momento para entrar.
funciona em todos os pares sem exceção
para o período de tempo, prefiro períodos de tempo pequenos, como 5 minutos e 15 minutos para escalpelamento.
FREE

The Missing Edge You Need To Catch Breakouts Like A Pro. Follow a step-by-step system that detects the most powerful breakouts!
Discover market patterns that generate massive rewards based on a proven and tested strategy.
Unlock Your Serious Edge
Important information here www.mql5.com/en/blogs/post/723208
The Reliable Expert Advisor Version
Automate Breakout EDGE signals using "EA Breakout EDGE" Click Here Have access to the game changing strategy that will take your trading to the n

The "M1 scalping signal" is a scalping indicator designed for the M1 timeframe. The indicator displays arrows on the chart indicating price reversal points. A red arrow indicates a price reversal to a sell position, while a green arrow indicates a price reversal to a buy position. It can be used on all currency pairs. Advantages: No Redrawing: The indicator does not redraw signals on historical data, ensuring stable analysis. Ease of Use: It is easy to configure and visualizes important reversal
How To Trade
Execute your trades in 3 Easy Steps!
Step 1: Trade Setup Entry Buy in Signal price and TP1 in price indicator, You can use trailing stop in TP1. Entry Sell in Signal price and TP1 in price indicator, You can use trailing stop in TP1. Success Rate ≥ 75% 100:25 Step 2: Set Stop Loss Stop loss BUY ----> You can set stop loss on Line Order SELL. Stop loss SELL ----> You can set stop loss on Line Order BUY. Step 3: Set Take Profit Option 1: Take profit on TP1. Option 2: Partial take
FREE
Saiba como comprar um robô de negociação na AppStore do MetaTrader, a loja de aplicativos para a plataforma MetaTrader.
O Sistema de Pagamento MQL5.community permite transações através WebMoney, PayPay, ePayments e sistemas de pagamento populares. Nós recomendamos que você teste o robô de negociação antes de comprá-lo para uma melhor experiência como cliente.
Você está perdendo oportunidades de negociação:
- Aplicativos de negociação gratuitos
- 8 000+ sinais para cópia
- Notícias econômicas para análise dos mercados financeiros
Registro
Login
Se você não tem uma conta, por favor registre-se
Para login e uso do site MQL5.com, você deve ativar o uso de cookies.
Ative esta opção no seu navegador, caso contrário você não poderá fazer login.