Mp --- eu -- intermediate and long range
Mp -- 6.27.2011
639 pm edst
only for giggles at the moment, but black box now showing UPSIDE of 4497 on any timeframe over the 5 minute --- not a trade to take at the moment,(although I did) but coming by golly
PRESENT UPSIDE IS 4329, 4333 for the shorter term AND MOVING UP !!
1105am, edst -- seems we have discovered more upside making the H4 prediction from last nite not so outrageous after all
SHORT TERM TREND CHART
UPSIDE ---------------- 4296
DOWNSIDE ----------- 4236
Today, 06:50 PM
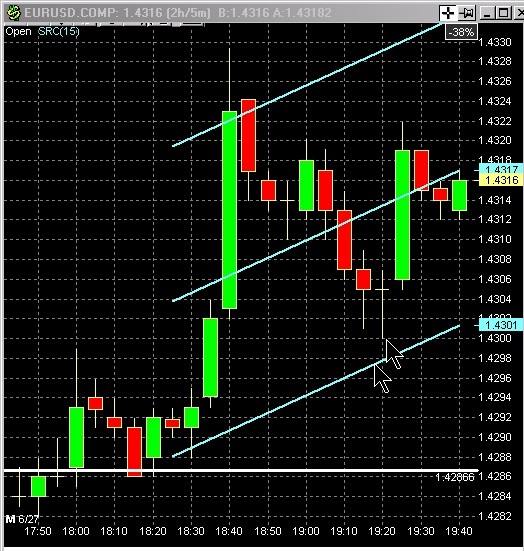
GONNA show you something thats probably cost a LOT of you many dollars and its the "fake" on a short (in this case.
assuming you were at the top blue lines and went short, you could easily say the price would go to 4302, which is the bottom blue line, but IT DIDNT !
and thats the FAKE --- the price comes down and STOPS AND REVERSES before it reaches your TP point and at this point, most throw the short away and go long --- and heres what happens !
the long position DOES NOT continue going up but REVERSES and now heads DOWN to what you knew was its original TP point (which you bailed at a loss) AND the long, with the price now moving away from the TP you selected, is now in drawdown and giving you a loss.
and of course, the short now continues to EXACTLY ITS TP POINT, forcing you to grab a new short if theres time, and you now have to wait a few hours for the LONG to reach its TP Point, assuming you didnt throw that one away also.
Its standard issue, done every minute and if you dont watch out, you end up with 30 cents in the account, either thru stoplosses that get set off or simply throwing away what you think is a bad trade.
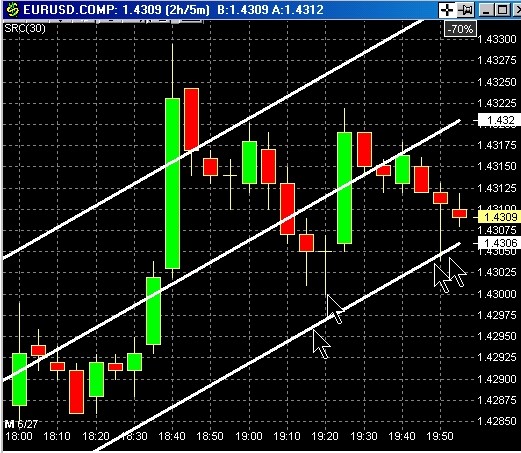
the second chart shows the price hitting the original TP after all the fakes are done.
MP -- 6.28.2011 -- Overnites And Tomorrows
DAILY CHART
UPSIDE ------------------ 4312 with 4321 and 4330 showing --- finishing the move as i posted below would be 4402 which i fully expect to happen
DOWNSIDE ------------- 4289
BLACK BOX TRADES
UPSIDE ------------------- 4306(one minute), 4310 (5 minute), 4314 (15 minute), 4335 (30 minute), 4340, 4344 (H1), 4486 (H4)
DOWNSIDE --------------- 4291 (one minute), 4242 (5 minute), 4238 (15 minute), 4253 (30 min), 4250 (H1), 3757 H4 -- NOT expected tonite or for a few days, but we WILL get there. --
LONGER TREND CHART
UPSIDE -------------------- 4296 presently showing with 4321 possible
DOWNSIDE ---------------- 4295, 4277, 4268, 4252
Mp -- 6.28.2011 morning becomes
1028AM, EDST
UPSIDE CONTINUES TO INCREASE AS NOTED IN POSTS BELOW WHILE DOWNSIDE FOLLOWS THE UPSIDE CURVE
PRESENT DOWNSIDE IN THE 4357 AREA BUT WILL DROP A BIT WHILE UPSIDE IS AS POSTED AND DEFINITELY HEADING THERE.
KEEP IN MIND WE SHALL TOP ON THE UPSIDE MOVE AND CONTINUE THE BEARISH OVERALL TREND, HEADING INTO THE 3700's and very probably lower.
enjoy and trade well manually, cause with an EA you NEVER know where you should be heading.
now for the other side of this assistance --- literally for years I have tried to tell you that while an EA can help for those who simply cannot learn to trade, IT IS NOT THE ANSWER ESPECIALLY IN TODAYS MARKET post the new regs !
I would bet with the whippiness and manner of trading (especially in the afternoon session in the USA, there is a lot of "traders" losing like mad because of lack of knowledge.
at one time I tried to teach you all, but soon realized that while I firmly believe this to be one of the simplest ways of making a LOT of money, most of you simply wanted the easy, dilletantish way and didnt want to put any work into it --- well, most of you probably found out that was the recipe to losing everything you had and passed on to the great burial ground of aspiring traders, and you probably well deserved what happened.
Now, I still teach those who WANT VERY MUCH to learn, but this "signal service" if we shall call it that is my second attempt at helping --- unfortunately, at least to my mind, its a pure give away and teaches none of you ONE SINGLE THING about trading, and so I put forth these figures, proven correct over months at this point, with much division in my own mind.
I'm a trader, and at this point a pretty good one averaging 21 thousand one lot pips per week with not much work, but it took some time to get here, so I have NO NEED of becoming a merchant and selling this information, so i give it to you freely at this time, at least until I get sick and tired of hand feeding you profit while you STILL have no idea of how to trade.
its my dilemma and it will be worked out along the way, BUT YOU SHOULD LEARN TO TRADE and STOP depending on all sorts of silly EA's that are probably getting you into serious trouble at this point.
mp
Mp -- 6.28.2011 early afternoon
634pm, edst
4427 is a nice upside figure on the short range trend chart --- DOWNSIDE remains the same
PIVOT at 4334
6.28.2011 - Today, 12:31 PM
129 pm, edst
BLACKBOX TRADES (short term)
UPSIDE ------------ 4356 (one minute), 4379 5 min chart, 4375 15 min chart, 4351 30 min chart, 4570 h4 CHART and dont hold your breath but that also will happen
DOWNSIDE 4340 (one min chart), 4331 (5 min chart), 4326 (15 min chart), 4317 + 4311 for 30 and 60 chart)
4432 shows for TOPSIDE move with reversal VERY strong possible at that point, but remember main trend is STILL DOWN and at least 4017 will be hit soon.
unfortunately, most of this wont happen till the evening session, as now they are simply moving the price around the court like the Harlem Globtrotters.
Mp -- 6.30.2011 -- overnites and tomorrows
MP --- 6.30.2011 -- OVERNITES AND TOMORROWS
BLACK BOX TRADES
UPSIDE ---------------------- 4511 (one min), 4524(5 min), 4535 (15 min), 4979 (30 + 60 min ??)
DOWNSIDE ----------------- 4472 (one min), 4469 (5 min), 4486 (15 min)
SHORT TERM TREND CHART
DOWNSIDE ----------------- 4497, 445, 4467, 4441, 4427
UPSIDE ---------------------- 4495, 4513, 4523, 4535, 4548, 4554,4563
DAILY CHART
UPSIDE ---------------------- 4629
MP -- 6.30.2011 -- Mid Day Madness
present Short Term Trend Chart
Downside ----------------- 4503
Upside ---------------------- 4536
Mp -- 07.01.2011 -- overnites and tomorrows
Today, 11:57 PM
DAILY CHART
UPSIDE ------------------------ 4576, 4594
DOWNSIDE ------------------- 4437 (pivot at 4423)
DAILY CHART
UPSIDE ------------------------ 4576, 4594
DOWNSIDE ------------------- 4437 (pivot at 4423)
BLACK BOX TRADES
UPSIDE -------------------------- 4531, 4533, 4572 (one and 5 minute), 5010(H4)
DOWNSIDE ---------------------- 4503 (one and 5 min), 4467 (15 + 30 min), 4387 (60 min), 4436 (H4)
we should hit the lowest of the downside trades next week, earliest perhaps being tuesday
614am, edst -- 7.01 --- maybe not wait till next week for some of those lower numbers
I would bet with the whippiness and manner of trading (especially in the afternoon session in the USA, there is a lot of "traders" losing like mad because of lack of knowledge.
at one time I tried to teach you all, but soon realized that while I firmly believe this to be one of the simplest ways of making a LOT of money, most of you simply wanted the easy, dilletantish way and didnt want to put any work into it --- well, most of you probably found out that was the recipe to losing everything you had and passed on to the great burial ground of aspiring traders, and you probably well deserved what happened.
Now, I still teach those who WANT VERY MUCH to learn, but this "signal service" if we shall call it that is my second attempt at helping --- unfortunately, at least to my mind, its a pure give away and teaches none of you ONE SINGLE THING about trading, and so I put forth these figures, proven correct over months at this point, with much division in my own mind.
I'm a trader, and at this point a pretty good one averaging 21 thousand one lot pips per week with not much work, but it took some time to get here, so I have NO NEED of becoming a merchant and selling this information, so i give it to you freely at this time, at least until I get sick and tired of hand feeding you profit while you STILL have no idea of how to trade.
its my dilemma and it will be worked out along the way, BUT YOU SHOULD LEARN TO TRADE and STOP depending on all sorts of silly EA's that are probably getting you into serious trouble at this point.thank you for taking the time to start this very informative thread MP!
I have read some other posts here at tsd where others didn't believe your how
many pips that you claim to make each day/week... but I say, why can't someone
earn that much? Why would someone claim this over and over while trying to teach
and not sell anything? 200,000 usd in a week,, great job ,, now I will follow
your thread and the upsides and downside numbers while I figure it out...
Just a question for you if you dont mind...
do you set pending orders at these upside/downside numbers?
I do not trade with ea, so I am not at liberty to comment on the subject,
but I am willing to "LEARN TO TRADE" !
Today, 11:57 PM
DAILY CHART
UPSIDE ------------------------ 4576, 4594
DOWNSIDE ------------------- 4437 (pivot at 4423)
DAILY CHART
UPSIDE ------------------------ 4576, 4594
DOWNSIDE ------------------- 4437 (pivot at 4423)
BLACK BOX TRADES
UPSIDE -------------------------- 4531, 4533, 4572 (one and 5 minute), 5010(H4)
DOWNSIDE ---------------------- 4503 (one and 5 min), 4467 (15 + 30 min), 4387 (60 min), 4436 (H4)
we should hit the lowest of the downside trades next week, earliest perhaps being tuesday
614am, edst -- 7.01 --- maybe not wait till next week for some of those lower numbersHi MP
I would like to join your thread if I may. Trading for 1.5yrs and struggling, I use harmonic patterns/channals, only recently have I managed to turn a little corner. Btw the channal indy I downloaded from the 'join the dots' thread, you might be able to clear something up for me on this channal, it has a red round circle with a red dot in the middle of it, do you know what this is?
My charts tell me that for eur/usd we have a bullish reversal on it's way so am currently short, would you agree? I look forward to learning from you.
- Free trading apps
- Over 8,000 signals for copying
- Economic news for exploring financial markets
You agree to website policy and terms of use
1117 am , edst
SHORT TERM TREND CHART
UPSIDE ------------- 4290, 4291, 4305 (4343 showing)
downside --------------4233
MP -- 6.27.2011 -- Overnites And Tomorrows - Today, 12:07 AM
DAILY CHART
UPSIDE --------------- 4233, 4251,
DOWNSIDE ---------- 4046, 4041, 4092, 3992, 3983, 3962 shows
BLACK BOX
UPSIDE ------------------ 4032 (1min(, 4132 (5min), 4134(15min), 4182(30 min), 4182(60 min), 4495 ?? (H4)
DOWNSIDE -------------- 4115 (1min), 4093(5 min), 4107 (15 min), 3752 ??(30 min), 3752 ??(60 min), 3976 (H4)
SHORT TERM TREND
UPSIDE ------------------- 4232, 4140, 4142, 4145
DOWNSIDE --------------- 4116, 4095, 4084
LONG TERM TREND
UPSIDE -------------------- 4216, 4211 (pivot), 4258
DOWNSIDE --------------- 4125, 4099, 4061 and showing are 3988, 3974
DAILY TREND CHART
UPSIDE --------------------
DOWNSIDE --------------- 4140, 4126, 4107, 4093, 4048 and possible 4020