适用于MetaTrader 5的付费EA交易和指标 - 96

Little Swinger (Best choice for passive income lovers)
Developed by RobotechTrading key features:
Financial Freedom Back testing results will match with real live trading results Proper TP and SL Controlled Risk Highly Optimized settings Running on our Real Live Accounts Little Risk, Little Drawdown, Little Stress, Little BUT stable income, just set and forget. Strategy:
Not Indicator based No Martingale No Grid No Repaint strategy Safe and Secure calculation of Live data and than t
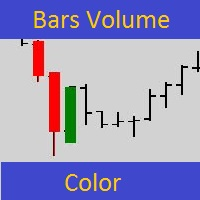
Все знают какую большую роль играют объемы в трейдинге. Основной индикатор объемов чаще всего находится в дополнительном окне и визуально плохо воспринимается. Этот простой инструмент разработан для быстрого и наглядного представления заданного объема непосредственно на графике с котировками для лучшей наглядности. Можно сразу оценить в каких местах на графике сконцентрировались большие объемы. Индикатор подкрашивает свечи по заданному объему от хая или лоу свечи до цены закрытия свечи. Если све
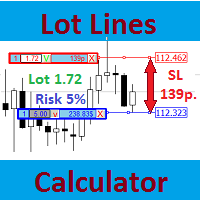
Большинство профессиональных трейдеров декларируют строгое соблюдение управления рисками. Этот простой инструмент разработан для быстрого расчета размера лота, чтобы торговать в соответствии со следующими базовыми правилами риск-менеджмента: Максимально допустимый риск устанавливается как фиксированный процент от общего количества средств на счете (например, 1-2%). Риск измеряется расстоянием в пунктах между открытием ордера и установленным стоп-лоссом. Так как для новичков всегда затруднительно
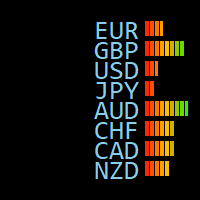
介绍 这是一个交易助手,信息面板类的指标,集合货币统计信息、账户统计信息、仓位信息、服务器和本地时间、货币强弱、K线剩余时间、支撑和阻力线,服务器时间偏移,货币波动率等功能。 可用于所有类型的账户和货币。 优秀的性能,占用的资源非常少 可以自定义位置、颜色、字体大小 任意模块可单独显示或禁用
特性
1.货币统计信息
日线的Open、High、Low、Close 日线当天的High-Low 日线昨天的High-Low 5天的平均波动 10天的平均波动 20天的平均波动 50天的平均波动 当天的涨跌幅 当天的涨跌的Points 当前点差 货币和当前价位
UseSidebar = true; SideFontSize = 10; XLocation = 90; 水平方向上的位置 YLocation = 20; 垂直方向上位置 SideXGap = 90; 水平方向上的间距 SideYGap = 19; 垂直方向上间距
OpenColor1 = clrLime; OpenColo
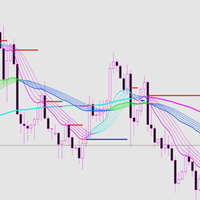
This indicator has good trend malleability and a good trend resistance support line. Index characteristics The color changes, following the trend of different levels . The support and resistance line means that the price follows or reverses.
Basic display A price tag showing historical support and resistance. Shows the approximate recommended range of historical entry positions, as well as take-profit and stop-loss recommendations, and target forecasts. Display the judgment of the current dire

METATRADER 5 的警报向上 - 向下
当价格离开 UP 和 DOWN 线之间的区域时,该指标会生成警报。
您可以生成各种类型的警报,例如:
> 声音
> 留言框
> 在专家框中留言
> 邮件(之前配置)
> 推送通知(先前配置)
线条必须从指标属性配置,而不是从线条属性配置,因为如果从线条属性完成,finonacci 可能会受到影响。
在这些设置中,您可以更改颜色、线条样式和宽度。 线条必须从指标属性配置,而不是从线条属性配置,因为如果从线条属性完成,finonacci 可能会受到影响。
在这些设置中,您可以更改颜色、线条样式和宽度。 线条必须从指标属性配置,而不是从线条属性配置,因为如果从线条属性完成,finonacci 可能会受到影响。
在这些设置中,您可以更改颜色、线条样式和宽度。

币安未来的 Mt5 机器人(专家)
该系统在币安期货市场上运行。
您可以轻松地将其集成到您自己的代码中以实现操作自动化。
提供手动操作面板。
对冲模组兼容。
所有操作都可以在屏幕上手动完成。
这是同时控制多种加密货币的最有效方式。
屏幕是带有币安屏幕的模板类型。 您可以从链接下载模板文件。
https://drive.google.com/file/d/1WHqGhym0QIK31l7kwfit9_tXb7YbqSuT/view?usp=sharing
此程序需要安装。
https://www.mql5.com/tr/market/product/68694
https://www.mql5.com/tr/market/product/73887
参数
API 密钥 = 您的币安 API 密钥
秘钥 = 你的币安秘钥
*您应该允许来自工具菜单 >> 选项 >> 智能交易系统的 WebRequest 并添加 URL: https://fapi.binance.com/
单击链接以查看屏幕截图。

如果您还没有了解 Strat 交易策略 ,现在就去谷歌搜索吧。我保证这不会浪费您的时间,而且无论您是否使用它,您都可能会学到一些新技巧。 好的,现在您知道 TheStrat 是什么,您将能够理解该指标可以为您做什么。 主要特征
简而言之,该指标将: 显示所有支持的时间范围的时间范围连续性 支持两种时间视图,即日交易者和波段交易者 显示任何 4 个连续时间帧的全时间帧连续性何时到位 显示每个时间范围的当前蜡烛状态 显示所有时间范围内的当前形态(如果有) 显示有效和可操作模式 每 5 秒更新一次(可从 1 秒开始配置) 允许您单击面板以在选定的交易品种和时间范围内打开图表 您可以选择用于打开图表的图表模板 您选择要显示的组和这些组中的符号 该指标显示您经纪商支持的任何交易品种的所有关键 Strat 元素、时间框架连续性、当前模式和当前蜡烛状态的快照概览。它针对所有受支持的时间范围执行此操作,因此您可以准确地看到市场上正在发生的事情。 您可以根据需要对符号进行分组,并选择与每个组相关的按钮的标题。同时在屏幕上显示特定类型的所有符号可以让您发现整个组的相似之处,从而有助于您的分析。 有关配

Moving Wizard indicator will guide you to work with Trend and give pure Entry point depending on crossing on the chart it work on all currency and all Timeframe you can use it daily or scalping or swing its good with all and This indicator you can make it your strategy i work on it on H1 Timframe and make a good money you can take alook on it and you see a great resault on chart .Gold moving is to Know the Trend of price other moving below it mean we looking to sell orders . if above it we loo

1. 这是什么. 这是一个 非常严谨 的以展示不同市场交易时段的指标。它展示了主要市场:NewYork, London, Frankfurt, Sydney, Wellington, Tokyo. 非常重要: 不同的市场夏令时起止日期不同,而一个市场的交易时段又会因夏令时冬令时而不同。 同时,北半球国家、南半球国家夏令时制度也是不同的,以及一个市场在不同的年份,夏令时的制度也是变化的。 比如: 纽约夏令时制度: 1987年-2006年:4月第一个星期日02:00 --> 10月最后一个星期日02:00 2007年-至今: 3月的第二个星期日02:00 --> 11月的第一个星期日02:00 纽约外汇市场交易时段(UTC+3): 15:00-22:00(夏令时); 16:00-23:00(冬令时)。 所以交易时段,必须要考虑历史上所在城市、所处年份的夏令时日期、以及对应的交易时段,否则交易时段是错误的。但是如果这些都是手工设置,非常的繁琐,本程序就可以自动设置。 你可以参阅我的博客了解主要国家的夏令时

1. 这是什么. 这是一个 非常严谨 的以展示不同市场交易时段的指标。它展示了主要市场:NewYork, London, Frankfurt, Sydney, Wellington, Tokyo. 非常重要: 不同的市场夏令时起止日期不同,而一个市场的交易时段又会因夏令时冬令时而不同。 同时,北半球国家、南半球国家夏令时制度也是不同的,以及一个市场在不同的年份,夏令时的制度也是变化的。 比如: 纽约夏令时制度: 1987年-2006年:4月第一个星期日02:00 --> 10月最后一个星期日02:00 2007年-至今: 3月的第二个星期日02:00 --> 11月的第一个星期日02:00 纽约外汇市场交易时段(UTC+3): 15:00-22:00(夏令时); 16:00-23:00(冬令时)。 所以交易时段,必须要考虑历史上所在城市、所处年份的夏令时日期、以及对应的交易时段,否则交易时段是错误的。但是如果这些都是手工设置,非常的繁琐,本程序就可以自动设置。 你可以参阅我的博客了解主要国家的夏令时

INTRODUCTION KMBC Trader EA is based on 4 famous indicators that can help you get an annual profit of over 90% in the last 14 years. Focusing on long-term trading strategies may potentially help your account growing year by year.
INDICATORS The 4 famous indicator is: Keltner Channel Moving Average Bollinger Bands Cumulative Sum
FEATURES Built-in trade management Indicator parameter customization
HOW TO SET UP Symbol: EURUSD ( specialize in EURUSD) Timeframe: D 1 Lot: Amount for a new

The multi-currency indicator Currency Strength Index Plus can be set on the chart of any of the 28 currency pairs formed by 8 currencies (USD, EUR, GBP, AUD, NZD, CAD, CHF and JPY), for example, on EURUSD, H1. The indicator is designed to determine the direction of strength of each of the 8 currencies relative to each other. Using the strength and its direction of two opposing currencies, it is possible to make a currency pair with the best trading potential. Currency indices have flexible smoot
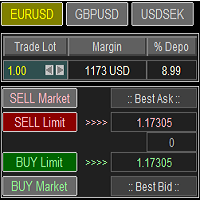
Trade Panel with Loss Breaking for MT5
Multi-instrumental trading panel with the function of transferring the stop loss of positions to loss breaking.
Has the following distinctive properties:
All trading parameters and panel operation are set in the settings. The traded position volume (lot size) is quickly changed. The required margin and the percentage of the required margin of the current deposit for the specified lot size are displayed. Shows profit when take profit is triggered and lo
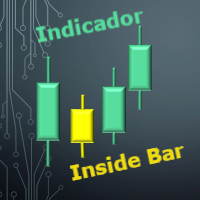
Identificador de Inside Bar O Inside Bar é uma formação de vela de reversão / continuação, e é um dos padrões de Candle mais operados pelos trader. Esse indicador permite que você identifique um O Inside Bar no gráfico de forma rápida e fácil, lhe permitindo uma tomada de decisão muito rápida e precisa. Sendo ideal para lhe ajudar nas suas diversas estratégias de Day Trade ou swing trade. O visual e a marca registrada da análise gráfica por esse motivo esse indicador conta com 3 opções visuais p
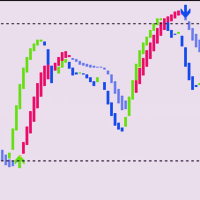
Necessary for traders: tools and indicators Waves automatically calculate indicators, channel trend trading Perfect trend-wave automatic calculation channel calculation , MT4 Perfect trend-wave automatic calculation channel calculation , MT5 Local Trading copying Easy And Fast Copy , MT4 Easy And Fast Copy , MT5 Local Trading copying For DEMO Easy And Fast Copy , MT4 DEMO Easy And Fast Copy , MT5 DEMO
Auxiliary indicators It waits for the hunt, waits for the price limit to appear, waits for

The Asian Session - it is a Secure Automated Software for trade Forex market and indices.
This system detects the ranges between the end of the American session and the beginning of the Asian session, operating in favor of the break, thinking that this break prior to the start of the session occurs because within the Asian session there will be an impulse in favor of the break. breaking off. To adapt to the different schedules of the different brokers, you have to set the closing time of the A

This EA uses the following Built-in indicators: Channels indicator Supply and demand indicator Trend indicator It is based on multi-directional grid system, not the normal martingale you are familiar with. When the price is in supply or demand zones, the EA will wait for a confirmation before entering a position. The confirmation is through the three above indicators together. You don't need to purchase any of the indicators mentioned above if you don't want to see them on the live chart.

Sprocket is an Expert Advisor that implements the scalping principle. A minimum spread is required for correct operation. What is a prerequisite.
There is an opinion that scalping is the lot of beginners. But in fact, it is wrong. In order to conduct a trading operation correctly for himself, a trader needs to learn scalping, otherwise the result may be negative. That is why this bot exists to be an assistant to the trader.
By placing currency fluctuations on time charts with timeframes for
Reversal candles indicator , use in second window with rsi,levels 10-20-50-80-90 so u can see where the reversal candles pop upat the overbought oversold rsi levels.Great oppertunity to get in early and get out at the best moment. Candle turns blue at the 10-20 level "buy" candle turns red at the 90-80 level "sell" Always look at the major trend beore taking a buy or sell!!!
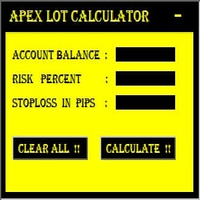
MT5 It Calculates Lot size for Manual Money Management.
If you want any custom feature or want to remove something from this product for your personal use. Please send me a personal message, I'll be happy to do so for you.
Inputs : Account Balance Risk Percent StopLoss in Pips
How to Use it : Put it on the Chart of Currency Pair which wanted to be Calculated Fill up All three Input fields with Desired Details After filling input

Stair shape EA was created after several years of effort and programming by a strong program team. This expert is a fully automated, multi-currency trading system that doesn't require any special skills from you. Just fire up this EA and rest. You don't need to set up anything, EA will do everything for you. But if there is a problem or you do not know what to do, be sure to let me know. I will help you in the shortest possible time. The expected estimated profitability according to the backte

EA 的工作原理是價格與平均值的最大偏差。 這個想法是價格總是力求平衡, 與平均值的任何大偏差都會導致相互作用力 - 反作用力。 入口是在這些偏差上進行的。 这是这个顾问的一个信号示例 https://www.mql5.com/en/signals/2047087 (如果愿意,您可以进行更保守的交易)。
選項: sigal_deviation - 交易開始後的最大偏差; 過濾器:
closeBarOnly - 僅在柱線關閉時工作,僅在柱線關閉後打開和關閉交易;
waitFastMovement - 等待快速下降或下降。 N 是秒數,0 表示禁用。我們僅在從最小值或最大值的形成開始經過 N 秒後才進入。有助於防止在即時價格變動期間進入;
oneOrderInDay - 每天只有一筆未平倉交易。有助於降低白天價格突然變化的風險;
onlySwapPlus - 僅在正交換的方向上工作。建議選擇在任一方向具有正掉期的經紀商。 由於顧問的工作中也使用了對沖算法,因此某些交易可能會長時間保持開放狀態;
sepatateBuyAndSell - 用於計算買賣的單獨算法;

Все паттерны из книги Томас Н. Булковский "Полная энциклопедия графических ценовых моделей" в одном индикаторе со сканером. Cканер включается параметром ScannerMode. При ScannerMode=false индикатор ищет один паттерн (выбирается переменной Pattern). При выявлении паттерна индикатор рисует стрелку, открывает окно сообщений, выполняет push-уведомление. У индикатора много параметров, некоторые их них задействованы всегда, некоторые выборочно. Включите переменную ShowHelp - на графике отобразится по

Save Profit MT5 was created after several years of effort and programming by a strong program team. This expert is a fully automated, multi-currency trading system that doesn't require any special skills from you. Just fire up this EA and rest. You don't need to set up anything, EA will do everything for you. But if there is a problem or you do not know what to do, be sure to let me know. I will help you in the shortest possible time. The expected estimated profitability according to the backte

>>> Index Trader Suite Live Results here >>
>>> Index Trader Suite v.1.0 Presets: Download >>
>>> Index Trader Suite MT4 version available here >> Index Trader Suite is a fully automated trading advisor based on a proprietary trading strategy for the world's most popular and liquid Stock Indices. The system is based on the principles of Price Action and does not use technical indicators to determine the optimal points for opening trades. The strategy is based on 2 key principles

CandleVolume is an indicator that colors bars according to increasing or decreasing volume. You can use it to identify strategic regions of the chart and complete an analysis. White means low volume, yellow means medium volume and red means climax volume. It is a recommended indicator if you like to interpret market contexts and understand how market cycles work.

This is an intra day strategy that is simple and resilient for long term use. There are only a few parameters and the entry is triggered by price action, no indicators are needed. The time of entry and exit will affect the performance, defaults can be used for safe and conservative trading. Broker spreads will also affect the returns, because it is intraday, the frequency of trade is once per day per pair. Do try out the backtest and forward test to verify the results. No grid or martingale
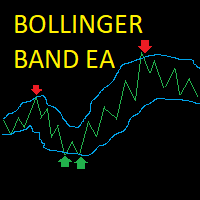
Bollinger Band Scalper EA This EA opens trades when the price hits and bounces off the Bollinger Bands, it closes the trade when it reaches the opposite Bollinger band or if the price reverses into the trailing stoploss. Posisitions are sized dynamically depending on the user's account balance. The EA waits for the price to cross the Bollinger Band and then opens a market order at a set percentage of the bandwidth from the band chosen by the user. The position is sized a percentage of the user's
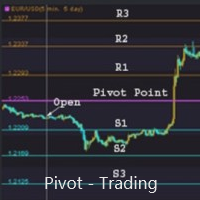
支点交易 : 1.pp 支点 2. r1 r2 r3 , s1 s2 s3 交易实用必备工具指标 波浪自动计算指标,通道趋势交易 完美的趋势-波浪自动计算通道计算 , MT4版本 完美的趋势-波浪自动计算通道计算 , MT5版本 本地跟单复制交易 Easy And Fast Copy , MT4版本 Easy And Fast Copy , MT5版本 本地跟单复制交易 模拟试用 Easy And Fast Copy , MT4 模拟账号运行 Easy And Fast Copy , MT5 模拟账号运行
支点( pivot points) 作为一种交易策略已经很长时间了,最初是场内交易员使用这种方法。使用这种方法通过几个简单的计算就可以了解市场在一天中的去向。 支点法中的支点是一天中市场方向的转向点,通过简单地计算前日的高点、低点和收盘价,可以得到一系列点位。这些点位可能形成关键的支撑和阻力线。支点位,支撑和阻力位被统称为支点水位。 你所看到的市场每天都有开盘价、高价、低价及收盘价(有一些市场是 24 小时开盘,比如外汇市场,通常用 5pm EST 作为开盘和收盘时间)。这些信

Open Risk Profit shows your current risk or possible profit of all open positions. Total open risk is your loss if all positions run into the stop loss.
Total open profit is your profit if all positions reach your take profit.
Total float is your current profit or loss of all positions. The program also breaks down the information into the individual symbols. For example, you can monitor how much is your current profit and your potential risk in EURUSD, no matter how many individual positio

GRat Clusters is an indicator that shows various data in the form of clusters on a price chart: volume, delta, ratio of sales and purchases, etc. It allows you to visually see the market profile in real time and on history at a given depth. Capabilities 1.8 types of cluster data: volume, delta, purchases and sales , volume and delta, imbalance between sales and purchases , volume profile, delta profile, buy and sell profile. 2. A cluster period can be either any available in MT5 timeframe or

Adapted from the award winning international best seller (Short Term Strategies That Work) by Larry Connors and Cesar Alverez in 2008, this concept was retested 10 years after the book published and that will give you an idea of the concept if it still works. Take the last 10 years as walk forward and this strategy is added with a twist to risk management with arbitrary 5% stop loss and exit day counted as calender days instead of trading day. This EA works on dual mode, Long and Short. Origin

Killer Market MT5 is an advisor with a system for "Resolving" a basket of unprofitable orders, a news filter, a filter for open positions on other trading instruments and the function of sending trading signals to your Telegram channel.
The Expert Advisor can be used to restore unprofitable positions on the account as a utility to bring trades to breakeven that you opened with your hands or other Expert Advisors.
Works inside a linear regression channel, input on several conditions. The s

Ing (inguz,ingwar) - the 23rd rune of the elder Futhark ᛝ, Unicode+16DD. Add some runic magic to your trading strategies. The correct marking of the daily chart will indicate to you the successful moments for counter-trend trading. Simple to use, has high efficiency in volatile areas. Be careful in lateral movements.
Signals ᛝ are generated when the main lines of construction intersect.
Red arrow down - recommended sales
Blue up arrow - recommended purchases
rare purple arrows indicate

An indicator of patterns #45 and #46 (Three Falling Peaks and Three Rising Valleys) from Encyclopedia of Chart Patterns by Thomas N. Bulkowski. Parameters: Alerts - show alert when an arrow appears Push - send a push notification when an arrow appears (requires configuration in the terminal) PeriodBars - indicator period K - an additional parameter that influences the accuracy of pattern shape recognition. The smaller the value is, the smoother the row of peaks/valleys should be, so fewer patt
An indicator of patterns #50 and #51 ("Triple Bottoms", "Triple Tops") from Encyclopedia of Chart Patterns by Thomas N. Bulkowski.
Parameters: Alerts - show alert when an arrow appears Push - send a push notification when an arrow appears (requires configuration in the terminal) PeriodBars - indicator period K - an additional parameter that influences the accuracy of pattern shape recognition. The smaller the value is, the smoother the row of peaks/valleys should be, so fewer patterns will

Moving average, moving average (English Moving average, MA) is a general name for a family of functions, the values of which at each point of determining the level of some average value of the original function for the previous period.
CalcPipsOn - In order to add rozruhunok on the chart, you must activate this field.
The previous development of a variant of this indicator differed in that it had an extended functionality for calculating averaging in the set, as well as advanced possibili

An anchored Vwap With Arrows is an indicator that includes a moving average weighted by volume that allows you to plot on a bottom or a top. Usually banks and institutions measure an average price, this average price is a price range where they agree to make a trade. Using the logic of anchored vwap with arrows it is possible to understand that if the price breaks the vwap it means that someone with enough buying and selling power has lost control. You can use vwap anchored with arrows in any ti

Market structures, Market balance, Range breakouts This tools helps to identify areas of market ranges, structures and plots colored boxes on breakout of those areas. User is given the option to receive alerts and notifications on the formation of the blocks. The tool has the ability to become an essential part of a technical trading system or even pure price action trading. Usage:- An essential tool for price action or technical traders. More information in the blog

Horizontal volume bars, Cluster analysis, Volume profile Volume in Range gets information about the accumulated volume in a specified vertical range and period in bars. The received data is then plotted on the chart as rectangular boxes with the volume quantity inside. Usage:- The tool acts as a support resistance levels but most importantly it should be used to check in which direction the price breaks out of the significant levels formed by this indicator and then actions to be taken on correc

The QRSI indicator is one of the most important and well-known indicators used by traders around the world. By its nature, the QRSI indicator is an oscillator, that is, it fluctuates in a certain zone, limited by the maximum (100) and minimum (0) values. Specifically, this indicator works according to an accelerated algorithm, but this is not its only difference. This indicator implements a more advanced calculation based on the Relative Strength Index algorithm. The peculiarity of the implemen

This is an indicator advisor that trades 24 hours a day. This advisor is not for get rich quick This EA does not draw millions of dollars in profit in the tester. I will develop this Expert Advisor and improve the parameters for different pairs and will be happy to discuss trading with this Expert Advisor here in the appropriate section. The Expert Advisor has no installation files. I did this for ease of installation. Timeframe I recommend and use only H1 This is not a scalper. The EA

This is the MetaTrader version of the very popular Squeeze Momentum indicator. It is based of of John Carter's TTM Squeeze volatility indicator, as discussed in his book Mastering the Trade. With this version you can enable notifications when a squeeze is released (push notification, email, or pop-up message). Strategie
Grey dots indicates a squeeze in the current timeframe. Blue dots indicates that the squeeze is released. Mr. Carter suggests waiting till the first blue dot after a grey dot a
An indicator of pattern #55 ("Dead cat bounce, inverted") from Encyclopedia of Chart Patterns by Thomas N. Bulkowski.
Parameters: Alerts - show alert when an arrow appears Push - send a push notification when an arrow appears (requires configuration in the terminal) PeriodBars - indicator period ArrowType - a symbol from 1 to 17 ArrowVShift - vertical shift of arrows in pixels. Note. Arrows appear on a forming bar and do not disappear. It cannot be guaranteed that the indicator recognize
An indicator of pattern #54 ("Dead cat bounce") from Encyclopedia of Chart Patterns by Thomas N. Bulkowski.
Parameters: Alerts - show alert when an arrow appears Push - send a push notification when an arrow appears (requires configuration in the terminal) PeriodBars - indicator period ArrowType - a symbol from 1 to 17 ArrowVShift - vertical shift of arrows in pixels. Note. Arrows appear on a forming bar and do not disappear.
It cannot be guaranteed that the indicator recognizes the pat

An indicator of patterns #24, #25, #26 and #27 ("Head and Shoulders", "Complex Head and Shoulders") from Encyclopedia of Chart Patterns by Thomas N. Bulkowski.
Parameters: Alerts - show alert when an arrow appears Push - send a push notification when an arrow appears (requires configuration in the terminal) PeriodBars - indicator period K - an additional parameter that influences the accuracy of pattern shape recognition. The smaller the value is, the smoother the row of peaks/valleys shoul

This indicator is an oscillators that shows the real strength of 8 main currencies in the Forex market. It recreates a basket of the main currencies and applied a True Strength Indicator on each of them. The calculated real currencies are: EUR - USD - GBP - CHF - JPY - AUD - CAD - NZD. It clearly identifies overbought and oversold ares. From reading the oscillator you can choose the right Forex symbol to trade.
Future versions: I am working on adding alarm and a real buy sell signal, choos
An indicator of patterns #9 and #10 ("Cup with handle") from Encyclopedia of Chart Patterns by Thomas N. Bulkowski.
Parameters: Alerts - show alert when an arrow appears Push - send a push notification when an arrow appears (requires configuration in the terminal) PeriodBars - indicator period K1 - an additional parameter that influences the accuracy of recognition and pattern shape (the lower the value, the smoother the cup edge is) K2 - an additional parameter that influences the accuracy o

Bollinger Bands (BB) are similar to Envelopes. The difference between them is that the boundaries of the Trade Bands (Envelopes) are located above and below the moving average curve at a fixed percentage distance, while the Bollinger Bands are plotted at distances equal to a certain number of standard deviations. Since the magnitude of the standard deviation depends on volatility, the bands themselves adjust their width: it increases when the market is unstable, and decreases in more stable per

Implements a channel based on integrated comparison of moving average values with improved functionality. As a result, the chart displays a channel of deltas of moving averages in the center line and an indentation of the channel boundaries over a specified range.
What is the channel? This is the price range (limited), in which all its dynamics (movement) takes place over a certain period of time. This method is very old, the Forex channel strategy dates back to a long time, when the theory

Implements an oscillator based on a simple comparison of the last two moving average values with improved functionality. As a result, the graph displays the delta of the two moving average values. In the case of a single value, the moving delta is calculated relative to the last two candles, which price of comparison will be specified in the Price parameter. The delta of two values is often used to determine the trend, depending on the length of the moving averages, it can be a longer or sh

Moving average, moving average (English Moving average, MA) is a general name for a family of functions, the values of which at each point of determining the level of some average value of the original function for the previous period.
This indicator is suitable for those who are interested in the classic calculation method but with improved functionality. There is a version for both MT4 and MT5.
Moving averages are commonly used in time series data to smooth out short-term fluctuations a

Implements a channel based on the moving average indicator with improved functionality.
Moving average, moving average (English Moving average, MA) is a general name for a family of functions, the values of which at each point of determining the level of some average value of the original function for the previous period. The channel moves up and down relative to the moving average by a specified number of points.
This indicator is suitable for those who are interested in the classic calc

ChannelVM - is a free channel indicator converted from an indicator for MT4 to an indicator for working in MT5.
In addition to displaying price channels on a chart, it recognizes the simplest patterns - "triangle" and "flag".
Helps to determine further price movement.
Has simple and understandable settings that do not need a description.
When redesigning for the MT5 trading terminal, the logic of work and the appearance of the original indicator were preserved as much as possible.
An indicator of patterns #13 - #20 ("Double Tops" and "Double Bottoms", types Adam-Adam, Adam-Eva, Eva-Adam, Eva-Eva) from Encyclopedia of Chart Patterns by Thomas N. Bulkowski. Adam - sharp tops/bottoms, Eva - flat ones. Parameters: Alerts - show alert when an arrow appears Push - send a push notification when an arrow appears (requires configuration in the terminal) PeriodBars - indicator period K - an additional parameter that influences the accuracy of pattern shape recognition. The smalle
An indicator of patterns #2 and #3 ("Broadening formation right-angled and ascending" and "Broadening formation right-angled and descending") from Encyclopedia of Chart Patterns by Thomas N. Bulkowski.
Parameters: Alerts - show alert when an arrow appears Push - send a push notification when an arrow appears (requires configuration in the terminal) PeriodBars - indicator period K - an additional parameter that influences the accuracy of pattern shape recognition. The smaller the value is, t
An indicator of patterns #1 and #4 ("Broadening Tops" and "Broadening Bottoms") from Encyclopedia of Chart Patterns by Thomas N. Bulkowski. Version 1: bottom, top, bottom, top, top breakout. Version 2: top, bottom, top, bottom, top breakout.
Parameters: Alerts - show alert when an arrow appears Push - send a push notification when an arrow appears (requires configuration in the terminal) Variant1 - show version 1 of the pattern Variant2 - show version 2 of the pattern PeriodBars - indicat

EA automatically analyzes the appearance of bars move volume and catch direction towards buying or selling on the market by using market volatility indicator. The robot automatically analyzes the market volumes and volatility and follows strong supply and demand movements. It smoothly get profits built-in smart mechanism for partial closure of profitable trades. MT4 Version: https://www.mql5.com/zh/market/product/71993 Recommended paires: EURCHF/EURGBP/CADCHF/GBPCHF/AUDCHF . Other paires need

The robot uses one of the most used indicators in Asia:
* ICHIMOKU CLOUD *
There are two trading strategies:
Crossing of Tenkan and Kijun lines and; Kumo lines crossing.
Know our products
Position openings are based on the parameters identified as signals, if you activate all the robot will issue a trading order only if the number of signals is greater than the minimum stipulated by the user.
This Expert Advisor (EA) works on HEDGE (Forex, etc.) and NETTING (Bovespa, etc.) accou

Trading Strategy The Leicester expert advisors uses three exponential moving averages to determine entry positions. Trend Line Slow Moving Average Fast Moving Average Crossovers between the fast moving average and the slow moving average will create sell signals. If prices are below the trend line then only sell positions will be opened. Vice versa for when prices are above the trend line, only buy positions will be opened. Inputs/Features
Candles after cross - Number of candles to wait before

该指标检测平仓,并在发现的区域画上一个彩色的矩形。
该指标的主要思想是,当价格填满图表上的某个区域时,检测出一个平盘。
输入参数:
Color rectangle - 要着色的矩形的颜色。
Bars in rectangle - 矩形中允许的最小条数。
Density in % - 扁平的密度,设置为矩形区域的百分比。 __________________________________________________________________ __________________________________________________________________ ________________________
An indicator of patterns #5 and #6 ("Wedges, ascending, broadening" and "Wedges, descending, broadening") from Encyclopedia of Chart Patterns by Thomas N. Bulkowski.
Parameters: Alerts - show alert when an arrow appears Push - send a push notification when an arrow appears (requires configuration in the terminal) PeriodBars - indicator period ArrowType - a symbol from 1 to 17 ArrowVShift - vertical shift of arrows in pixels ShowLevels - show levels ColUp - color of arrow up СolDn - color

Ferramenta derivada do DR Assistant, a versão Lite conta com recursos semelhantes, mas sendo mais específica em sua aplicação, destina-se exclusivamente ao uso para gestão de ordens abertas a partir de suas funções. Deste modo, quaisquer outras negociações ou posições abertas por outras ferramentas ou manuais serão ignoradas pelo Assitant Lite. Os parâmetros e configurações disponíveis, bem como suas principais funções são: - Take Profit e Stop Loss: duas opções de Steps, em pontos, para ambas a

Fuzzy Predictor EA is based on fuzzy logic strategy based on candlestick analysis , according to number of consecutives long or short candles, percent of long or short candles on a fixed candlestick sample, percent of shadow on this sample or upper and lower shadows on reversal candlesticks for reversal analysis. When the EA analysis all this parameters, it decides, based on its fuzzy strategy, which trade will be better: trend or reversal. Takeprofit and Stoploss is based on candlesticks sample

This is MT5 version of ChristMyHedge . It should be referred to as ChristMyHedge-for-MT5.
Like its MT4 counterpart, the EA/signal runs on Daily (D1) time-frame on 12 pairs: GBPUSD, EURUSD, USDCHF, USDCAD, NZDUSD, USDJPY, AUDUSD, GBPEUR, EURJPY, CADJPY, AUDJPY and EURCHF concurrently, with a recommended minimum of 150USD equity per 0.01 lot size.
Default parameters may be OK, and it's best to run on VPS, if you do not have 24/5 Internet and electricity.
However, the newer version of Christ
If you are looking for a safe ea to start trading in index this is your ea
This ea performs a market entry that starts the algorithm at the time of day that the trader decides. We recommend it to be 1 min after the opening of the index.
It also allows you to say close the operation at the close of the session or keep the cycle open.
It only performs a daily cycle that starts at the scheduled time and remains alive until it exits for profit or session close.
This system is designed t

工作逻辑
Dow Strategy Expert Advisor 是基于 Chalse Dow 的“趋势保持”理论的智能交易系统。
EA 使用选定的 TF,如果前一根柱线上升,则意味着它将打开买入并在前一根蜡烛线的低点后面设置止损(可以设置过滤器以抵消前一根蜡烛线的偏移),然后在当前蜡烛关闭后,止损将再次移动到最低点之外,因此交易将在市场中保持,直到它不会被击倒。
非常适合交易中/长期趋势工具。在开始交易之前,需要对工具进行独立分析以了解趋势的存在。非常适合在从 m1-MN 的所有时间范围内按柱线追踪头寸。
对于交易,股票、货币、金属、指数是合适的——一般来说——大多数有中期趋势的金融资产。
推荐的时间范围是 D1。
在价格方向突破前一根柱线的高/低后开仓。
止损设置在烛台的前一个峰值之后。
交易逻辑取自 Charles Doe 的趋势保持理论。
使用此 EA 的目的是通过不使用固定止盈来最大化盈利交易。
账户类型:净额结算、对冲。
不使用鞅,平均,网格。
交易建议:
要使用“EA 交易”,您必须首先选择您认为具有潜在长期下降趋势或

该面板具有每个初学者都可以处理的最直观的界面。
在 SLp 列中 - 您需要以点子为单位指定 SL 大小。如果该值变为灰色,同时 Bay / Sell 按钮也处于非活动状态,则您指定的 SL 值小于经纪商设置之前允许的值。
在 TP% 列中 - 您以帐户余额的百分比表示 TP。在设置中,您可以根据此指标的计算方式选择净值、余额或可用保证金。
在 R% 栏中,您可以设置交易的风险值。
插入按钮。 - 允许您立即使用设置的值打开订单,如果禁用,则您可以直接在图表上预设交易参数。
在顶部,您可以通过单击左上角的减号来最小化图表上的面板。 Pro Trading Panel - https://www.mql5.com/en/market/product/72256
还可以通过调整面板名称下方的 + 和 - 按钮来增加或减少面板本身的大小。
如果您还想开挂单和转移到BU,追踪止损,保存开单的各种设置,支持各种技术的定单,那么考虑一个功能更强大的EasyTradePad面板,您可以在我的产品中找到它。

你想要一个带有小止损的EA吗? 你想要一个刚刚进出市场的EA吗?
这个EA正在突破dax(德国指数)或道琼斯。 它只在市场开盘时买入,并在10分钟或更短的时间内买入。
这种策略(是的,它是2种不同的策略,可以与3种不同的图表一起使用)具有紧密的止损和一个获利,通常会在几秒钟内达到!
这些策略得到了很好的证明。 我手动使用它们多年,效果很好。 设置文件可以在我使用的设置的评论部分下找到(如果您随着时间的推移找到更好的东西,请随时更改TP或SL)
这个EA的特点
它每天只需要一个交易和策略(有时没有交易) 在所有交易上使用TP和SL(内置于EA中,因为SL和TP很紧) 买入和卖出止损订单的可能使用 没有鞅 没有对冲 无套利 没有多重交易
促销价格:$50. 2买左,价格上涨至$100。 最终价格:$499 时间:1分钟
符号:DAX(Strat1&2)和Dow Jones(strat3)
如何设置EA
快速设置 策略1-设置文件 策略2-设置文件 策略3-设置文件 请注意将TP和SL设置为正确的值;取决于您的经纪人有多少小数!
MetaTrader市场提供了一个方便,安全的购买MetaTrader平台应用程序的场所。直接从您的程序端免费下载EA交易和指标的试用版在测试策略中进行测试。
在不同模式下测试应用程序来监视性能和为您想要使用MQL5.community支付系统的产品进行付款。
您错过了交易机会:
- 免费交易应用程序
- 8,000+信号可供复制
- 探索金融市场的经济新闻
注册
登录