适用于MetaTrader 5的EA交易和指标 - 62

This is a decorative utility that replaces the standard marks of completed deals with "Kingdom Come: Deliverance" game style markers.
In addition to the graphic display of the price and time of the transaction, the notes also contain a textual representation of the transaction volume. Running utility Drag the utility from the Navigator window to the desired graph. The utility does not use input parameters and does not require configuration. All trademarks available on the chart will be replace
FREE

SeasonalEA is an Expert Advisor for MetaTrader 5 that allows a trader to buy (or sell) symbols with timing rules. For example, the trader can add rules to buy on Monday at 10:00 am and sell on Tuesday at 5:00 pm. This software is useful for traders that: study seasonal patterns on Forex and CFD study intraday seasonals rules study timing trading rules This EA accepts up to 6 symbols rules (but if a trader wants to trade only one pair, they can do it simply by setting other lots to zero).
Input
FREE

Monkey Lite offers the following array of features: One-click instant order entry (short or long). Track total current orders and total current profit. Instant Close Buy, Close Sell, Close All button. Utility types Risk management, Graphical objects, Panels. Main features
Take Profit and Stop Loss by money (not pip). After the price reached the Take Profit threshold, trailing stop 20% of the current profit. After the price reached the Stop Loss threshold, the orders will be closed immediately.
FREE
This is an indicator that highlights the price range, specifically in the morning. So it is very easy to identify when these zones are broken, giving you an excellent entry opportunity! Range Breakout works on all symbols and timeframes. It displays past price regions and projects the current one. If you find any bug or have any suggestion, please, contact us. Enjoy!

This indicator shows price changes for the same days in the past. This is a predictor that finds bars for the same days in past N years, quarters, months, weeks, or days (N is 10 by default) and shows their relative price changes on the current chart. Number of displayed buffers and historical time series for comparison is limited to 10, but indicator can process more past periods if averaging mode is enabled (ShowAverage is true) - just specify required number in the LookBack parameter. Paramet

Простая утилита, которая показывает на какую сумму средств куплено активов в портфеле. Необходима для отслеживания загрузки депозита. Выводит информацию в удобную надпись, которую можно разместить в любом месте графика. Учитывает валюту депозита: USD или RUB Учитывает, в какой валюте торгуется актив (USD или RUB) и автоматически конвертирует по текущему курсу. Можно настроить размер и цвет надписи
FREE
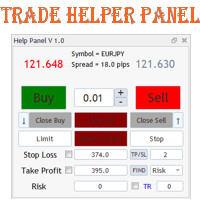
Данная панель предназначена для удобного совершения сделок в платформе Metatrader. Она позволяет с легкостью открывать позиции, устанавливать стоп лосс и тэйк профит, использовать трейлинг стоп и тд..
Входные параметры :
Magic - уникальный номер эксперта Lot step - шаг изменения лота Custom - произвольная сумма для высчитывания риска Risk Value - тип поиска значения риска (в %) Функции панели : Открытие sell и buy позиций
Возможность установки profit / loss для позиции, в том числе и графи

1.这是什么: 下载Market Watch中所有的Symbol数据到系统。PS:不是把数据输出到文档。 2.为什么要用这个: 如果系统中没有数据:网络链接不好的时候,用MT5看一个Symbol需要等待很长时间;在不同Symbol或不同TimeFrame切换,如果系统没有数据也需要等待很久;如果进行长时间回测,系统没有数据,需要下载很长时间。 所以提前把历史数据下载到系统中,能提高工作效率。 3.怎么使用: parameters: input bool bool_usualtimeframe=true; //true-系统默认TimeFrames; || false-所有的TimeFrames. input bool bool_allSymbol=true; //true-Market Watch中所有品种; || false-根据你的输入 input string input_Symbol=NULL; //上面参数为false时,输入你的Symbol名称 input datetime time_Start=D'2017.01.01'; //默认数据下载开始时间 input int s

This new unique indicator Actual tick footprint (volume chart) is developed for using on Futures markets, and it allows seeing the volume of real deals right when they are performed. The indicator Actual tick footprint (volume chart) represents a greatly enhanced tick chart that includes additional information about the volume of deal performed at a specific price. In addition, this unique indicator for MetaTrader 5 allows to clearly detecting a deal type – buy or sell. Alike the standard tick c

I find the lot calculation tedious so I just use this script and tell it the dollar amount to use. It then does the rest. This works for any currency.
How-To: Open a buy position using the desired dollar amount instead of lots. To use, just drop it onto a chart and set inputs as needed. The script will then do the necessary lot calculation and open the trade.
Inputs: FIXED_DEAL_AMOUNT: Fixed amount to use per trade e.g 100 to open a R100 deal USE_SL_ON_BUY: If true then a suitable stoploss w
FREE

This is the Demo version of Arawako MT5 EA , based on the Bollinger Bands indicator. I have created an open strategy you can modify at your will, as it has been specially designed for trading GOLD at 0.01 but it can work in all pairs. This version is limited in: It works only at Demo accounts. Its start lot is only from 0.01 (or minimum lot). It makes a series of trades only once per month. It does not have "time to trade" or "news" options available. >> The Real version can be found at the
FREE

What is this indicator? This indicator is the RSI (Relative Strength Index) supporting Virtual Trading mode of Knots Compositor . When the mode is turned on, the indicator will be recalculated based on the displayed candlesticks. When the mode is turned off, the indicator will be recalculated based on the original chart candlesticks.
Types of the applied price - Close - Open - High - Low - Median Price (HL/2) - Typical Price (HLC/3) - Weighted Price (HLCC/4)
KC-Indicators - KC-MA (M
FREE

Привет. Сегодня представляем индикатор корреляции - SynchroWindowTomson. Индикатор в одном окне показывает движение нескольких инструментов, по отношению друг к другу, удобно определять направление и изменение, особенно когда вы работаете с целым портфелем разных инструментов и нужно определить какой из них тянет результат назад и движется в другую сторону. Так же видны точки разворота спреда.
FREE
O indicador grafico de rompimento foi desenvolvido para elevar a precisão e confiabilidade na identificação de oportunidades de rompimento no mercado financeiro. Projetado com algoritmos avançados, este indicador destaca barras de rompimento com uma precisão notável, permitindo que traders identifiquem pontos de entrada e saída estratégicos. Recursos Principais: Precisão Aprimorada: Utiliza algoritmos avançados para identificar barras de rompimento com uma precisão excepcional. Alertas em Tempo
FREE

GBPUSD TRADING BOT VX free version SYMBOL: GBPUSD TIMEFRAME: ANY ACCOUNT SIZE: Minimum, USD 500 ACTIVE HOURS: 15-17 hours (GMT+3 ) Please adjust accordingly to your time zone. MAXIMUM account drawdown: 4.17%. Risk Management: A small lot size is used i.e. 0.01 per USD 1000 on account to ensure stabilized returns full version: https://www.mql5.com/en/market/product/107387 5 year performance : Return on investment *9 times. NB this is with compounding. The average is close to ROI 65% every year w
FREE

The indicator is designed for easy construction of synthetic charts based on data of various financial instruments. It will be useful both arbitrage and pair trading, as well as for analysis purposes. Its main advantage is simplicity and clarity. Each chart is given as a common mathematical formula. For example, if you want to plot the spread (difference) between EURUSD and GBPUSD with coefficients 4 and 3, then set the following formula: EURUSD * 4 - GBPUSD * 3 The resulting chart is shown in t

This indicator draws strong price levels (price consolidation levels). The levels are plotted using 2 MA indicators and 1 MACD using a complex algorithm. The algorithm used in the EA is also in personal use.
These levels have 4 variants (colors of the variants can be customized): strong up, weak up, strong down, weak down. In turn, a weak level usually appears and then it can become strong. A strong level can also become weak. Version MT4: https://www.mql5.com/en/market/product/27997/ Versio

EXPERT AMAZO DEMO é um Expert Advisor projetado especificamente para negociar WIN (mini índice) e WDO (mini dólar) e para ser usado somente em contas DEMO. A operação é baseada na abertura de ordens utilizando alguns indicadores como Sars parabólicos, médias móveis, Bandas de Bollinger, Fibonacci, etc., trabalhando de acordo com 3 modalidades de estratégia, o AMAZO procura prever os movimentos do mercado com operações contra ea favor da tendência.
Entre em nosso Grupo de WhatsA
FREE

//////////////////////////////////////////////// //////////////////////////////////
An improved version of the standard Average True Range indicator.
It is now a responsive and smoothed line.
The setup is not straightforward - but I hope you can do it. It is very easy to understand the readings of this indicator, the meaning is the same as that of the standard Average True Range.
//////////////////////////////////////////////// ///////////////////////////////////
I hope this indicator
FREE
This indicator allows to hide Volume (on all MT5 timeframes) from a date define by the user with a vertical line (Alone) or a panel (with "Hidden Candles"). The color of each bar depends if this one is higher or lower of the previous bar. Indicator Inputs: No inputs for this indicator Information on "Volume" indicator is available in this post: https://www.mql5.com/en/forum/134260 ************************************************************* Hey traders!! Give me your feeds! We are a commun
FREE

Indicador Volatilidade Histórica Indicador é um oscilador que faz o plot da volatilidade histórica de um ativo, representado pelas fórmulas: Volatilidade Histórica = Raiz quadrada da média das diferenças ao quadrado * Fator de anualização. Média das diferenças ao quadrado = soma de todas as diferenças de retorno diário / número total das diferenças. Retorno diário = (preço atual - preço anterior) / preço anterior. Nesse indicador estamos utilizando os preços de fechamento de cada barra e fazemos
FREE

The Close script is a simple tool that allows traders to close their trades by three methods. Just run the script and choose the close method.
Closing methods Symbol - Allows closing all open trades for a specific symbol. All_Trades - Allows closing all open trades. Magic_Number - Allows closing all open trades according to their magic number. Recommendation AutoTrading functions must be activated. If the AutoTrading function is disabled, the script will not work. EA should be stopped
FREE

"Terminator Trades " EA robot, built on the powerful MQ5 code, is designed to simplify the process of closing your positions and pending orders. You can adjust if you want close all the trades or by specific symbols. With just a single click on a button, you can efficiently manage your current positions, ensuring that you never miss an opportunity to terminate a trade. Close Trades , Delete Pending Orders with Terminator Trades.
FREE
The script removes all of the indicators on the chart with one movement of the hand. There are situations when there are too many indicators on the chart. And it is required to delete all of them without closing the tab. Unfortunately, the settings window doesn't allow us to select all indicators at once and we have to delete one by one. This script will solve this problem. Simply drag the script from Navigator window onto the chart.
FREE
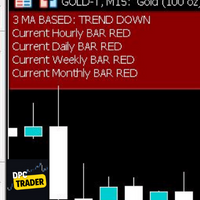
This Utility Bot is for New Traders, that struggle to spot the Trend direction. It also make you conscious about different Timeframes Bar Status. Utility have 3 Moving Averages totally configurable by input parameters. 3MA Based Trend is shown for the current Timeframe selected on the chart. (Line 1) 3MA Based Trend for Daily Timeframe. (Line 2nd) Also provide quick information about the currently Hourly Daily and Weekly Candle Status. Utility work on 1 Min Bar control, so comment section info
FREE

Data Extractor (DE) is designed to extract symbol price movement data and save it to file. It's a simple tool, designed to be used in combination with other software.
SETTINGS (INPUTS) Period_in_days - How many days of data for Data Extractor to process (including non-work days). File extension - Defines the type of file in which data will be saved. CSV is readable for a human, HST and BIN are binary data intended for machine reading. File name (without extension) - User defined part of file
FREE

该实用程序通过滚动鼠标滚轮来控制任何指标的任何参数。 您可以安装此实用程序并从标准终端交付更改任何指示器的界面。 对于自定义指标,以及在"市场"上购买的指标,有一个通用滚动条实用程序。 " Universal Scroller " 运作原理 该实用程序通过滚动鼠标滚轮进行更改来控制您选择的参数之一。 滚动模式激活是通过将光标悬停在按钮上或单击它来启用的。 按钮自动在图表上设置。 所有至少有一个整数参数的指标都适用于此实用程序。
安装工程 在图表上加载您的指标,记住您要控制的参数的值。 它必须是一个整数。 将"标准滚动条"加载到图表上。 在"设置"窗口中,同步两个指标-为此,请在"参数"字段中输入指标中的值。 例如,如果您的指标的参数等于14,请在"标准滚动条"设置中设置参数14。 单击确定。 按钮出现在图表上后,您可以将其拖动到任何方便的地方,它会记住它的位置。 指示器已准备好使用。 只需将鼠标悬停在按钮上! 申请表格 将光标悬停在按钮上并旋转鼠标滚轮。 您选择的参数将随着您在设置窗口中设置的步骤而增加或减少。 与此同时,图形本身的滚动模式被禁用。 要停用指标滚动模式并恢复图表滚
FREE

Benefits: A new and innovative way of looking across multiple timeframes and multiple indicators on any chart. Provides instant multi-timeframe analysis of any market. i.e. forex currency pairs, cryptocurrency pairs, commodities, etc. It offers precise indications across multiple timeframes of volatility as measured by RSI, ADX and STOCH within one chart. Helps you determine high probability trading setups. See example strategy in comments. Can see bullish/bearish volatility building across mult

点差成本信息 点差产生的交易成本是制定交易盈亏比时的一个重要指标。点差成本信息对短线交易者尤其是超短线交易者尤为重要。本工具可以在不同的账户类型(美元账户、欧元账户等等)下,输出平台报价中所有外汇货币对(包括黄金XAU、白银XAG)的点差成本。
计算方法及代码 见文章: 外汇货币对的交易成本 Part1 外汇货币对的交易成本 Part2 外汇货币对的交易成本 Part3 外汇货币对的交易成本 Part4
参数 Lots - 设置计算点差成本的交易手数,默认为1.0。
如何使用 使用此工具前需将MT5的市场报价设置为“显示全部”,具体操作见下图; 输出的路径为“ MT5路径\MQL5\Files\SpreadCostData ”,文件名称是当前日期,输出成功后会在MT5终端-工具箱-专家一栏显示成功输出信息,输出路径及文件名称见下图; 输出内容的第一列是货币对名称,第二列是点差(点数),第三列是交易 Lots 手的点差成本(点差成本以账户货币计价),具体内容见下图。
FREE
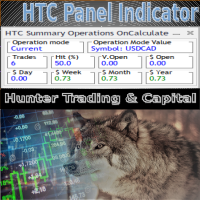
HTC Panel Indicator is an operational summary dashboard for use in conjunction with trading EA.
It provides a concise summary of the current year's trades, open positions and profit history.
The summary can be filtered by the current chart asset, by the ID (magic number) of an EA or by all trades performed in the year.
The panel must be inserted into the chart as an indicator, making it possible to add it to a chart that already has a trading EA.
FREE

Apenas Ajusta todas as posições para o Breakeven com relação ao Preço Médio de total
Exceução de ajuste de Breakeven de modo rápido, funciona em Conta Hedge e Netting
Para mais detalhes de configurações e input de variáveis entre em nossa comunidade no guilded ( https://www.guilded.gg/i/E9m8bYLE )
Inclui Rompimentos, Canais Estreitos, Canais Amplos e Lateralidades, ou seja para todos os ciclos
FREE

Only Exponential Moving Average at Close Price is used in standard Bulls Power limiting the possibilities of that indicator to some extent. Bulls Power Mod enables you to select from four Moving Averages and seven applied prices, thus greatly expanding the indicator's functionality.
FREE
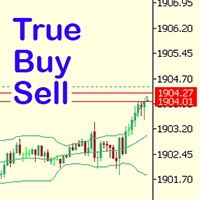
Have you ever noticed how on the forex symbols, the buy / sell button's price doesn't match the buy / sell lines on the chart? The spread always looks a lot tighter on the chart, you open a position and then realise the spread is huge. This is a very simple utility, it adds lines on the chart which match the buy / sell price on the buttons. Once installed I recommend right clicking the chart, go to Properties and uncheck "Show bid price line" and "Show ask price line", now click OK. Then righ
FREE

Blind Broker System 的唯一目的是隐藏您的交易计划并让您的经纪人看不到它们。如果您真的想让他“盲目”并确保他对您的止损水平、交易量、获利水平一无所知提前,只需使用此交易机器人。
Blind Broker System 是另一种管理订单的系统。
不同之处在于,所有通过 Blind Broker System 提交的订单不是写入经纪人的服务器,而是写入程序的内存。
经纪人仅在市场订单发生时收到市场订单请求 - 仅此而已。
注意! 正确操作需要不间断电源,建议使用 VPS(虚拟专用服务器)。
您可能会认为这个系统是您自己坐在屏幕前进行交易的副本。
如果您手动交易,系统将与您的行为完全相同。
演示版允许您测试机器人的几乎所有功能,但没有真正交易的可能性,但是工具上的关闭所有交易按钮将起作用。
交易水平是可见的,您可以看到它们在实际订单执行的那一刻被删除,但是机器人不会在模拟账户或真实账户中采取任何实际行动。
DEMO VERSION就像一辆汽车,但里面没有引擎。你可以上车,触摸方向盘,测试内饰的舒适度——但你不能开车。
FREE
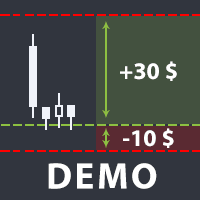
The utility helps open a deal with a stop loss that does not exceed the specified amount, or to refrain from it altogether. That is, it determines the number of lots to open the deal so that the stop loss is as close as possible to the specified amount in USD without exceeding it. For example, it will be indispensable when trading according to the Gerchik strategy. That is, when trading based on risks, with a fixed risk and a fixed take profit relative to stop loss. For example, if you always op
FREE

A very simple indicator, but one that cannot be missed when carrying out your operations.
Fast and accurate information on the Swap value of currency pairs before entering a trade.
See if when buying or selling the value of the Swap in your operations
Come and see our mql5 signals too https://www.mql5.com/pt/signals/899841?source=Site +Signals+From+Author
FREE

Indicador Regressão Linear – Par de Ativos - INTRADAY Indicador é um oscilador que faz o plot do Resíduo resultado da regressão linear entre os dois ativos inseridos como input do indicador, representado pela fórmula: Y = aX + b + R Onde Y é o valor do ativo dependente, X é o valor do ativo independente, a é a inclinação da reta entre os dois ativos, b é a intersecção da reta e R é o resíduo. O resíduo representa a quantidade da variabilidade que Y que o modelo ajustado não consegue explicar. E
FREE

Dear friends, I present to you my TradeFields EA adapted for Forex , modeling is based on machine learning using averaging and grid trading. The EA is a fully automatic light version and it is intended for trading in a single currency mode with a fixed micro lot and has only trading session intervals for all days of the week as external settings. You can find professional versions of advisors with many settings and many additional functions at the following links: https://www.mql5.com/r
FREE

Overview The script displays information about the trade account: Information about the trade account: Account - account number and type (Real, Contest or Demo); Name - name of the account owner; Company - name of a company that provide the access to trading; Server - trade server name; Connection State - connection state; Trade Allowed - shows whether trading is allowed on the account at the moment; Experts Allowed - shows whether it is allowed to trade using Expert Advisors; Balance - account
FREE
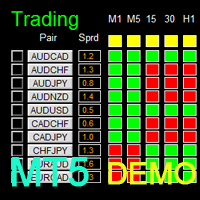
Dashboard Super Candle Demo is the demo version of Dashboard Super Candle, which have full functionalities of the paid version, except Only candle of M5, M30 and H4 will be used for signal generation (full version has candle of all timeframe). To access the full version, please re-direct to this LINK . Dashboard Super Candle is an intuitive and handy graphic tool to help you to: Have 28 pairs under control with one dashboard. Monitor candle direction; identify possible price movement and trend.
FREE

What is this indicator? This EA is a plugin of MT5's FX verification software " Knots Composito r". You can open, change and close positions just like in a real trade.
The profit and loss of all positions is recorded in account.
How to set up
1. Download all historical data for the target currency pair to calculate the profit of the position in dollars. 2. Open the chart of the target currency pair and scroll to the end in the past direction. 3. If the target currency pair is a cross cur
FREE

Hi you, I need your help! Be my Patron, let's make it possible!
https://www.patreon.com/joaopeuko https://github.com/Joaopeuko/Mql5-Python-Integration
It works.
*****REVISADO*****DIA 31/12/2019 (dd/mm/yyyy) - EA continua funcionando perfeitamente, apesar do comentário feedback negativo.
Simples Expert Advisory para trades feitos de forma manual.
O EA coloca o Stop Loss (SL) e o Take Profit(TP) de e automática quando o Trade acontece.
O EA trabalha com números inteiros e fraciona
FREE

Introduction Scruffy Countdown is a utility for MT5 that displays a countdown timer based on the chart's current timeframe. As each new bar (candlestick) appears the countdown is reset. Features include: Countdown based on current chart timeframe Customisable font and size Warning before and after the hour in minutes with customisable colours (optional) About Scruffy Coder We may be scruffy in name and wear a few scruffy clothes but we're dedicated to bring you useful and reliable tools for MT5
FREE
This indicator is to be used in bot connectors for automation of Pct Multi indicator entries.
How to use: Configure the bot connector with the following information: Indicator name: pctmultibot Call buffer: 0 Put buffer: 1
Do not add this indicator to the chart, just configure it in the bot connector!
Pct Multi indicator:
https://www.mql5.com/en/market/product/111091
FREE
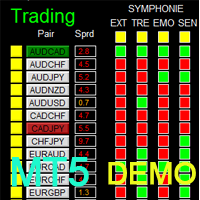
Dashboard Symphonie Trader System MT5 Demo is the demo version of Dashboard Symphonie Trader System MT5 , which has full functionalities of the paid version, except Stochastic 2 is not available Dashboard timeframe Stochastic 1 time-frame is fixed at M5 Extreme signal is not available Sentiment signal is not available Full version: LINK MT4 version: LINK This system basically utilizes Symphonie Indicator Set (Extreme, Emotion, Trend, and Sentiment) as the core indicators to generate trading
FREE

Excellent dashboard for market analytics. The panel helps to analyze the values of the RSI indicator and its signals.
With this panel you can: watch the current signal from RSI on all timeframes; watch the current signal from RSI by different symbols; watch the current RSI value; several types of signals for analytics.
Values in a table cell: RIS value.
Signal type: RSI crosses level buy out/level sell out (outside); RSI crosses level buy out/level sell out (inside);
RSI is u

Excellent dashboard for market analytics. The panel helps to analyze the values of the Ichimoku indicator and its signals.
With this panel you can: watch the current signal from Ichimoku on all timeframes; watch the current signal from Ichimoku for different symbols; watch the current Ichimoku value; several types of signals for analytics.
Values in a table cell:
Value of Tenkan-Sen Value of Kijun-Sen Value of Senkou Span A Value of Senkou Span B Value of Chikou Span S

SIMPLE AND QUICK CHART CLEANUP SCRIPT - FREE FOR ALL - EASY TO DRAG AND DROP ONTO THE CHART - A MUST HAVE IN MY EYES
Everybody loves to draw on a chart! But cleaning is nobodies favor. Most of the time it will be faster to dump all and redraw the important part. Repetition makes you good! ALWAYS think about that! KEEP IT GROWING, ;-) I wish you a good day, Traders!
If you need something, send me a message. Best wishes to you from Vienna!
FREE

NS Financas Automatic Clear All Chart Indicators Script
Automatically remove all indicators from your chart offered for free by NS Financas! Don't waste any more time deleting the indicators one by one. With this script it is possible in one click to remove all indicators from the screen to adjust your new strategy while still using the settings of your graph, in addition to the possibility of configuring keyboard shortcuts for quick access to the script.
Take the opportunity to visit our
FREE

Иногда бывает, что наши построения на графике выходят за пределы последнего бара. После выходных, эти построения могут измениться в виду особенностей учета времени в мт5. Данный индикатор поможет решить эту проблему - он проходит по всем графикам и сдвигает дату объекта, которая дальше, чем нулевой бар. После завершения работы индикатор удаляется. Параметры:
Direction - направление сдвига; DaysShift - количество дней, на которые сдвигается дата объекта, правее нулевого бара.
FREE

The indicator paints the candlesticks of the chart in colors calculated from the values of the strengths of the bulls and bears.
It works like this:
The values of the two indicators Bears and Bulls are taken, and who is stronger on the candlestick is compared. It's all.
.
FREE

Good afternoon. Today we offer the maxlottomson indicator to determine the maximum volume that you can put up for purchase or sale, if you look at your deposit level. This indicator is convenient to use for News trading, when you need to determine the entry point on a high-speed movement and calculate the risk level as a percentage of the deposit, the maxlottomson indicator shows the maximum value of the LOT volume for your deposit that you can use for trading.
FREE
啟用TrailingTrader腳本後 報價視窗的交易品種 將會進行移動止損
設定參數 TrailingDistance 啟動移動的點數 TrailingCallBack 移動止損的回調點數
工作原理 持倉單在獲利的條件下 市價超過設定的點數時 腳本自動設定止損線在市價回調的點數位置 當市價繼續往獲利的方向運行時 止損線會持續往運行方向調整 直到市價回調到止損線時獲利平倉 當同一品種持有多張持倉單時 移動止損會分開運行 當盈利超過一定的範圍時 移動止損線會形成同步狀況
特點 當交易員習慣手動開單 又無法長時間盯盤時 可以啟用移動止損 當持倉單一旦觸發工作 就可以確認該單會在獲利的條件下出場
起用條件 需要使用MT5交易的電腦全天候開機運行 可以啟用腳本後 再同步到官方VPS 此時同步的腳本可以全天候監視交易帳戶
FREE

This script will get the lastest price and spread for certain symbol. It will show the Bid/Sell price and Ask/Buy price, and the price difference is the spread between Bid/Sell and Ask/Buy prices.
I'm a high-energy, seasoned and self-motivated mathematician. Professional in the capital markets. Professional experience in quantitative analysis, financial modeling and investment strategy. Familiar with macroeconomic and microeconomic conditions along with company fundamentals to make prediction
FREE

Stop Out Monitor will provide information on how many pips your account will stop out for each currency pair.
With this Stop out info, it is hoped that forex trader can maintain the health of their account and be able to take the necessary actions when a stop out will occur and look for prevention so that a stop out or margin call does not occur. So far, we have only provided standard information from Metatrader in the form of free margin and margin level in percentage , where this inf
FREE
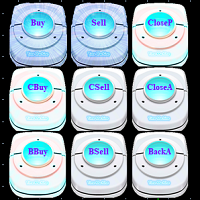
1.系统简介 它是一种三维便捷交易和信号指示按钮,功能不仅包括:买、卖 、平亏损仓、平盈利仓 、买平仓 (可选1/5~1仓位) 、卖平仓(可选1/5~1仓位)、 清仓(清除所有物体、所有持仓以及所有挂单) 、买反手 (可选1~5倍反手) 、卖反手(可选1~5倍反手)、全部反手 (可选1~5倍反手) ,还能通过三维按钮闪烁提供当前账户的单一品种和所有品种的获利信号。
2.系统设置 2.1 lot:买入或卖出仓位 2.2 cbuytimes:买平仓倍数 2.3 cselltimes: 卖平仓倍数 2.4 bbuytimes:买入反手倍数 2.5 bselltimes:卖出反手倍数 2.6 backatimes: 所有仓位反手倍数 2.7 closepl:选择平掉全部盈利、亏损仓位; 2.8 buttonstyle:按钮样式。 2.9 buttonsize:按钮大小样式。 2.10 buttoncorner:按钮位置。 2.11 buttonname:按钮名称;用户可以自定义名称。 2.12 buttoncolor:按钮颜色,用户可以按照RGB值自定义颜色。
3.交易按钮功能 3
FREE

zap 43996914141 pelo valor de 50 + brinde ProTrader B3 Mini é um utilitário para a plataforma de negociação MetaTrader 5
Foi programado especialmente para os ativos WIN (mini índice bovespa) e WDO (mini dólar)
O conceito do B3 Mini é ser simples, prático e intuitivo, um excelente assistente para scalpers/day traders!
Opere totalmente pelo teclado do seu PC, experimente, você vai gostar de usar! ( 'ω' )
Nota: Esta versão funciona apenas em contas de demonstração
Versão ilimitada → htt
FREE

Main purpose: This indicator calculates the average of previous candles (a half of candle points). This value represent the strength of market (buy/sell) in each candle.
Parameters: . Period: indicating previous candles to calculate average . Shift: draw line at a shift on chart.
Tip: We can use this value to consider TP and SL of a position before opening.
FREE

Tetris remains one of the most fun and addictive pieces of software to ever grace the computing scene. That's right, everything that everyone loves about Tetris can now be experienced on MT5 platform. Its beautiful simplicity and surprisingly fast-paced gameplay make it an exceptionally easy thing to just pick up and play on short notice. This version comes with everything everyone loves about Tetris. It has all six of the classic tetrimino shapes, the steadily growing level of challenge tha
FREE

EA to prevent inactivity violations on prop firms.
This EA will scout for your most recent trade and if it is older than the number of days defined, will enter a micro lot position size 0.01 on the pair defined. It is recommended to use a tight spread pair like EURUSD. This EA will not act as long as you have at least one trade in the last X days (defined on config).
This EA will not place other trades or modify existing position.
FREE

专家顾问允许您模拟由另一位专家执行并保存在csv文件中的事务的执行。 这对于在另一台服务器上检查交易策略的结果很有用。
使用另一个程序,例如,帐户历史导出器将帐户上的交易历史导出为所需格式的csv文件,或将程序代码从专家历史导出器连接到您的专家以导出历史。
在文件的开头应该有这样一行:
DATE,TICKET,TYPE,SYMBOL,VOLUME,ENTRY,PRICE,STOPLOSS,TAKEPROFIT,PROFIT,COMMISSION,FEE,SWAP,MAGIC, COMMENT
它可能不是从文件的一开始就找到的,也就是说,任何其他信息都可能在它之前。
在它们之后和文件的末尾,有一行以逗号分隔的字段值用于一个事务。 行中字段的值:
DATE - date in the format YYYY.MM .DD HH:MM:SS TICKET - transaction ticket (integer) TYPE - transaction type from ENUM_DEAL_TYPE (integer) SYMBOL - trading i
FREE

The Market Surfer Demo is a tool for manual traders who want to trade fast markets efficiently. All trading actions, like Buy, Sell, Buy/Sell Limit/Stop, Close, switch, double, half, etc. can be done with just one click.
Features Open, close, switch, switch half, switch double, double, half, etc. position with only 1 click. Quick selection of lot size, maximum deviation, stop and target pips. Convenient overview of most account, position and risk data. Risk and Target from entry and current ma
FREE

This indicator allows to hide Bill Williams Alligator (on all MT5 timeframes) from a date define by the user with a vertical line (Alone) or a panel (with "Hidden Candles"). Indicator Inputs: Jaws Period Jaws Shift Teeth Period Teeth Shift Lips Period Lips Shift Method Apply To Information on "Alligator" indicator is available here: https://www.metatrader4.com/en/trading-platform/help/analytics/tech_indicators/alligator ************************************************************* Hey traders!
FREE
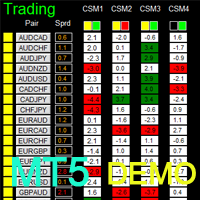
如果产品有任何问题或者您需要在此产品上添加功能,请联系我 Contact/message me if you encounter any issue using the product or need extra feature to add on the base version.
Dashboard Currency Strength Advanced MT5 Demo is the demo version of Dashboard Currency Strength Advanced MT5 , which have full functionalities of the paid version, except Only 2 currency strength meter with time-frame D1 will be used for signal generation (full version has 4 currency strength meters with full time-frame selection) Full version: LINK MT
FREE
This is a demo version, only 0.01 lot is alowed Full version: https://www.mql5.com/pt/market/product/73259 EA uses the value of the ATR indicator as a decision to open a trade, very useful to trade in the first moment of a big movement, because the ATR indicator is able to track the size of the movements in the period chosen by the user. The user includes the period of the indidacor ATR and the value/size that it is of interest to open a trade, the operation will take place in same direction o
FREE

The current expert advisor is accomplished as a Telegram-bot. The purpose of the EA is to provide information about any country, event or values retrieved from thу database of the economic calendar . It is necessary to allow the following URL in the options in the tab "Expert Advisors": https://api.telegram.org There's ony 1 input parameter "User name". The Telegram username must be added here as @name. After starting the Expert Advisor onto the chart one needs to open Telegram app and find t
FREE
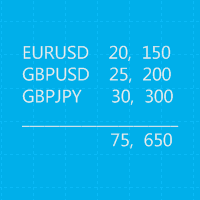
这是一个MT5的脚本,帮助把交易记录按照品种分类统计。 参数 Select Period: 这是7个选项的参数,分别是上个月,本月,上周,本周,今天,指定日期。 Specify Starting Date: 输入一个起始日期,如果上面参数你选择的是指定日期的话。 Specify Ending Date: 输入一个截止日期,如果上面参数你选择的是指定日期的话。 如果参数Select Period 选择的不是 指定日期,那么后面的两个参数就不用填写了。 脚本会有一个文件输出结果,文件保存在MQL5\Files文件夹中。 希望对你有帮助,真心希望对你有帮助,我觉得会有帮助。 必须满足300个字,我必须说些废话,好了好了,希望对你有帮助。 MT4 Version: https://www.mql5.com/zh/market/product/23802
FREE

This Utility tells you the volatility of any symbol for any of the major time frames. As trades occur, the volume increases for each period. When each period ends, the bucket is reset to 0. Volumes are sorted from largest to smallest within each shown period. Click any symbol to highlight that symbol in all period columns. Volume information is specific to transactions placed at your broker. To test in the Tester, set the following:
EURUSD,M1,1 minute OHLC 2018.01.01 to 2018.01.02 (a day’s wort
FREE

The indicator converts two moving averages into histograms and paints their intersection area.
There is a shift trick setting, it is used to smooth the result of calculations. You can see the changes if you reduce this parameter to 1 (minimum value).
Available averages:
MA Simple MA Exponential MA LinearWeighted MA Smoothed DEMA TEMA and
RSI - as a bonus By default, the fast MA is displayed at the top of the histogram, and the slow one at the bottom. You can swap them if you like.
shi
FREE

一 運作方式(如下圖)
在一個單邊向上的行情中, 自動交易工具做以下動作: 當價格來到高點,等待突破訊號在進場。
當價格回調,等待回調結束要往上時在進場。 當進場下單後,
如果一直漲就持續持單,等待價格漲不上去準備下來時,在獲利離場。
但如果一直跌,就等待要上漲時在進場,進場時加倍下單,
一個做底單,動作同上等待獲利離場,
另一個單用做倉位修正,此單和第一張單在盈虧為0時會各自平倉,不造成損失。 Ps:
在一個單邊向下的行情中,動作則相反
二 設定方法(如下圖)
Step1 一開始要自己指定工具的方向.
如果認為會往上走,設定i_tradeup=true, i_tradedown=false,
如果認為會往下走,設定i_tradeup=false, i_tradedown=true,
Step2 指定目標位置和止損位置
如果認為會往上走,i_top輸入目標位置,i_bottom輸入止損位置
如果認為會往下走,i_top輸入止損位置,i_bottom輸入止盈位置
當價格到達目標位置會強制平倉獲利並暫停工具運作
FREE
MetaTrader市场提供了一个方便,安全的购买MetaTrader平台应用程序的场所。直接从您的程序端免费下载EA交易和指标的试用版在测试策略中进行测试。
在不同模式下测试应用程序来监视性能和为您想要使用MQL5.community支付系统的产品进行付款。
您错过了交易机会:
- 免费交易应用程序
- 8,000+信号可供复制
- 探索金融市场的经济新闻
注册
登录