适用于MetaTrader 5的技术指标 - 43

KT MA Crossover draws the buy and sell arrows based on the crossover of chosen moving averages. Moreover, it also generates the appropriate alerts and displays the MFE (Most Favorable Excursion) for each successive signal. The moving average crossover is one of the primary strategies followed by traders around the world. Usually, it consists of a fast and slow moving average to find a buy and sell entry signal according to the crossover direction. Buy signal - when fast MA crosses above the slo

Hurst Fractal Index Фрактальный Индекс Херста - показатель персистентности временного ряда При значении индикатора >0.5 временной ряд считается персистентным (тенденция сохраняется) При значениях индикатора явно < 0.5 временной ряд считается антиперсистентным (возможна смена направления движения) Для наглядности значения индекса усредняются периодом 2-3. Настройки индикатора: Max Bars - глубина истории расчета (кол-во баров на графике для которых произведён расчет) Data from Timeframe - исполь
KT Round Numbers plots the round number levels which are also commonly known as psychological levels in the Forex world. In the context of Forex trading, round number levels are those levels in which there are two or more zeroes at the end. They are named as 00 levels on the chart.
Some traders also consider the halfway points as a valid round number level. They are named as 50 levels on the chart.
Use of round number levels in trading Round number levels work as strong support and resistan
Candle Pattern Alert indicator alerts when the last price closed candle matches the set input parameters. You can choose to scan through all the symbols in Market Watch or enter your favorite symbols and also you can enter time frames you need to scan. ---------Main settings-------- Select all symbols from Market Watch? - if Yes the program scans through all the symbols displayed in Market Watch, if No - only selected in next input symbols are scanned
Enter symbols separated by commas - enter s
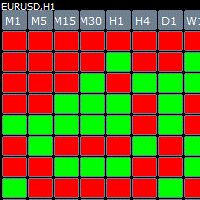
Cube indicator represents the original candle stick chart but in a top down cube form in order to see previous patterns in the markets more easy. The indicator has build in alert once there is a consecutive 3,4,5 bars in a row you get an message.
Parameters Bars_Limit = total visible cubes
TF_M1 = true; TF_M2 = false; TF_M3 = false; TF_M4 = false; TF_M5 = true; TF_M6 = false; TF_M10 = false; TF_M12 = false; TF_M15 = true; TF_M20 = false; TF_M30 = true; TF_H1 = true; TF_H2 = false; TF_H

缠中说禅 MACD 指标 四色双线MACD 显示柱子的面积的和 InpFastMA=12; // Fast EMA period InpSlowMA=26; // Slow EMA period InpSignalMA=9; // Signal SMA period InpAppliedPrice=PRICE_CLOSE;// Applied price InpMaMethod=MODE_EMA; //Ma_Method input bool ChArea= false; //chzhshch Area Fast EMA period 快线参数 Slow EMA period 慢线参数 Signal SMA period 信号线参数 应用价格 可选
缠论里面定义的趋势力度的对比,2段趋势进行对比,对比柱子面积的和 本指标计算了相应面积的和方便对比
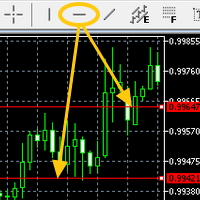
Attach the indicator on the chart and draw the red line from the button on MT5's built-in menu bar then the alert will be sent to you(push,email,popup and sound)
Hi You all know the red line (the MT5 built-in red line) drawn from the menu bar on MT5. It is often used to check the resistance etc.....It is very useful but it is little troublesome to get an alert(sound, push, email and popup) when the red line is touched by the price. Here is Price Touch Alert indication, just use the button t

Candlestick patterns
The candlestick Pattern Indicator and Scanner is designed to be a complete aid tool for discretionary traders to find and analyze charts from powerful candle patterns. Recognized Patterns:
Hammer Shooting star Bearish Engulfing Bullish Engulfing Doji Marubozu
Scanner Imagine if you could look at all the market assets in all timeframes looking for candlestick signals.

Using this indicator is very simple, since the simplest is to look at the chart and act according to the color arrows.
When calculating this indicator, the logarithmic gains are first calculated at the closing price, which allows you to filter out the trend, seasonality and other inclusions that spoil the volatility picture, then the standard square deviation is constructed from the data obtained.
Such a calculation option takes into account intraday price fluctuations and focuses on measur
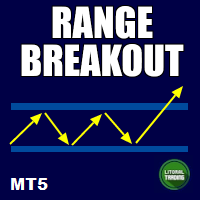
This is an indicator that highlights the price range, specifically in the morning. So it is very easy to identify when these zones are broken, giving you an excellent entry opportunity! Range Breakout works on all symbols and timeframes. It displays past price regions and projects the current one. If you find any bug or have any suggestion, please, contact us. Enjoy!
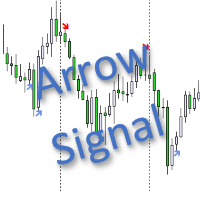
该指标属于“随机”类别。我试图尽可能地简化指标控制,因此输入参数中显示了最小设置:这是信号箭头图标的选择。 “Buy”信号用' Buy Arrow code '参数编码,“Sell”信号用' Sell Arrow code '参数编码。信号的信号箭头代码(请使用 32 到 255 的值)取自 Wingdings 字体。 该指标适用于每个价格变动并在当前柱上搜索信号(当前柱是图表上最右边的柱),因此当信号在当前柱上出现和消失时可能出现这种情况。了解此属性后,如果您想接收早期信号,您可以使用来自当前柱线的信号。但与此同时,这将是一个风险更大的交易。如果您使用来自前一根柱线的信号,则此类交易将更加安全。 在版本 2 中,信号搜索算法已更改 - 版本 2 切断了一些错误信号。

Индикатор Coefficient Of Determination (COD) представляет собой значение коэффициента детерминации или квадрат коэффициента корреляции между зависимой переменной — ценой и объясняющей переменной — тиковым объемом. Что это дает нам на практике? COD отлично распознает кульминацию трендовых движений, что позволяет подбирать оптимальные точки и ловить развороты рынка. Как использовать индикатор: Наиболее популярная торговая стратегия строится совместно с трендовым индикатором Moving Average (MA), пе

O GRIDBOT WIM robô de investimento para Mini Índice.
Parametrizado com grade linear ou zona de expansão (FIMATHE).
CONFIGURAÇÕES: Ponto de entrada Pivot dia anterior double r1 = pivot + distance; double r2 = r1 + distance; double r3 = r2 + distance; double r4 = r3 + distance; double r5 = r4 + distance; double r6 = r5 + distance; double r7 = r6 + distance; double r8 = r7 + distance; double r9 = r8 + distance; double r10 = r9 + distance; double s1 = pivot
Smart Breakout Indicator determines support and resistance levels and also shows the breakout points of the levels in the form of a histogram.
The program contains two indicators in one: 1-support and resistance lines, 2-histogram indicator based on high price fluctuations. The indicator autonomously calculates the best support and resistance levels and also in the form of a histogram shows the best moments of the breakdown of the lines.
The histogram indicator is based on the action of p

Despite the popularity of inside bar pattern among the traders, using it as a standalone signal doesn't provide any edge in the market.
KT Inside Bar Advanced indicator solves this problem by combining the classic inside bar pattern with the "ECE" cycle and Fibonacci extensions. Using this indicator in place of our classic inside bar indicator will provide a tremendous advantage and edge in the market.
What is the ECE cycle?
In financial markets, the price never moves in a straight line bu

The indicator monitors the market trend, ignoring sharp fluctuations in the market and noise around the average price. Shows points for entering the market, points of potential market reversal. The indicator implements a kind of technical analysis based on the idea that the market is cyclical in nature. The indicator can be used both for pipsing on small periods, and for long-term trading.

Hello, pleasure to welcome you here, my name is Guilherme Santos. QB Indicator is the best indicator with easy to setup built-in RSI, truly a powerful tool! Basically its concept is to indicate entries in regions of market exhaustion. Just attach it with the default settings on any currency pair and watch the magic happen. Also try and other timeframes like M1 and M15. Some settings available: RSI Period RSI Overbought Limit RSI Oversold Limit when to buy When the indicator sets a green arrow on

我们的目标是提供无障碍和高质量的服务,使市场参与者、交易员和分析师都能获得及时的市场行情的交易决策所需的市场观察指标。 这是最优化,高度稳健和易于使用的动态趋势分析指标。 DYJ市场观察指标试图用两种不同的方法来衡量市场的看涨和看跌力量,每种方法都有一种。
该指标的熊市指数尝试衡量市场对价格下降趋势。
该指标的牛市指数尝试衡量市场对价格上涨趋势。
Pivot是市场观察指标的额外指标。Pivot含有6种策略:经典,卡玛瑞拉,无敌,斐波纳奇,网络布局,黄金分割. 另外点评里,采用多个辅助指标RSI,MACD,MA,布林带等过滤假信号. 我们的Pivot指标是基于先进的算法计算支点和支持和阻力水平。
它们对未来重要的价格水平和可能的市场逆转做出难以置信的准确预测。
适用于所有市场(外汇、大宗商品、股票、指数和其他)和时间框架。
特点: 同时监视所有对。 默认情况下,指标监视报价窗口的全部货币对。 它只从一个图(m1到mn)运行。 参数: inplanguage=english -- 英语或中文 inEntryPercent=Mid_70 -- 趋势百分比要求70%或
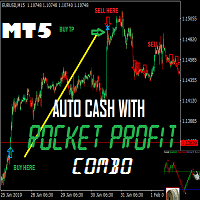
This is a great Metatrader5 Tool , which you can use Daily for your profitable Trading. The Accuracy is the best system you need to succeed in trading without stress. The signals doesn't repaint at all, alerts on bar close, and stays glued. The system works on MT5 and another version for MT4 also available.
What you get upon purchase:
-Lifetime support for the use of the system - Easy to use, clean user friendly interface with no single settings required - Arrow Signals showing where t
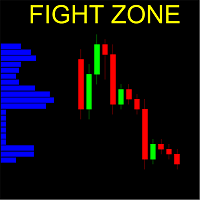
Vertical bar chart of candles!
What is it
This indicator creates a vertical bar chart of all visible candles corresponding to the amount of candles that the bars cross. The goal of this indicator is to easily check the places or regions where the candles concentrate. Those regions are a good place to place positions because they have a increased chance of staying more time there again.
It's hard to explain in words the exactly working of this indicator, we suggest you watch the video, it i
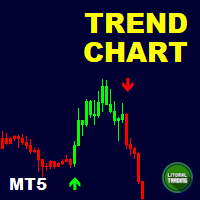
Are you the trend surfing type? Do you like to follow the big sharks? Nope? So you are the type that trades reversion? Awaiting the trend exhaustion and entering on trade?
So this indicator is for you ! With it is extremely easy to identify the trend and when it reverses because the chart is automatically colored according to a defined moving average. You can change it settings and make it your own (or hide it).
In addition it is possible to have indicative arrows on chart and also popup and
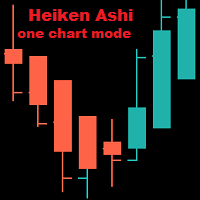
Heiken Ashi On One Chart Mode The indicator is displayed only on one of the chart modes: Bars, Candles, Line. The default is Bars. When switching the chart mode, the indicator is displayed or disappears depending on the chart mode. Input parameters: iChartMode: on what chart mode should the indicator be displayed mBars mCandles mLine Colors: LightSeaGreen: bull candle Tomato: bear candle
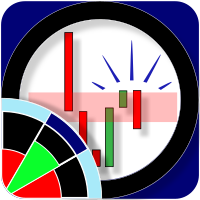
ZoneFinder is an indicator panel that presents an interactive, multi-timeframe visualisation of trend direction and strength. Trend strength and direction is measured using a modified ADX indicator based on smoothed DI+ and DI- values. High probability trading zones are identified using Fibonacci retracements. Where such zones are found, they are marked on the chart together with a proposed Fibonacci targets.

Candlestick Patterns MT5 is a simple and convenient indicator able to define 29 candle patterns.
Advantages Defines and highlights 29 candle patterns; Estimated trading direction is shown as an arrow; Each candlestick pattern can be disabled in the settings; The indicator can be used as an arrow indicator in EAs.
Parameters TextSize - chart text size; TextColor - chart text color; Alert - enable/disable alerts; ---------- Candlestick Patterns ------------- - settings separator; AdvanceB

引入 Awesome Oscillator Alert ,这是一个强大的技术指标,可为交易者提供有关市场动态和交易机会的宝贵见解。凭借其全面的功能和用户友好的界面,该指标是希望在市场上获得优势的交易者的必备工具。
Awesome Oscillator Alert 的突出特点之一是它与所有货币对和时间框架的兼容性。无论您是交易主要货币对还是外来货币,该指标都可以无缝集成到您的交易策略中。此外,用户友好的界面允许轻松自定义参数,确保您可以定制指标以满足您的个人交易偏好。
实时警报是成功交易的一个重要方面,而 Awesome Oscillator Alert 可以精确地提供它们。您将通过弹出窗口、声音和移动警报接收即时通知,让您随时了解重要的进入和退出信号。这种实时反馈使您能够及时做出交易决策并利用市场机会。
该指标提供两种可靠的交易策略:飞碟策略和零线交叉策略。飞碟策略识别直方图列中的模式,根据特定条件提供清晰的买入和卖出信号。另一方面,零线交叉策略着重于震荡指标与零线之间的相互作用,指导交易者何时进场或出场。
借助 Awesome Oscillator Ale
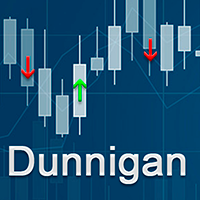
This is a trend indicator based on a strategy created by William Dunnigan that emit signals to buy or sell on any timeframe and can assist in decision making for trading on stock market or Forex. The signals are fired according to the following rules: Buy Signal = Fired at the first candlestick in which close price is higher than the higher price of the last candlestick. The higher and lower prices of the current candlestick must be higher than the corresponding ones of the last candlestick as w

The Metatrader 5 has a hidden jewel called Chart Object, mostly unknown to the common users and hidden in a sub-menu within the platform. Called Mini Chart, this object is a miniature instance of a big/normal chart that could be added/attached to any normal chart, this way the Mini Chart will be bound to the main Chart in a very minimalist way saving a precious amount of real state on your screen. If you don't know the Mini Chart, give it a try - see the video and screenshots below. This is a gr

The VMA is an exponential moving average that adjusts its smoothing constant on the basis of market volatility. Its sensitivity grows as long as the volatility of the data increases. Based on the Chande's Momentum Oscillator, the VMA can automatically adjust its smoothing period as market conditions change, helping you to detect trend reversals and retracements much quicker and more reliable when compared to traditional moving averages.

Every trader knows that he or she should never Risk more than 2% (or 5%) per trade. This is a Money Management law and an usable LotSize should be calculated each time because a trader must use a different StopLoss value for different Support and Resistant level. This indicator will calculate an appropriate LotSize for the moment when you will put it on the chart and each time you will drag the "Stop Loss Line" in any direction.
Inputs: Order_Type - Buy or Sell TakeProfitPoints - how many p
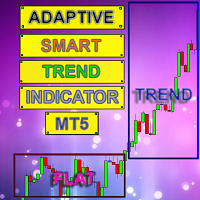
Smart indicator Adaptive Smart Trend Indicator determines the sectors of the Trend and the Flat and also in the form of a histogram shows the breakdown points of the levels (1 - 5).
The indicator performs many mathematical calculations to display more optimal Trend movements on the chart.
The program contains two indicators in one: 1 - draws the Trend and Flat sectors, 2 - the histogram indicator shows the best signals for opening an order. The indicator autonomously calculates the mo

The Rise of Sky walker is a trend indicator is a powerful indicator for any par and any timeframe. It doesn't requires any additional indicators for the trading setup.The indicator gives clear signals about opening and closing trades.This Indicator is a unique, high quality and affordable trading tool. Can be used in combination with other indicators Perfect For New Traders And Expert Traders Low risk entries. Never repaints signal. Never backpaints signal. Never recalculates signal. Great Fo

Crossing of market price and moving average with all kinds of alerts and features to improve visualization on the chart.
Features Crossing of market price and Moving Average (MA) at current bar or at closing of last bar; It can avoid same signals in a row, so it can allow only a buy signal followed by a sell signal and vice versa; MA can be set for any of the following averaging methods: Simple Moving Average (SMA), Exponential Moving Average (EMA), Smoothed Moving Average (SMMA), Linear-w

- This is an indicator of directional movement that allows you to determine the trend at the time of its inception and set the levels of a protective stop.
Trailing can be carried out both from below, when the stop level is below the current price and is pulled up behind the price if it increases, and above, when stop levels are above the current price.
Unlike trailing with a constant distance, the stop level is set at the lower boundary of the quadratic regression channel (in the case of t

The Breakout Box for MT5 is a (opening) range breakout Indicator with freely adjustable: - time ranges - end of drawing time - take profit levels by percent of the range size - colors - font sizes It can not only display the range of the current day, but also for any number of days past. It can be used for any instrument. It displays the range size and by request the range levels and the levels of the take profit niveaus too. By request it shows a countdown with time to finish range. The indic

Powerful trend indicator provided with all necessary for trade and it is very easy to use. Everyone has probably come across indicators or Expert Advisors that contain numerous input parameters that are difficult to understand. But here, input parameters are simple and it is no need to configure anything — neural network will do all for you.
Difference from a classic version
The real-time multi time frame panel is added, so you can check a trend for other timeframes without switching the sche

KT Power Pennant finds and marks the famous pennant pattern on the chart. A pennant is a trend continuation pattern with a significant price movement in one direction, followed by a period of consolidation with converging trend-lines.
Once a pennant pattern is formed, a buy/sell signal is provided using a bullish or bearish breakout after the pattern formation. MT4 Version is available here https://www.mql5.com/en/market/product/44713
Features
Pennant patterns provide a low-risk entry aft
This app supports customer investments with equipment financing and leasing solutions as well with structured chat Our success is built on a unique combination of risk competence, technological expertise and reliable financial resources.
Following topics are covered in the Trading Support Chat -CUSTOMISATION -WORKFLOW -CHARTING TIPS -TRADE ANALYSIS
PLEASE NOTE That when the market is closed, several Brokers/Metatrader servers do not update ticks from other timeframes apart from the current

Trend indicator Carina . The implementation of the trend indicator is simple - in the form of lines of two colors. The indicator algorithm is based on standard indicators as well as our own mathematical calculations. The indicator will help users determine the direction of the trend. It will also become an indispensable adviser for entering the market or for closing a position. This indicator is recommended for everyone, both for beginners and for professionals.
How to interpret information f

Horizontal Volumes Indicator - using a histogram, displays the volume of transactions at a certain price without reference to time. At the same time, the histogram appears directly in the terminal window, and each column of the volume is easily correlated with the quote value of the currency pair. The indicator practically does not require changing the settings, and if desired, any trader can figure them out.
The volume of transactions is of great importance in exchange trading, usually an in

*Non-Repainting Indicator Arrow Indicator with Push Notification based on the Synthethic Savages strategy for synthethic indices on binary broker.
Signals will only fire when the Synthethic Savages Strategy Criteria is met BUT MUST be filtered.
Best Signals on Fresh Alerts after our Savage EMA's Cross. Synthethic Savage Alerts is an indicator that shows entry signals with the trend. A great tool to add to any chart. Best Signals occur on Fresh Alerts after our Savage EMA's Cross + Signal

mql4 version: https://www.mql5.com/en/market/product/44606 Simple indicator to calculate profit on fibonacci retracement levels with fixed lot size, or calculate lot size on fibonacci levels with fixed profit. Add to chart and move trend line to set the fibonacci retracement levels. Works similar as default fibonacci retracement line study in Metatrader. Inputs Fixed - select what value will be fix, lot or profit Fixed value - value that will be fix on all levels Levels - levels for which

The Candlestick Patterns indicator for MT5 includes 12 types of candlestick signales in only one indicator. - DoubleTopsAndBottoms - SmallerGettingBars - BiggerGettingBars - ThreeBarsPlay - TwoBarsStrike - Hammers - InsideBars - OutsideBars - LongCandles
- TwoGreenTwoRed Candles - ThreeGreenThreeRed Candles The indicator creats a arrow above or under the signal candle and a little character inside the candle to display the type of the signal. For long candles the indicator can display the exac

Indicador Taurus All4 Taurus All4
O Taurus All4 é um indicador de alto desempenho, que indica a força da tendência e você pode observar a força da vela. Nosso indicador tem mais de 4 confirmações de tendência.
É muito simples e fácil de usar.
Modos de confirmação Confirmações de tendências de velas: Quando a vela muda para verde claro, a tendência é alta. Quando a vela muda para vermelho, a tendência está voltando para baixo. Quando a vela muda para vermelho escuro, a tendência é baixa.
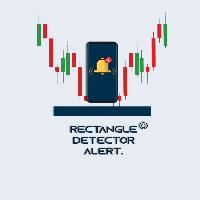
Rectangle Detector Alert
About Rectangle Detector Alert Indicator
Rectangle detector alert detects manually drawn rectangle shapes on charts and sends out push notifications
also auto extending the rectangles at the same time as new candles form.
The concept behind this indicator is based on the manual trading of supply and demand zones. Most traders prefer
to draw their supply (resistance) and demand (support) zones manually instead of depending on indicators to auto draw
the

The main idea of this product is to generate statistics based on signals from 5 different strategies for the Binary Options traders, showing how the results would be and the final balance based on broker's payout.
Strategy 1: The calculation is secret. Strategy 2: The signal is based on a sequence of same side candles (same color). Strategy 3: The signal is based on a sequence of interspersed candles (opposite colors). Strategy 4: The signal consists of the indicators bollinger (we have 3 typ

This product is a set of tools that help the trader to make decisions, bringing information from different categories that complement each other: trend, support / resistance and candle patterns. It also has a panel with information about the balance. The trend has two different calculations and is shown as colored candles. Strategy 1 is longer, having 3 different states: up, down and neutral trend. Strategy 2 has a faster response and has only 2 states: up and down trend. Support and resistance

Fibonacci Múltiple 12, utiliza la serie fibonacci plasmado en el indicador fibonacci, aumentadolo 12 veces según su secuencia. El indicador fibonacci normalmente muestra una vez, el presente indicador se mostrara 12 veces empezando el numero que le indique siguiendo la secuencia. Se puede utilizar para ver la tendencia en periodos cortos y largos, de minutos a meses, solo aumentado el numero MULTIPLICA.

The indicator for trading on the signals of the harmonic pattern AB=CD. It gives signals and shows the levels of entry into the market, as well as levels for placing stop orders, which allows the trader to make timely decisions on entering the market, as well as effectively manage positions and orders. It supports sending push notifications to a mobile device, e-mail, as well as alerts. This indicator has been ported from the version for MetaTrader 4. For more information, as well as a detailed

1. Why did I develop this series of indicators
I found that most traders need to use multiple time frame indicators. They usually switch time frame to see indicators. However, once the timeframe is switched, you cannot see the corresponding relationship between the price in the smaller timeframe and the indicator in the larger timeframe . For example: if your price chart is in H1 timeframe, you can see H4, D1 and W1 indicators in H1 timeframe Chart. This is more helpful for you to find t
MetaTrader 市场 - 在您的交易程序端可以直接使用为交易者提供的自动交易和技术指标。
MQL5.community 支付系统 提供给MQL5.com 网站所有已注册用户用于MetaTrade服务方面的事务。您可以使用WebMoney,PayPal 或银行卡进行存取款。
您错过了交易机会:
- 免费交易应用程序
- 8,000+信号可供复制
- 探索金融市场的经济新闻
注册
登录