适用于MetaTrader 5的新技术指标

Divergence Force 背离指标 描述 Divergence Force 是一个旨在识别资产价格与MACD(移动平均收敛/发散)之间背离的指标。此指标自动绘制价格和MACD的高点和低点上的趋势线,突出潜在的交易机会。 主要功能 自动识别背离 :该指标自动检测价格与MACD之间的看涨和看跌背离。 趋势线跟踪 :自动绘制价格的连续高点和低点上的趋势线,并与MACD的高点和低点进行比较。 买入和卖出信号 :在图表上清晰显示买入("Buy")和卖出("Sell")信号,当检测到背离时显示。当未检测到背离时显示"Neutral"。 标准MACD参数 :使用标准的MACD参数(12, 26, 9)进行计算,确保结果可靠和被认可。 兼容不同时间框架 :优化为在1小时时间框架上运行,但可以根据用户的偏好应用于其他时间框架。 使用方法 安装 :将指标添加到MetaTrader 5平台的 Indicators 文件夹中。 应用到图表 :将指标加载到所需的图表中。该指标将自动开始绘制趋势线并识别背离。 信号解释 : Buy :当检测到看涨背离时,指标将显示"Buy"信号。 Sell :当检测到
FREE

The indicator is designed to detect range market or consolidation areas on the chart. It does this by using the market volatility and price momentum. The indicator signals the start and stop of the range with icons on the chart and various type of alerts options provided in the input settings. Usage: The indicator can be used to check the state of the market i.e. trending or ranging to make appropriate decision and use strategies designed for specific market state. Please see the attached video

Live Trading Results MT4 Version Contact for Manual Guide Next Price $125 Strategy - Breakout / Retest / Aggressive Hello Everyone, We are excited to introduce one of the most reliable and high win rate patterns in trading: the Cup and Handle . This is the first time we are releasing this meticulously crafted indicator, boasting an impressive 95% success rate . It is versatile and effective across all types of pairs, stocks, indices, bonds, and futures.
This patte
===>此指标有什么作用? 它绘制了选择时间范围的单个 VEMA 平均值。
成交量加权指数移动平均线 (VEMA) 是一种对近期数据和高成交量柱线给予更多权重的移动平均线。
这意味着高交易量柱上的价格波动将对 VEMA 产生更大的影响。
它根据时间范围的选择绘制单个 WWMA 平均值
您可以根据需要多次将该指标放在图表上进行平均。
选择平均值的参数和特征,就是这样! ****请参阅屏幕截图01至02
请不要犹豫,要求我提供ICUSTOM代码,以轻松将此平均值集成到您自己的代码,另一个指标或EA中
选择 目标时间范围 期间数 滞后 所需的OHLC 时尚颜色 您可以在代码库和现在以“ William210”的名义找到我的所有出版物。
===>一些示例 这里有一些简单的示例,可以使用多个时间范围的移动平均
比特币上的示例 添加2个移动平均值20,每天在时间范围内,在H6上添加1个,然后在H1中查看 ****请参阅3到5的屏幕截图
S&P500的示例 在每日添加3个移动平均时间为20个时期 ****请参阅6到7的屏幕截图
黄金的例子 每天在每天添加

Добро пожаловать в новую эпоху торговли с индикатором AI Moving Average, передовым индикатором MetaTrader 5, разработанным для предоставления трейдерам предсказательной информации о движениях рынка. Этот инструмент сочетает в себе мощь ИИ с надежностью экспоненциального скользящего среднего без запаздывания для точных и своевременных прогнозов будущих ценовых тенденций. Инновационная модель линейной регрессии Индикатор AI Moving Average использует модель машинного обучения линейной регрессии для
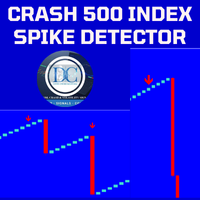
Spike Detector for Boom and Crash Indices
The Spike Detector is specifically designed to cater to the unique needs of traders in the Boom and Crash indices markets. Optimized for M1 (1-minute) and M5 (5-minute) timeframes, this tool ensures you receive timely and actionable insights. Below, you'll find a comprehensive guide on its key features, advantages, installation process, and how to use it effectively.
Key Features and Advantages
1. Non-Repainting: The Spike Detector guarantees accu

本指标显示吞没形态,吞没形态是资金流最直接的体现.
吞没形态(Engulfing Pattern)是技术分析中一种常见的价格反转形态,通常出现在价格趋势的终点或关键的支撑与阻力位。它可以分为两种类型:看涨吞没形态(Bullish Engulfing Pattern)和看跌吞没形态(Bearish Engulfing Pattern)。
看涨吞没形态(Bullish Engulfing Pattern) 特征:
前一根K线:这是一个小实体的阴线(开盘价高于收盘价)。 后一根K线:这是一个大实体的阳线(开盘价低于收盘价),且阳线的实体完全包住前一根阴线的实体。 含义:
出现位置:通常出现在下跌趋势的末端,表明卖方力量逐渐衰竭,买方力量开始占据主导。 预示着价格可能反转向上,是一种看涨信号。
看跌吞没形态(Bearish Engulfing Pattern) 特征:
前一根K线:这是一个小实体的阳线(开盘价低于收盘价)。 后一根K线:这是一个大实体的阴线(开盘价高于收盘价),且阴线的实体完全包住前一根阳线的实体。 含义:
出现位置:通常出现在上升趋势的末端,表明
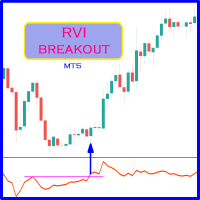
Probability emerges to record higher prices when RVi breaks out oscillator historical resistance level. It's strongly encouraged to confirm price breakout with oscillator breakout since they have comparable effects to price breaking support and resistance levels; surely, short trades will have the same perception. As advantage, a lot of times oscillator breakout precedes price breakout as early alert to upcoming event as illustrated by last screenshot. Furthermore, divergence is confirmed in
FREE

The Market Matrix indicator is an effective tool for identifying trends in the Forex market. It serves as a reliable assistant for traders, helping to identify trend and flat zones. Below are the main characteristics and advantages of this indicator:
Features of the Market Matrix indicator: Reliability and stability: The indicator does not redraw previous values, which ensures the stability of signals. Quick reaction to trend changes: The indicator algorithm allows you to quickly respond to t

Swing Sentry is an advanced technical indicator specifically created for Forex traders. It works based on a unique algorithm that allows you to predict future prices by analyzing historical data for a user-specified period.
The indicator provides traders with valuable information about possible changes in the direction of price movement. The special formula behind Swing Sentry accurately calculates signals, effectively identifying moments of reversal or sharp price movements in one direction.

Pivot Points are used by Forex traders to find support and resistance levels based on the previous day's price action. There are various ways to calculate pivot points, including averaging the open, high, low, and close of the previous day's chart price.
Forex Traders use a combination of pivot points with moving averages to find trading opportunities in the currency markets.
Pivot points are very useful tools that use the previous bars' highs, lows and closings to project support and re
FREE
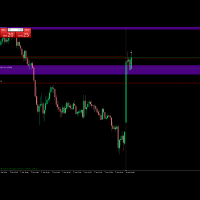
Your average price indicator for the position you were looking for. This indicator inserts a horizontal line on your chart when you are positioned, long or sold, after completing the partial. After completing the partial, it inserts the horizontal line on the graph visually showing where the true BreakEven of the operation is. Take a look the line of point 0 of operation.
Seu indicador de preço médio da posição que estava procurando. Este indicador insere uma linha horizontal no seu gráfico q
FREE

The "Channel Craft" indicator is a classic tool from the family of channel indicators, allowing traders to react promptly to price movement beyond the established channel boundaries. This channel is formed based on the analysis of several candles, starting from the last one, which helps identify the extremes within the studied range and construct channel lines. Trading within the channel is one of the most popular strategies in the forex market, and its simplicity makes it accessible even to no

This variant of the ZigZag indicator is recalculated at each tick only at the bars that were not calculated yet and, therefore, it does not overload CPU at all which is different from the standard indicator. Besides, in this indicator drawing of a line is executed exactly in ZIGZAG style and, therefore, the indicator correctly and simultaneously displays two of its extreme points (High and Low) at the same bar!
Depth is a minimum number of bars without the second ma
FREE
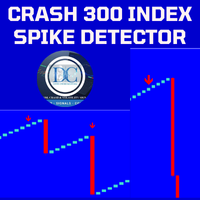
Spike Detector for Boom and Crash Indices
The Spike Detector is specifically designed to cater to the unique needs of traders in the Boom and Crash indices markets. Optimized for M1 (1-minute) and M5 (5-minute) timeframes, this tool ensures you receive timely and actionable insights. Below, you'll find a comprehensive guide on its key features, advantages, installation process, and how to use it effectively.
Key Features and Advantages
1. Non-Repainting: The Spike Detector guarantees accu

** Attention! This indicator is a market tool that can lead to substantial losses; use it at your own risk ** Operation: Histograms with positive or negative values, where positive means possible strength of the current movement, and negative means possible weakness. Colors: red indicates relative strength to the downside, green indicates an upward movement, and yellow indicates an alert state! The calculation period can be adjusted to your liking! I recommend using it on a demo account before u

The entry points provided by the Olo May indicator should be considered as potential points of change in market direction. This indicator is based on the use of a cyclic wave relationship, which makes each entry point optimal for identifying changes in movement.
The simplest way to use this indicator is to open a position in the direction of the current trend. However, the best results are achieved when combining it with fundamental news, as it can be used as a tool to filter news events, sho

This technical analysis indicator allows you to determine with high probability whether a trend or a flat pattern prevails in the market. It can be used both for trading within a channel and for breakout trading, provided that stop losses are used to protect against false signals.
The indicator displays the channel in the form of lines located above and below the price, like other similar indicators. The upper and lower lines can also act as resistance and support levels.
It quite accuratel
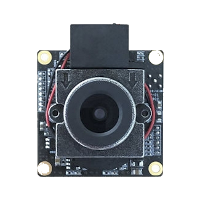
The Oriole indicator is designed to identify price trends and allows you to quickly determine not only the direction of the trend, but also the levels of interaction between buyers and sellers. It works on all timeframes and currency pairs.
The Oriole indicator provides fairly accurate signals and can be used in both trending and flat markets. It is recommended to use it in combination with other tools to get more reliable signals and make informed decisions.
The indicator does not redraw,

实际应用中的作用
趋势反转识别 :K线倒计时指标通过识别市场的过度买卖行为,帮助交易者捕捉趋势反转的信号。这个指标在市场处于极端状态时尤为有效。 风险管理 :该指标可以帮助交易者在趋势反转之前识别市场的潜在风险,及时调整仓位以避免损失。例如,在看涨倒计时完成时,可以考虑减少多头头寸或在看跌倒计时完成时减少空头头寸。 交易策略 :交易者可以将K线倒计时指标作为交易策略的一部分,与其他技术指标结合使用,以提高信号的可靠性。例如,可以与移动平均线、相对强弱指数(RSI)、布林带等指标结合,以确认趋势反转信号。 时间窗口 :通过倒计时阶段的设定,交易者可以更清晰地了解潜在反转的时间窗口,从而更有效地规划交易策略和执行时间。
The indicator displays support and resistance levels based on fibonacci level in multi period Creates lines indicating the latest support and resistance levels.
These lines are updated whenever there is a change in support or resistance levels. Labels are removed if the corresponding conditions are not met.
the period is availble in setting and level fibonacci
FREE
The Interactive RSI indicator can generate RSI divergence with the availability of user defined filters. It can generate voice alerts for RSI oversold and RSI Overbought situations. Moreover it can also generate voice alerts for RSI Divergneces as well as when price breaks above or breaks below the support and resistances created upon divergence ouccurence. The voice alerts are generated in a way that you will know which market has reached the oversold and overbought conditions as well as the r

Introducing Smart Gold Pro, a versatile trading indicator suitable for all experience levels. It provides precise buy and sell signals for the gold market, adaptable to any timeframe. Powered by advanced algorithms, Smart Gold Pro accurately analyzes price movements and volume dynamics. What sets Smart Gold Pro apart is its reliability—it doesn't repaint past signals, ensuring dependable insights into potential market reversals. Its user-friendly visual interface on the chart, along with audible

Evaluate operational viability in each timeframe and in any instrument, according to their respective spread and percentage volatility, which are essential for correct risk management in your trades.
This indicator is essential for both Day Traders and Swing Traders, as in addition to evaluating operational viability in each timeframe, it is also possible to identify the fair minimum stop for each period and instrument.
Example in Swing Trade: your broker charges a spread equivalent to 0.05

Price update indicator — can issue any type of alert when the price reaches certain levels set by a trader. There are three types of price levels: the first one is used when the price rises above certain level (displayed with the green line on the chart), the second one is used when the price falls below certain level (displayed with the red line on the chart), and the third one is used when the price reaches the certain level exactly (displayed with the yellow line). Three alert types include

Descubra o poder do nosso indicador de alta precisão, projetado para identificar as regiões de alvo e exaustão de qualquer ativo. Testado e validado por mais de 3 anos nos mercados de mini dólar e mini índice, ele oferece confiabilidade e eficácia incomparáveis. Transforme sua estratégia de trading e alcance novos patamares de sucesso com nossa ferramenta inovadora.
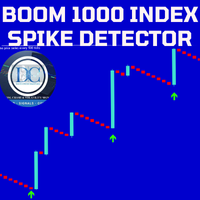
Our Spike Detector is specifically engineered to cater to the unique needs of traders in the Boom and Crash indices markets. This tool is optimized for M1 (1-minute) and M5 (5-minute) timeframes, ensuring you receive timely and actionable insights.
Key Features: 1. **Non-Repainting**: Our detector guarantees accuracy with non-repainting signals, ensuring your data remains consistent and reliable. 2. **Push Notifications**: Stay updated with real-time push notifications, so you never miss a cr

MSnR Lines 是一个自定义指标,旨在在图表上显示支撑和阻力水平。这些水平基于马来西亚支撑和阻力理论,该理论将水平定义为特定的价格水平,而不是区域,这些价格水平是从线图的峰值和谷值中派生出来的。 特点: 三种类型的水平:A-Level,V-Level和间隙水平。 水平的新鲜度指示:新鲜水平比非新鲜水平更重要。新鲜水平指尚未被测试或已经被交易。 可自定义新鲜水平和非新鲜水平的颜色和样式。 仅显示新鲜水平或所有水平的选项。 可调整的回溯期和当前价格上下方水平的数量。 支持多时间框架。 用途:
交易者可以使用MSnR Lines来识别潜在的支撑和阻力水平以做出交易决策。新鲜水平被认为更为重要,并且可能提供更好的交易机会。此外,交易者还可以根据不同时间框架上的水平来进行多时间框架分析,以提高交易决策的准确性和可靠性。

这个强大的工具会自动识别趋势线,帮助您简化交易策略并做出更明智的决策。 mt4版本
关键功能 自动趋势线检测 :“基本趋势线”指标扫描了市场的潜在趋势线,并立即在图表上显示它们。这样可以节省您的宝贵时间,并确保您永远不会错过重要的趋势。 用户友好的面板 :我们的指示器配有美丽,直观的面板,可让您轻松绘制各种趋势线。该面板专为所有经验级别的交易者而设计,仅需单击几下即可添加,编辑或删除趋势线。 保存和管理您喜欢的趋势线 :跟踪对您最重要的趋势线。我们的指标使您可以保存首选的趋势线,并在您重新访问图表时始终可用。 多功能应用程序 :无论您是交易外汇,股票还是加密货币,“基本趋势线”指标适应各个市场,为您提供可靠的工具来增强交易策略。 输入 Number of Reactions :您可以确定价格对趋势线反应的次数。 Reaction Strength :一个较高的数字意味着只考虑了更强的反应。 Price Mode :趋势线可以在高/低价格上或关闭/关闭。 Max Length of Trend Line :使用此条目,您可以确定趋势线的最大长度。根据酒吧的数量。 Ex
===>此指标有什么作用? 他只能在时间范围内选择一个平均EMA
您将此指标放在图形上,因为您需要平均。
选择平均水平的参数和特征,仅此而已!!! ****请参阅屏幕截图01至02
请不要犹豫,要求我提供ICUSTOM代码,以轻松将此平均值集成到您自己的代码,另一个指标或EA中
选择 目标时间范围 期间数 滞后 所需的OHLC 时尚颜色 您可以在代码库和现在以“ William210”的名义找到我的所有出版物。
===>一些示例 这里有一些简单的示例,可以使用多个时间范围的移动平均
比特币上的示例 添加2个移动平均值20,每天在时间范围内,在H6上添加1个,然后在H1中查看 ****请参阅3到5的屏幕截图
S&P500的示例 在每日添加3个移动平均时间为20个时期 ****请参阅6到7的屏幕截图
黄金的例子 每天在每天添加2个移动平均值50和20个时期,然后查看H1 ****请参阅8到9的屏幕截图
你的 分享您的使用设置,并找出其他交易者如何使用此指标来优化其策略!
===>为谁? 无论您是酌情交易者,算法交易者还是开发人员,该指标都旨在满
===>此指标有什么作用? 他只能在时间范围内选择一个平均SMMA
您将此指标放在图形上,因为您需要平均。
选择平均水平的参数和特征,仅此而已!!! ****请参阅屏幕截图01至02
请不要犹豫,要求我提供ICUSTOM代码,以轻松将此平均值集成到您自己的代码,另一个指标或EA中
选择 目标时间范围 期间数 滞后 所需的OHLC 时尚颜色 您可以在代码库和现在以“ William210”的名义找到我的所有出版物。
===>一些示例 这里有一些简单的示例,可以使用多个时间范围的移动平均
比特币上的示例 添加2个移动平均值20,每天在时间范围内,在H6上添加1个,然后在H1中查看 ****请参阅3到5的屏幕截图
S&P500的示例 在每日添加3个移动平均时间为20个时期 ****请参阅6到7的屏幕截图
黄金的例子 每天在每天添加2个移动平均值50和20个时期,然后查看H1 ****请参阅8到9的屏幕截图
你的 分享您的使用设置,并找出其他交易者如何使用此指标来优化其策略!
===>为谁? 无论您是酌情交易者,算法交易者还是开发人员,该指标都旨在
===>此指标有什么作用? 他只能在时间范围内选择一个平均LWMA
您将此指标放在图形上,因为您需要平均。
选择平均水平的参数和特征,仅此而已!!! ****请参阅屏幕截图01至02
请不要犹豫,要求我提供ICUSTOM代码,以轻松将此平均值集成到您自己的代码,另一个指标或EA中
选择 目标时间范围 期间数 滞后 所需的OHLC 时尚颜色 您可以在代码库和现在以“ William210”的名义找到我的所有出版物。
===>一些示例 这里有一些简单的示例,可以使用多个时间范围的移动平均
比特币上的示例 添加2个移动平均值20,每天在时间范围内,在H6上添加1个,然后在H1中查看 ****请参阅3到5的屏幕截图
S&P500的示例 在每日添加3个移动平均时间为20个时期 ****请参阅6到7的屏幕截图
黄金的例子 每天在每天添加2个移动平均值50和20个时期,然后查看H1 ****请参阅8到9的屏幕截图
你的 分享您的使用设置,并找出其他交易者如何使用此指标来优化其策略!
===>为谁? 无论您是酌情交易者,算法交易者还是开发人员,该指标都旨在
===>此指标有什么作用? 它是按交易量加权的移动平均线,它是根据交易量进行精确平滑
它根据时间范围的选择绘制单个 WWMA 平均值
您可以根据需要多次将该指标放在图表上进行平均。
选择平均值的参数和特征,就是这样! ****请参阅屏幕截图01至02
请不要犹豫,要求我提供ICUSTOM代码,以轻松将此平均值集成到您自己的代码,另一个指标或EA中
选择 目标时间范围 期间数 滞后 所需的OHLC 时尚颜色 您可以在代码库和现在以“ William210”的名义找到我的所有出版物。
===>一些示例 这里有一些简单的示例,可以使用多个时间范围的移动平均
比特币上的示例 添加2个移动平均值20,每天在时间范围内,在H6上添加1个,然后在H1中查看 ****请参阅3到5的屏幕截图
S&P500的示例 在每日添加3个移动平均时间为20个时期 ****请参阅6到7的屏幕截图
黄金的例子 每天在每天添加2个移动平均值50和20个时期,然后查看H1 ****请参阅8到9的屏幕截图
你的 分享您的使用设置,并找出其他交易者如何使用此指标来优化其策略!
==

Introducing our exciting new Price Retest indicator! Get instant alerts when the price retests, giving you a powerful edge in your trading strategy. Remember to do your own analysis before making any moves in the market. MT4 Version - https://www.mql5.com/en/market/product/118031 Here’s a detailed explanation of how the Price Retest indicator works, its components, and how you can incorporate it into your trading strategy: The Price Retest indicator is designed to notify traders when the price
FREE

使用RAR(Relative Adaptive RSI)指标优化您的交易策略! 这一先进的技术分析指标结合了相对强弱指数(RSI)的强大功能和自适应技术,比常见的振荡器提供了更精确和可靠的信号。 什么是RAR指标? RAR是一种为MetaTrader 5设计的指标,使用指数移动平均线(EMA)和自适应移动平均线(AMA)来平滑RSI并动态调整其市场条件。这种创新的组合可以更高的精确度和速度检测市场趋势和强度的变化。 RAR指标的优势 动态适应性 :RAR自动调整以适应不断变化的市场条件,与传统RSI相比,提高了信号的准确性。 市场噪音的减少 :使用EMA和AMA来平滑RSI,减少市场噪音,提供更清晰和可靠的信号。 直观的可视化 :包括一个彩色柱状图,有助于识别市场趋势和强度的变化,帮助做出更明智的交易决策。 有效的趋势检测 :基于平滑RSI的趋势检测功能,能够更有效地识别趋势方向。 高可配置性 :允许调整关键参数,如RSI周期,EMA和AMA,以适应不同的交易策略和风格。 使用方法和信号确认 入场确认 : 支撑和阻力区域 :在价格位于关键支撑和阻力区域时使用RAR确认入场。如果RAR在
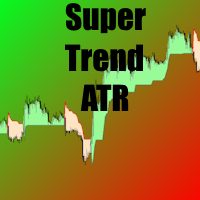
=== > 这个指标有什么作用? 它根据 ATR 绘制一条代表超级趋势的线
选择 ATR倍数 ATR期 就这样 !!! **** 请参阅屏幕截图 01 至 2
请随时向我索要 iCustom 代码,以便轻松将此 SuperTrend 集成到您自己的代码中
=== > 比特币示例 **** 参见截图 03
===> 为了谁? 无论您是全权委托交易者、算法交易者还是开发人员,该指标的设计都能满足您的需求。我了解涉及金钱时可靠性和效率的重要性,并且我非常认真地对待这一责任。
该指标在您的 PC 或 VPS 上消耗很少的资源。
对于算法交易者和开发人员,我提供对这两个缓冲区的完全访问权限: SuperTrend 值的缓冲区 1 缓冲区 2 用于超级趋势的方向
=== > 为什么? ATR上的SuperTrend有很多优势,一定能为您的交易提供帮助
- 清晰识别趋势 - 准确的输入/输出信号 - 优化风险管理 - 适配多种仪器 - 通过其他指标确认趋势 - 简单性和灵活性 - 外汇、股票、商品交易工具 -让您能够更长久地跟踪趋势 - 过滤由于波动性造成的波动 -

PyNinjaTrader - 用于 NinjaTrader 8 的拖放式 Python API 连接器
PyNinjaTrader 使用简单的拖放策略将您的 Python 脚本与 NinjaTrader 8 无缝连接。这个经过全面测试、快速且高效的解决方案利用 websockets 进行通信,策略充当服务器,Python 脚本充当客户端。
功能: - Python 登录 NinjaTrader 8 终端 - 保持活动功能以实现持续连接 - 将 NinjaTrader 8 帐户信息检索到 Python 客户端 - 直接从 Python 打开、修改和关闭订单 - 访问静态和动态帐户信息 - 获取全面的市场数据和执行信息 - 仅用一行代码即可下载条形数据并创建实时供稿 - apextrading 帐户的特别折扣 - 最高可享受 90% 的折扣!
安装:
- 完整文档和示例脚本可在我们的 GitHub 上找到 - 通过 Docker + Wine 与 Linux 兼容 - 演示版本支持有限的工具(EURUSD、AUDCHF、NZDCHF、GBPNZD、USDCAD)
加

欢迎使用 KMeans Price Zones Detector,这是一款创新的 MetaTrader 指标,利用机器学习的强大功能来识别关键的价格区间。该工具使用 KMeans 聚类算法动态检测价格数据中的中心点,突出显示价格更可能遇到支撑、阻力或整合的区域。 创新的 KMeans 算法 KMeans Price Zones Detector 之所以出众,是因为它先进地使用了 KMeans 聚类算法,这是一种在模式识别中以其效率和准确性而著称的机器学习技术。通过分析历史价格数据,指标识别代表显著价格水平的集群或中心点。然后利用这些中心点计算支撑和阻力区,为交易者提供关于潜在价格反转、突破和整合的重要信息。 主要特点 动态区域检测: 指标根据最新的市场数据不断更新价格区域,确保交易者始终掌握最相关的信息。 适用于所有时间框架: 无论您是在 1 分钟图表上进行短线交易还是在日线图表上进行长期投资,KMeans Price Zones Detector 都能无缝适应,提供准确的区域检测。 兼容所有外汇对: 该指标设计用于任何外汇对,为交易多种货币的交易者提供了灵活性和多功能性。 全面的 A
Engulfing Candle Signal Alert: Elevate Your Trading Strategy Unlock the full potential of your trading with the Engulfing Candle Indicator, the ultimate tool for identifying market reversals and enhancing your trading precision. Designed specifically for traders who value accuracy and timely alerts, this powerful indicator detects engulfing candle patterns, a key signal in technical analysis that often indicates a potential shift in market direction. What is an Engulfing Candle?
An engulfing ca
FREE
The "Cycle Extraction" indicator for MetaTrader 5 uses the Fast Fourier Transform (FFT) to discern cycles in financial time series. It facilitates the configuration of parameters such as the maximum number of bars, moving average settings, and specification of frequency thresholds, optimizing the analysis of repetitive market phenomena. Instructions Input Settings : Adjust variables such as Bar Count, Period, Method, and Applied to Price to customize the analysis to the user's needs. Data Visual
FREE

This indicator can be used to help learn the Al Brooks 'bar counting system'. It finds and labels 'H', 'L', Micro Gap '=', Outside 'E' and Inside bars '+'. You can choose label "H" and "L" at signal bar ou at entry bar. (does not count bars/legs...you'll have to do your own counting for L1 L2...H1 H2 etc.) The inside bar is only found when label at entry bar is selected.
FREE

Introducing the Raymond Cloudy Day indicator, a groundbreaking tool conceived by Raymond and brought to life on the MT5 platform by my coding expertise. This state-of-the-art indicator revolutionizes trading strategies by combining the robustness of an innovative calculation method that goes beyond traditional Pivot Points, with the precision of advanced algorithms. Key Features: Innovative Calculation Method : At the heart of the Raymond Cloudy Day indicator is a novel calculation meth
FREE

Our Spike Detector is specifically engineered to cater to the unique needs of traders in the Boom and Crash indices markets. This tool is optimized for M1 (1-minute) and M5 (5-minute) timeframes, ensuring you receive timely and actionable insights.
Key Features:
1. **Non-Repainting**: Our detector guarantees accuracy with non-repainting signals, ensuring your data remains consistent and reliable. 2. **Push Notifications**: Stay updated with real-time push notifications, so you never miss a

Sync Cursor MT5 | MT4 Sync Cursor MT4 https://www.mql5.com/en/market/product/118067 MT5 Tool will It make the Horizontal Line + Vertical Line in the Screen That it is always present on the screen and that it moves along with the candle (with the price). I am sure that something so simple will be a Treasure in the hands of many people.
Some of my personal trades are posted voluntary and free of charge in this Public channel https://t.me/FXScalpingPro
Contact: https://t.me/TuanNguyenTrader
FREE
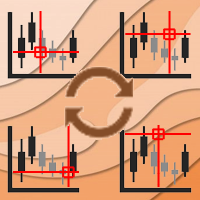
Async Charts is an indicator to synchronize charts and display a customized crosshair (cursor) on all selected charts. This is a useful utility for traders using multiple timeframes of analyzing multiple symbols for trade entry or exit.
Main Features : Real time Crosshair Synchronization on All Selected Charts
Supports Multiple Timeframes and Multiple Symbols at the same time
Auto Scroll Option
Graphical Adjustment of Color, Font, Size, ...
Locking All or Locking Specific Charts
More and
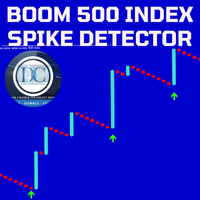
Our Spike Detector is specifically engineered to cater to the unique needs of traders in the Boom and Crash indices markets. This tool is optimized for M1 (1-minute) and M5 (5-minute) timeframes, ensuring you receive timely and actionable insights.
Key Features:
1. Non-Repainting**: Our detector guarantees accuracy with non-repainting signals, ensuring your data remains consistent and reliable. 2. Push Notifications**: Stay updated with real-time push notifications, so you never miss a cr
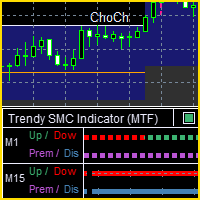
The Trendy SMC ( MTF ) indicator monitors trends and SMC concepts from multiple timeframes, allowing you to see what's happening from different perspectives, but on the one chart.
It is designed to help with a range of trading strategies related to trends and SMC concepts (such as Premium / Discount prices, Fib retracement levels and Fair Value Gaps). Features include:
Determining the trend based on market structure (breaks of highs and lows) Displaying the current trading range (between the

Индикатор тиковых объемов представляет собой инструмент технического анализа, используемый для оценки активности трейдеров на рынке. Этот индикатор отображает количество тиков (изменений цен) за определенный временной период и показывает преобладание тиков, направленных на покупку или продажу.
Основные характеристики и функции индикатора тиковых объемов: Гистограмма объемов:
Белый цвет: Означает преобладание тиков, направленных на покупку. Когда количество покупок превышает количество прода

This is the test product. Please, DO NOT BUY IT! This is the test product. Please, DO NOT BUY IT! This is the test product. Please, DO NOT BUY IT! This is the test product. Please, DO NOT BUY IT! This is the test product. Please, DO NOT BUY IT! This is the test product. Please, DO NOT BUY IT! This is the test product. Please, DO NOT BUY IT! This is the test product. Please, DO NOT BUY IT!

我们的 Basic Support and Resistance 指示器是提高技术分析所需的解决方案。该指标允许您在图表/ MT4版本
功能
斐波那契水平的集成: 可以选择显示斐波那契水平以及支持和阻力水平,我们的指标使您对市场行为和可能的逆转区域有更深入的了解。
性能优化: 只能在每个栏的打开时更新扩展线,我们的指标可确保最佳性能,而无需牺牲支持和阻力级别的准确性。
输入 主设置 Timeframe: 通过此输入,您可以选择在图表上显示较高时间范围的支撑线和阻力线。 Support/Resistance Strength [Number of Bars]: 使用此输入,您可以确定支撑和电阻的强度。数量越高,支持/阻力越强。 Price mode: 此参数允许您选择哪种价格将用于计算支持和电阻水平。它可以是收盘价,最高价格,最低价格等。取决于您的策略和偏好,您可以选择最适合您需求的价格。 显示设置 Display Fibonacci levels: 此参数确定是否将显示斐波那契水平以及图表上的支持和电阻级别。斐波那契水平是技术分析中使用的关键水平
===>此指标有什么作用? 他只能在时间范围内选择一个平均SMA
您将此指标放在图形上,因为您需要平均。
选择平均水平的参数和特征,仅此而已!!! ****请参阅屏幕截图01至02
请不要犹豫,要求我提供ICUSTOM代码,以轻松将此平均值集成到您自己的代码,另一个指标或EA中
选择 目标时间范围 期间数 滞后 所需的OHLC 时尚颜色 您可以在代码库和现在以“ William210”的名义找到我的所有出版物。
===>一些示例 这里有一些简单的示例,可以使用多个时间范围的移动平均
比特币上的示例 添加2个移动平均值20,每天在时间范围内,在H6上添加1个,然后在H1中查看 ****请参阅3到5的屏幕截图
S&P500的示例 在每日添加3个移动平均时间为20个时期 ****请参阅6到7的屏幕截图
黄金的例子 每天在每天添加2个移动平均值50和20个时期,然后查看H1 ****请参阅8到9的屏幕截图
你的 分享您的使用设置,并找出其他交易者如何使用此指标来优化其策略!
===>为谁? 无论您是酌情交易者,算法交易者还是开发人员,该指标都旨在

MinMax Levels MinMax Levels – 是重要交易時段(日、週和月)的最高、最低和開盤價格水準的指標。
每個外匯市場參與者都在其交易系統中使用等級。 它們可以是進行交易的主要訊號,也可以是作為分析工具的附加訊號。 在該指標中,選擇日、週和月作為重要時段,因為它們是大型市場參與者的關鍵交易時段。 如您所知,價格從一個水平移動到另一個水平,了解相對於重要水平的價格位置有助於做出交易決策。 為了方便起見,新增了按鈕來啟用和停用這兩個等級本身,並折疊按鈕以釋放價格圖表工作視窗中的空間。
每個外匯市場參與者都在其交易系統中使用等級。 它們可以是進行交易的主要訊號,也可以是作為分析工具的附加訊號。 在該指標中,選擇日、週和月作為重要時段,因為它們是大型市場參與者的關鍵交易時段。 如您所知,價格從一個水平移動到另一個水平,了解相對於重要水平的價格位置有助於做出交易決策。 為了方便起見,新增了按鈕來啟用和停用這兩個等級本身,並折疊按鈕以釋放價格圖表工作視窗中的空間。
此指標的優點: 方便 能見度 資訊內容 最新等級 可自訂的級別 此指標很方便,因為您

### 介绍 MetaTrader 5 的终极枢轴点水平指标
Ultimate_Pivot_Levels 是一种多功能工具,旨在通过准确绘制枢轴点水平来增强您的交易体验。它允许您手动输入所需的值或使用众所周知的枢轴点计算方法来创建枢轴点水平。它在背景中绘制这些水平,并允许您自定义水平、区域的大小和颜色,同时在每个新柱状图中保持您的调整。无论您是新手交易者还是经验丰富的专业人士,此指标都能为您提供灵活性和精确度,使您能够做出明智的交易决策。
### 主要特点
1. **多种枢轴点计算方法**:Ultimate_Pivot_Levels 指标支持多种枢轴点计算方法,允许您选择最适合您的交易策略的方法:
- **手动值**:输入您的自定义枢轴点水平,或从所需的频道或网站复制粘贴。
- **标准方法**:基于前一周期的高、低和收盘价格的经典枢轴点计算方法。
- **Camarilla 方法**:以其独特公式而闻名的流行方法。
- **Woodie 方法**:一种变体,更多地考虑了收盘价。
- **DeMark 方法**:由 T
FREE
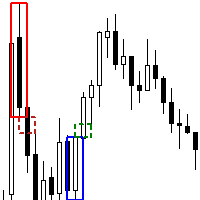
The Order Block FVG Box indicator for MetaTrader 5 is a powerful tool designed for discerning traders looking to identify and capitalize on high-probability trading opportunities. This indicator excels at pinpointing valid Order Blocks that are immediately followed by Fair Value Gaps (FVG), enhancing your trading strategy with precise visual cues. Key Features: Order Block Identification : Detects valid Order Blocks, which are significant areas where institutional buying or selling has occurred,
FREE
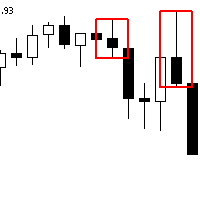
The Advanced Order Block Indicator for MetaTrader 5 is designed to enhance technical analysis by identifying significant order blocks that sweep liquidity and create Fair Value Gaps (FVG) when pushing away. This indicator is ideal for traders who focus on institutional trading concepts and wish to incorporate advanced order flow and price action strategies into their trading routine. Overview Order Block Identification : An order block represents a price area where a substantial number of orders
FREE

If you need an indicator that shows market entry points, then this is your indicator.
The indicator is not redrawn. Shows buy and sell points for any TF (time frame) and any currency pair. Settings are adjustable for all instruments. You can configure each parameter for any broker, for any account.
This is a PILLOW that is comfortable :)) Just check it out.....

The Multi Asset Monitor Panel is a game-changer for traders who need to keep an eye on multiple markets simultaneously. This innovative panel allows you to monitor any symbol and any timeframe you need, all within a single, organized interface. With up to three lists of symbols and customizable MT5 templates, you can tailor your monitoring setup to fit your specific trading strategy. What sets the Multi Asset Monitor Panel apart is its flexibility and customization options. You can control the s

Conquistador is a fundamental technical indicator designed to assess the current market situation and determine the optimal entry and exit points in the currency pairs market with minimal risk. This indicator was created on the basis of original indicators for searching for extremes and is excellent for determining a reversal or sharp movement of the market. Thanks to Conquistador, you can recognize such moments in a timely manner and receive notifications in the form of colored dots on the cha

O LIVRO VISUAL é uma ferramenta que auxilia na identificação de escoras e renovação de ordens, para quem opera Tape Reading ou fluxo no gráfico é uma excelente ferramenta. Porem ele funciona somente em Mercados Centralizados ou com profundidade nível 2. É de fundamental importância você saber que ele não funciona em Mercado de FOREX. Porem pode ser utilizado no Mercado da B3.

Product Description: Adaptive Y-Axis Scaling is a powerful MT5 indicator designed to enhance your trading experience by providing precise control over the Y-axis (price) scaling of your charts. This innovative tool allows you to customize the price scaling by specifying the number of pips from the visible chart's highs and lows. The calculated price range from this input is then used to set the maximum and minimum prices for the open chart, ensuring an optimized and comprehensive view of market
FREE

K线剩余时间的作用是 为了帮助交易者更好地理解市场动态,并做出更精准的交易决策 。在金融市场中,尤其是外汇和二元短线交易领域,了解K线图的剩余时间对于交易者来说至关重要。下面将详细探讨K线剩余时间指标的重要性及其在不同交易策略中的应用: 提高交易时机把握的准确性 精确计时 :通过显示当前K线周期的剩余时间,交易者可以更精确地把握入场和出场的时机 。 避免延误 :减少因估计时间而产生的误差,避免在关键时刻延误操作 。 优化策略执行 :使交易者能够在K线闭合前及时调整其交易策略,以应对市场变化。 增强交易体验 辅助工具 :作为辅助指标,K线剩余时间可以提高交易者的交易体验,减少心理负担 。 减轻心理压力 :通过直观显示剩余时间,减轻交易者在交易过程中的心理压力,特别是在快速变化的市场中。 提升交易效率 :使交易者能够更加专注于市场分析,而不是频繁检查时间。 适应不同交易周期 多周期适用性 :无论是一分钟、五分钟还是更长的时间周期,K线剩余时间指标都能提供准确的时间信息 。 灵活调整 :交易者可以根据不同的交易策略和市场条件,灵活调整对时间敏感度的需求。 支持复杂策略 :对于实施多时间框架分
FREE

成交量在交易中扮演着至关重要的角色,它是衡量市场活跃度和投资者情绪的关键指标。以下是成交量对交易的几个重要作用: 确认趋势 :道氏理论强调了成交量在确定市场趋势中的重要性。较大的成交量通常表明市场多空双方的分歧较大,而较小的成交量则可能意味着市场对当前价格的认同度较高。 捕捉主力动作 :通过一段时间的成交量分析,可以捕捉到主力资金的动向。一天的成交量可能会被操纵,但长期的成交量更能真实反映市场主力的行为。 预测价格变动 :成交量的变化往往先于价格变动。例如,价格上涨时伴随着成交量的增加,可能预示着后市将继续上涨;相反,如果价格上涨但成交量减少,则可能意味着上涨动力不足。 衡量市场活跃度 :成交量的大小可以直接反映市场的活跃程度。高成交量表明市场活跃,低成交量则可能意味着市场冷淡。 供需关系的体现 :成交量是市场供需关系的直接表现。供不应求时,成交量会放大;供过于求时,成交量会萎缩。 辅助技术分析 :在技术分析中,成交量与价格、时间和空间一起构成了分析的四大要素。成交量的分析可以帮助投资者更准确地判断市场趋势和转折点。 决策依据 :有经验的投资者会将成交量作为进出市场的依据之一。例如,带
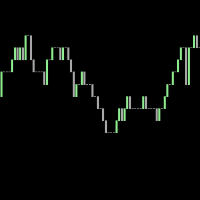
This is a tick indicator which compares the current bid price with the previous bid directly before it, and draws candles based on a comparison of the current ticks. It does not use historical ticks. Everything happens in real time, data moves from right to left, and the newest data arrives at the right. A trend line can be added which points in the direction of the price shifts.
FREE

This indicator displays the remaining time of the current candle, providing a visual representation of the time left until the candle closes and a new one begins, helping traders to make more informed decisions and stay on top of market fluctuations with precise timing, enhancing their overall trading experience and strategy execution, and allowing them to optimize their trades and maximize their profits.
FREE

This simple yet remarkably effective trend-continuation and breakout indicator acts as a powerful tool designed to aid traders in distinguishing genuine trend extensions from false breakouts. Through the utilization of a unique three-time-unit correctional phase guideline, it provides clear signals, offering trading opportunities with attractive risk-reward ratios.
Key Features Reliable Signals: The indicator confirms a genuine trend continuation or breakout if the price continues to trade h
>>> BIG SALE PROMOTION: 50% OFF + GIFT EA! - Promo price: $64 / Regular price $129 <<< - The promotion will end soon!
The Forex Trend Tracker is an advanced tool designed to enhance the trading capabilities of forex traders. This sophisticated indicator uses complex mathematical formulas alongside the Average True Range (ATR) to detect the beginnings of new upward and downward trends in the forex market. It offers visual cues and real-time alerts to give traders a competitive advantage in th
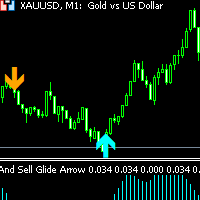
Buy and Sell Glide Arrow non-repaint and arrow appears on current candlestick orange arrow is a sell signal blue arrow is a buy signal Buy and Sell Glide Arrow works on 1 minute, 5 minutes and 15 minutes timeframes only as it is a scalping indicator. Pairs to trade: Forex pairs such as EURUSD,GBPUSD and other METALS: XAUUSD(GOLD) and other INDICES: Boom and crash 1000, Volatility Pairs such as VIX 10 - VIX 100 and other Lastly BTC AND LTC and other

This spread indicator displays the actual spread of each candle. It highlights the maximum spread and the minimum spread of the chosen symbol. This indicator is very helpful to see in real time the spread evolution helping to avoid taking a trade when the spread is too high.
Inputs:
Print value in Points: if true displays the spread as a whole number
D isplay minimum and maximum spread of the past N days: select the number of days to consider the maximum and minimum spread
Automatically

Description of the Indicator The indicator "BullsBearsPulse" is designed for MetaTrader 5 and provides a visual representation of the Bulls Power and Bears Power indicators. These indicators are useful tools for technical analysis, particularly for the EUR/USD currency pair, to help traders identify potential trading opportunities. Functionality Bulls Power : This indicator measures the strength of the bulls (buyers) in the market. It calculates the difference between the highest price and a 20
您知道为什么MetaTrader市场是出售交易策略和技术指标的最佳场所吗?不需要广告或软件保护,没有支付的麻烦。一切都在MetaTrader市场提供。
您错过了交易机会:
- 免费交易应用程序
- 8,000+信号可供复制
- 探索金融市场的经济新闻
注册
登录