适用于MetaTrader 4的EA交易和指标 - 72

Medium-term trading system that tries to profit during the price rollbacks after significant movements. The system automatically determines the current trading range, the price rollback levels. This is a demonstration version of the Algorithmic EA, which is optimized over the year 2016 for trading the EURUSD currency pair. It is possible to trade in manual mode using a simple on-screen panel or in fully automatic mode. Amount of trades per month is from 5 to 18 in automatic mode. The recommended
FREE
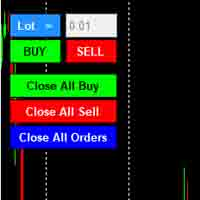
Note: This is EA only panel for manage Orders ------------------------- EA input inclde
- EA_Comment
------------------------
The panel include - Lot size input for BUY and SELL button
- Close ALL SELL orders (same symbol)
- Close ALL BUY orders (same symbol)
- Close ALL orders (same symbol)
-------------------------
You can use on any pair and any time frame
Thanks
FREE

二進制分析器是一個很好的機會,可以根據基於二進制代碼的現成計算來編寫自己的指標和交易策略。 該分析儀適用於所有5位小數位“ 0.00001”的貨幣對EUR / USD,GBP / USD ITD 推薦會議M1 包含在目錄中。 指標-“二進制參考” 和4項衡量看漲和看跌市場情緒的指標 // ------------------------------------------------ ------------------- // 指標“二進制參考” 該算法在燭台上計算公式,然後將結果合併為2個數組。 該公式計算一個會話中與價格的鏈接數。 該數組包含二進制代碼所引用的價格 數組以索引.bin保存到/ Files文件夾。 //-數組PIPS_COL_Price [99999,6]包含以下指示器--- // PIPS_COL_Price [x,0]-二進制代碼引用的價格 PIPS_COL_Price [x,1]-以該價格獲得的鏈接的最大值 PIPS_COL_Price [x,2]-電源類型布爾“ 0” /熊“ 1” PIPS_COL_Price [x,3]-子類型布爾“ 0/1” /熊“ 0
FREE

Price action Telegram is designed to follow the price while away from the trading terminal. There is no need to remember how the name of the currency is spelled correctly, those currencies on which expert is installed are available, because the trader does not jump aimlessly from currency to currency, he knows what he wants and what he is waiting for.
Through telegram, you can work with any timeframe and currency on which the expert is installed. You will always be aware of the market situati
FREE
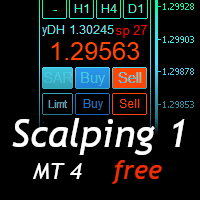
Scalping Day Trading Support Utility Scalping One MT4 free
One position is displayed with one button. View P & L, Lot, and Point in real time. It is possible to switch the display of positions of only chart currencies and all currency pairs. (The free version has only 3 positions) Supports automatic identification in Japanese and English Account currency notation corresponds to dollar, euro, pound, yen (automatic identification) The timeline drawing function can be linked with the clock dis
FREE

This tool adds alerts to your Fibo Retracement and Fibo Expansion objects on the chart. It also features a handy menu to change Fibo settings easily and quickly!
Features Alert for Fibo Retracement and Fibo Expansion levels. Sound, Mobile and Email alert. Up to 20 Fibo Levels. Continuous sound alert every few seconds till a user clicks on the chart to turn it OFF. Single sound alert with pop-up window. Keeping all user settings even after changing timeframes. New handy menu to change Fibo sett
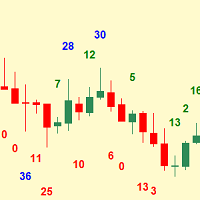
Simplest indicator for bar shadows. Very useful for Kangaroo Tail strategy.
"Shadows" - this is the distance from high and close of the bull bar and low and close of the bear bar. The purpose of the shadow is to show you if the bar is strong or not. Whether it is internal to the trend or is external. It even helps determine if a trend is starting. Input arguments: How many prevoius bars to calculate Value that should be passed to trigger the alarm How many times to repeat the alarm (Put 0 if y
FREE

This Expert Advisor does not take positions, This EA is made just for: "Trailing Stop Loss". Description The expert moves the SL by Moving Average value or by last candle's high or low(candle trailing). Indicator Parameters Trailing Method (trailing by moving average value or candle trailing). MA Period (period of moving average). MA Method (simple, exponential, smoothed, linear weighted). Apply to (when you select "Trailing With MA" method, calculation and moving average based on close, o
FREE
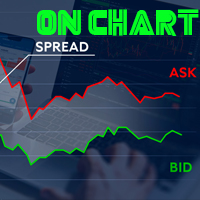
Indicador de Spread en Tiempo Real en la Gráfica Este indicador revolucionario te brinda una visión transparente y detallada del spread en tiempo real directamente en tu gráfica de trading. Diseñado para proporcionar información precisa y crucial, este indicador mejora tu capacidad para tomar decisiones informadas y optimizar tu rendimiento comercial. Características Destacadas: Visualización Instantánea: Observa el spread en tiempo real directamente sobre tu gráfica, eliminando la necesidad de
FREE

Support/Resistance Percent Rank
SR Percent Rank helps to see how many times the current close price has been in the past price range. SR Percent makes a loop over x bars into the past and calculates the percentage of times the current closing price has been between the high and the low price in the x bars before that. So we can determine if the current price is moving at supports or resistance that was formed in the past. I use the indicator when creating strategies with the StrategyQuant X p
FREE
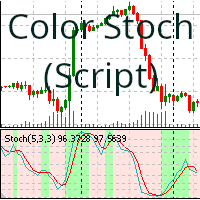
此脚本根据买入或卖出趋势为随机振荡器的背景着色。背景颜色由指标线的位置确定。
可修改的参数如下:
%K Period: %K 周期。 %D Period: %D 周期。 Slowing: 减速周期。 Price Field : Low/High, Close/Close。 MA Method: Simple, Exponential, Smoothed, Linear weighted。 Color Positive Trend: 上升趋势的背景颜色。 Color Negative Trend :下降趋势的背景颜色。 Color Neutral Trend : 中性趋势的背景颜色。 Save variables: 保存当前值以供以后重复使用。 Clean graph : 清除图表的颜色 (Clean colors)。
如何使用脚本:
要使用脚本,只需将指标拖放到图表上。根据您将指标拖放到图表上的哪个位置,您将获得结果。从为指标着色到为整个图表着色。 (请参阅屏幕截图)
脚本将自动应用到指标。
结论:
此脚本是使用随机振荡器的交易者的实用工
FREE

Stochastic Full View show all 29 major and minor pairs Stochastic indicator live value,traders can view all 29 pairs Stochastic indicator live value with all 9 timeframes just attached it on ANY ONE Chart, traders can see all the 9 timeframe overbought signal and oversell signal just on ONE Chart Stochastic Full View show the overbought value and oversell value with highlight background color and font color,you can attach this utility on any pair and any timeframe, traders can
FREE
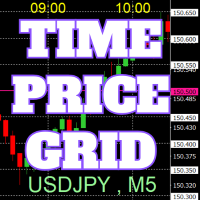
On the chart, draw grids for price and time at round numbers for easy reference.
"Parameter Input" allows for setting price intervals for each period. The grid lines for significant numbers (round numbers) are thicker and more prominent than other lines, making them easily distinguishable. The grid lines for significant numbers (round numbers) can be set to a different color than other lines. Colors at various points can be individually configured. Symbols and timeframes can be displayed, and
FREE

OVERVIEW
K-means is a clustering algorithm commonly used in machine learning to group data points into distinct clusters based on their similarities. While K-means is not typically used directly for identifying support and resistance levels in financial markets, it can serve as a tool in a broader analysis approach.
Support and resistance levels are price levels in financial markets where the price tends to react or reverse. Support is a level where the price tends to stop falling

The indicator represents 4 moving averages, shifted back. Created, like any moving average indicators, in order to see the approximate balance of volatility and the number of bulls and bears. The difference from other Moving Averages is that an attempt is made here to bring the moving averages of different periods to a common denominator, respectively, to bring the number of traders trading on different timeframes to a common denominator. The indicator is distributed as is.
MnojitelMA1, Mnoji
FREE
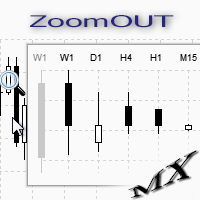
ZoomOUT allows you to have a quick look at a selected bar on a higher timeframe in a pop-up window. After the launch, the indicator works in the background mode occupying no place in the chart and consuming no resources. When activating the indicator by Shift + o (customizable), a pop-up window with a chart displaying bars of higher timeframes is created. To hide a pop-up window, left-click on any clear place on the chart. The indicator is simple and requires no settings.
FREE

This program serves as an effective tool for sending messages through a Telegram bot using the MetaTrader platform. It enables you to send your trading recommendations related to the orders you open on the trading platform directly to your Telegram channel or group. These messages may include details about open trades and can be accompanied by illustrative images of the orders. Alternatively, they can be configured to be without images based on your preferences. This means that if you are the o
FREE

The indicator is a 15-minute signal indicator for all types of traders. Meaning, you could make lots of profits trading two different signals in one indicator.
NOTE: Both indicators are channels for achieving the same result. RED ARROW -- Sell Signal BLUE ARROW -- Buy Signal
Purchase now to be part of our community. We offer standard chart setups for both novice and intermediate traders. Trade with ease!
FREE

Introduction This Indicator Is Based On Average Price/Maximum Price Moves, And Using Moving Bollinger Bands And Moving Averages.
The Advantage Of Using It With YOUR own Analysis Will Confirm Potential Supports And Resistances While it Compliments With Your Analysis
The Indicator Is Non-Repainting
AND Along With Our Special Trend METRE that Changes With The Conditions OF A Bullish Or Bearish Trend....
Recommend Time-Frames: H1 H4 M15
Usage: The Indicator Is Very Profitable I
FREE
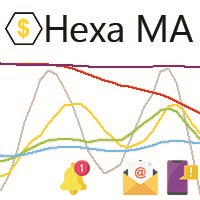
"The trend is your friend, until the end when it bends". The "Hexa MA" custom indicator is a trend following indicator. It uses 6 Moving Averages to spot the trend and follow, and also to filter the bad signals for the fast Moving Averages. The basic is simple, yet the strategy is powerful.
Recommended settings for the indicator : - Moving Average periods : SMA 5, SMA 10, SMA 20, SMA 50, SMA 100, SMA 200. - Timeframe : M15 is the default. But any timeframe can be used. - Currency pair : Since
FREE

The purpose of this new version of the MT4 standard indicator provided in your platform is to display in a sub-window multiple timeframes of the same indicator. See the example shown in the picture below. But the display isn’t like a simple MTF indicator. This is the real display of the indicator on its timeframe. Here's the options available in the FFx indicator: Select the timeframes to be displayed (M1 to Monthly) Define the width (number of bars) for each timeframe box Alert pop up/sound/ema
FREE
The purpose of this new version of the MT4 standard indicator provided in your platform is to display in a sub-window multiple timeframes of the same indicator. See the example shown in the picture below. But the display isn’t like a simple MTF indicator. This is the real display of the indicator on its timeframe. Here's the options available in the FFx indicator: Select the timeframes to be displayed (M1 to Monthly) Define the width (number of bars) for each timeframe box Alert pop up/sound/ema
FREE

Indicator description. The “ Alligator Analysis ” ( AA ) indicator allows you to build various (by averaging types and by scales) “ Alligators ” and their combinations, i.e. allows you to analyze the state of the market based on the correlation of this state with a whole range of different " Alligators ". The classic " Alligator " by Bill Williams is based on moving averages and Fibonacci numbers, which makes it one of the best indicators now. The classic " Alligator " is based on
FREE

Moving Average Convergence Divergence (MACD) Signal Input parameters: signal mode: set it to true if you want to plug it into STAT (Signal Tester and Trader) arrow shift: distance between fast EMA line to arrow on chart standard entry mode for MACD fast EMA period slow EMA period MACD period MACD price method Standard Entry mode: buy when slow EMA cross and close above fast EMA while above the 0 line sell when fast EMA cross and close above slow EMA while below 0 line You can find the best set
FREE

This is a simple risk/reward setter. You enter your TP and SL in the currency amount and it sets it for you, you set your targets in money (not in pips), it helps beginners who are still learning about risk/reward ratios to set their risk/reward based on their capital or amount of money. For example, if you want to risk $3 to make $10, you just fill it in and it sets your order targets accordingly. You can set the TP and SL per chart or all opened charts only. Please make sure your targets are r
FREE

The FxSProWPR oscillator generates signals for trend confirmation, which can also nbe used to confirm the emergence of new trends.
Indicator Parameters NumberBars - the number of bars to display the indicator. Too many bars may significantly slow down the operation of the trading terminal. SignalAlert - an Alert notifying of a trend. SignalSound - sound alert to notify of a trend. The sound will be played once the histogram exceeds the level of 15.
Rules to confirm position entry Green histo
FREE

The Sextet is an MT4 indicator that displays 6 levels of Moving Averages, where the second is the moving average of the first, the third of the second, and so on. It gives a signal when all the moving average levels align in order. Get a Free Sextet EA, and read discussions about using The Sextet Indicator on Forex Factory:
The Sextet EA @ Forex Factory Check out the The Sextet Scalper Pro for a more elaborate scalping strategy also with Free EA . Key Features: Is a Moving Average of a Movi
FREE
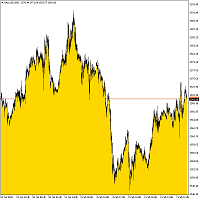
Bottom Background 4 该指标根据设置将某种颜色的下背景设置为当前价格。 指标设置说明: MODE - 指标的三个显示选项: Low - 显示最低价格, Open / Close - 显示开盘价或收盘价,以较低者为准, MA - 显示到移动平均线。 PeriodMA - 移动平均周期。 该指标根据设置将某种颜色的下背景设置为当前价格。 指标设置说明: MODE - 指标的三个显示选项: Low - 显示最低价格, Open / Close - 显示开盘价或收盘价,以较低者为准, MA - 显示到移动平均线。 PeriodMA - 移动平均周期。 该指标根据设置将某种颜色的下背景设置为当前价格。 指标设置说明: MODE - 指标的三个显示选项: Low - 显示最低价格, Open / Close - 显示开盘价或收盘价,以较低者为准, MA - 显示到移动平均线。 PeriodMA - 移动平均周期。
FREE
Volume Oscilator is a popular indicator available in trading view which is very popular among traders Definition The Volume Oscillator is an indicator made up of two Moving Averages (MA) surrounding volume, one being fast and the other slow. The slow volume MA value is then subtracted from the value of the fastlow Moving Average. The Volume Oscillator measures volume by analyzing the relationship between the two Moving Averages mentioned. When combined with other indicators it provides a very st
FREE

EZT Bollinger Trendline
Indicator based on multiple settings of Bollinger Band. In the menu you can choose the similar settings than bollinger band indicator. Trend period and trend deviations. Also paint and arrow on chart when direction change. Three different kind of alert , such as pop up, e-mail and push notification. Try different settings on different timeframes.
Please help my work and rate and comment my products!
FREE

The risk-to-reward ratio is used for assessing the potential profit (reward) against the potential loss (risk) of a trade. Stock traders and investors use the R/R ratio to fix the price at which they'll exit the trade, irrespective of whether it generates profit or loss. A stop-loss order is generally used to exit the position in case it starts moving in an opposite direction to what a trader anticipated.
The relationship between the risk and reward helps determine whether the potent
FREE

The Mono Waves indicator is designed to display the wave behavior of the market on a chart. Its appearance is presented on slide 1. This indicator uses the PPPC (Point-Percent Price Channel) indicator, which can be downloaded for free from the Market . When the market moves up, the upper border of the price channel is built on High candlestick prices (for more details, see the description of the PPPC indicator at the link given above). The higher the High prices rise, t
FREE

The indicator searches for matches in history for a specified range of the latest known oscillated Moving Average data.
Found matches are indicated on the graph as colored fields. Analysis of historical data (the behavior of quotes in history) will help make decisions in trading.
The matches found are updated when a new bar is opened (i.e., the calculation is performed upon opening prices).
The value of the increase accuracy (Accuracy) must be changed with a decrease in the timeframe, and
FREE

MULTI TRADER TOOL - SUPPORT / RESISTANCE, ONE CLICK CLOSE / OPEN, AUTO CLOSE, GRID ORDERS, ALERTS.
You should use this Panel on FULL SCREEN MODE (F11).
HotKeys: B - Open Market Buy Order with OneClickOpen Settings. S - Open Market Sell Order with OneClickOpen Settings. G - Open Grid Orders with Grid Panel Settings. R - Add Support/Resistance Settings to selected trend and horizontal lines. If you have any questions, ask in a private message or in the comments section.
FREE
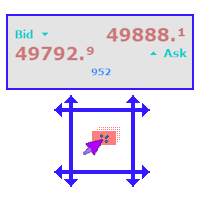
A simple and functional Current Price Panel, which shows magnified Bid, Ask and spread price and can be moved by using the mouse, to any location of the chart window. The functionality included are: Customize Current Price Panel Width and Height, Row and Column gap. Background color, background transparency and border color. Font, its size and color. Move the panel to any location of chart window. Option to show current spread as pips or points. Highlight spread in different color if it crosses
FREE
This multi-timeframe indicator identifies the market's tendency to trade within a narrow price band. [ Installation Guide | Update Guide | Troubleshooting | FAQ | All Products ]
It is easy to understand Finds overbought and oversold situations Draws at bar closing and does not backpaint The calculation timeframe is customizable The red line is the overbought price The green line is the oversold price It has straightforward trading implications. Look for buying opportunities when the market is
FREE

SpreadLive shows the full Spread history of a chart with different colors. It alerts you (MT4, E-Mail and Mobile) when the spread reaches the limit, which you can define in the settings. The menu contains Current Spread , Average Spread and Highest Spread of current chart. The main idea is to use it with an EA and analyze negative profits from the spread history. This helps you to see how your broker varies the spread.
Inputs Spread limit - limit to alert. Type - Show in points or pips. Alert:
FREE

Abyss EA is a long-term Expert Advisor using the breakthrough of price levels in its algorithm. The EA sets the buy stop and sell stop orders at certain levels. All trades are accompanied by stop losses exceeding the expected profit several times. Profitable trades are accompanied by a trailing stop triggered when the order reaches a certain profit. All trades are closed on the selected day of week, so there is no sitting out the losses. You are also able to use the auto lot. The EA does not use
FREE

The Retracement indicator shows the current and historical high, low and mid values. Optionally, it can also display major retracement levels. All these levels together form the significant levels of support and resistance. Therefore, it is essential to know them for every kind of trader.
Levels High Low Midpoint 76,4 % 61,8 % 38,2 % 23,6 %
Main features The indicator shows the actual levels of High, Low, Mid and selected retracements. Four optional retracement levels. Alert notificatio
FREE

The EVO Exclusive EA Lite EA is based on support/resistance level breakthroughs. It works autonomously on a VPS server. The EA passed testing on real ticks. Pro or ECN accounts with Market Execution are required for correct operation. The Expert Advisor controls the spread and slippage, thereby protecting your capital from risks. No martingale, no grid, no hedging. The EA applies stop loss, take profit and trailing stop. This is a free version. Not all functions operable! The free version has a
FREE
The script sets Fibonacci levels on the chart using maximums and minimums visible on the chart. The script names Fibo with such timeframe on which it has been launched (Fibo D1 or Fibo M30, etc.), therefore preserving previously constructed levels on different time charts. This instrument will be useful for those who start studying Fibonacci levels and those who need to form these levels in a speedy fashion. The script does not have additional settings. Fibonacci lines can be amended in standard
FREE
The recommended broker for using this utility is RoboForex or a similar one, with fast order execution and low spreads. The purpose of this utility is to open new market orders, manage them, and turn losing trades into profits using an internal algorithm for handling losses, trend filtering, and various types of trailing stops and take profits. It is suitable for trading any instruments and on any timeframes. The algorithm works separately for buy and sell operations, allowing trading in both d
FREE

基于股票软件黄金线指标改编。可根据需要调整参数值。具体使用规则请参考相关股票软件说明。 ////////////////////////////////////////////////////////////////////////////////////////// //股票公式源码如下:
VAR1:=(HIGH+LOW+OPEN+CLOSE)/4;
黄金线:EMA(3*VAR1-2*SMA(VAR1,2,1),13); //////////////////////////////////////////////////////////////////////////////////////////
声明 1 指标计算均基于价格变化而来, 不保证使用此指标的盈利性,作者不对使用此指标的任何损益负责。 2 本指标免费使用。
FREE
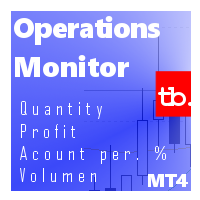
Operations Monitor It is a simple but powerful monitor, which allows not to use the Terminal to have a cleaner chart.
Informs about all the operations opened in that Asset: Number of Open Operations Lost / profit Account Percentage Volume operated Colors: RED: the sum of operations is lost BLUE: the sum of operations is in profits Fonts: Allows change the font size.
FREE

MP Gradient Adaptive RSI oscillator uses AMA with the basic RSI to cover the retracements with minimum lag. Trigger line crossing the oscillator will provide an entry point for trader.
Settings: RSI period: period of the oscillator Sensitivity of the oscillator: controls the sensitivity of the oscillator to retracements, with higher values minimizing the sensitivity to retracements. RSI applied price: source input of the indicator Number of bars to draw: is used when the Fill Type option is n
FREE
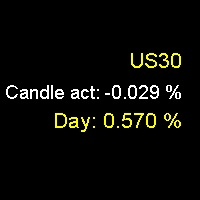
Daily Percentage and Current Candle Would you like to know how much an asset has risen or fallen in a day or in the last candle? Do you want a numerical reference for the strength and direction of price movement? Then, the Daily Percentage and Current Candle indicator is the tool you need. The Daily Percentage and Current Candle indicator shows you the percentage increase or decrease of an asset in the current day or in the last candle, depending on the timeframe you choose. The indicator allows
FREE

Do you need precision? Tick charts show each change in the ask or bid; The chart updates whenever either price changes. Study the markets more deeply, with surgical precision. Tick Chart Window saves all the received ticks and shows them into a seperate window. Get the best entry price in the Market. trade with precision trade good Spread Register In the comment section you will see the highest spread, the lowest spread and the average spread since the indicator was loaded.
FREE

This utility sends you Telegram messages about: open a new position (can be disabled) change the current position (Stop Loss / Take Profit) (can be disabled) close current position (can be disabled)
Symbol: all Symbols current Symbol
Directions of deals: buy and sell only buy (long) only sell (short)
Magic number: all magic numbers only for a specific magic
Type deals/orders: market deals (buy / sell) limit orders (buy limit / sell limit) stop orders (buy stop / sell stop) stop limit or

Rua Trend Pro This is an indicator that helps identify Trends relatively accurately. Can be used for any currency pair. And usable on all time frames. Recommended use from M15 and above. You can use it to identify trends, or to identify reversals very well. Input parameters: in_TradePeriod in_StopPeriod in_Alerts A product of Ruacoder Provide code indicator and EA services upon request
FREE
SafeMartin_VS_lite - an automated trading system optimized for EURUSD H4, but it can work on other currency pairs and timeframes. The Expert Advisor has a minimum of settings, which allows you to immediately put it into operation, without a lengthy procedure for selecting the optimal parameters. Several Expert Advisors are allowed to work in one terminal. Works with both 4 and 5-digit quotes. Not intraday! Not scalping! Designed for long-term trading. In the new version, the number of user s
FREE

The EA monitors positions for selected pairs, sets a break-even level and moves a trailing stop. When the trade is "n" points of profit (parameter dist_BEP), the stop loss is moved to the break-even point (the level of the trade opening price) plus the specified distance in points (parameter BEP) The EA checks all available (or filtered) trades for break-even and moves stop-loss levels if necessary. The EA also checks all available (or filtered) trades for trailing stop conditions and, if neces
FREE

Indicator overview Trend indicator usage Moving averages. Highest quality alerts that need no introduction. It is completely loyal to the original algorithm and uses other useful features.
Easy to trade Carry out all kinds of notifications It's not a new paint and it's not a back paint. Setting Indicator SMA50 in Time frame H1 for any pair currency and Gold Spot. EMA200 in Time frame H1 for any pair currency and more than EMA250 for Gold spot. Using it for maximum benefit Set up notificatio
FREE
Индикатор Trender определяет смену тренда. Для того чтобы её не пропустить, настройте его на отправку уведомлений в ваш мобильный терминал (Push), или в виде алерта ( Alert ), или по Email. Также индикатор предоставляет потенциальные точки входа и расчитывает и отображает уровни стоплосс и тейкпрофит.
Преимущества: - Не перерисовывается - Может помочь в фильтрации сигналов в вашей стратегии - Работает на всех парах и таймфреймах - Прост в настройке - Даёт уже готовые сигналы для открытия поз
FREE

Action Scanner is a market scanner. It’s yet another product in my "Can’t trade with out it" series. Do you want to know what is moving right now? Action Scanner scans your watchlist and opens the 10 currently most moving charts. You can chose between, most moving in points, most moving in your account currency(if you were to trade it with a standard lot size 1.00) and most moving in percentage. The standard version is a complete tool with no limitations. However the pro version has additiona
FREE

This indicator displays the moment when the RSI oscillator crosses the zero value, and the moment when the RSI oscillator crosses its smoothed value. Crossing the zero value by the RSI oscillator is a buy/sell signal. If the RSI oscillator crosses its smoothed value, it is a signal of a trend change. The signal is given after the end of the formation of the candle. The signal is confirmed when the price crosses the high/low of the bar on which the signal was given. The indicator does not redraw.
FREE

This indicator displays the signals based on the values of the classic RSI indicator on the price chart. The RSI can be used for determining the overbought or oversold areas on the chart. Reaching these levels means that the market can soon turn around, but it does not give signal, as in a strong trend the market can stay in the overbought or oversold state for quite a long time. As with most oscillators, the signals are generated when leaving these areas. This indicator allows to display three
FREE

CUSTOM Currency strength indicator
-CHOOSE ANY CURENCIES that you want to calculate strength for, indicator will automatically compare all symbols /pairs from 8 selected currencies based on KU-chart calculations.
-8 major currencies are used by default
-add indicator to any chart
-made for 15min timeframe= last 1 day change calculated, 30min = last 2 days and so on
-clear currency distinguish by color and name on chart
-if you chose non-standard currency, make sure all of inputted val
FREE

Recommended broker to use the expert: CENT ACCOUNT https://tinyurl.com/5ftaha7c
Dsc Kamikaze Mt4
Expert Advisor developed by Diogo Sawitzki Cansi to operate opening trades through the RSI and making a different martingale than normal to leverage the account more quickly. Use only with capital that you want to risk trying to achieve a high profit quickly, however, that you can lose. Any martingale strategy is always at high risk. Parameters EA:
Set up different gain and position paramet
FREE

Scientific Calculator is a script designed to compute expressions of science, engineering and mathematics.
General Description
The expression to calculate must obey syntax rules and precedence order, being constituted by the following elements: Integer and real numbers. Mathematical operators for addition (+), subtraction (-), multiplication (*), division (/) and exponentiation (^). Mathematical and trigonometric functions . Curved parentheses (()) to define the precedence and c
FREE

使用按键和通知进行绘图 该产品将对那些专业交易者感兴趣。更准确地说,他们在交易算法中使用干净的图表(没有指标或指标数量最少的图表)。 使用热键,可以在活动图表上创建具有不同绘图样式和不同颜色的图形对象。您可以更改图形的格式样式。 您可以选择默认的图形样式,或在顾问程序属性选择窗口中进行设置。转到图形,在创建图形对象时,会自动选择颜色,线条类型和线条粗细。图形对象的绘图样式将取决于执行绘图的当前时间范围。 请观看视频,我将尝试展示其基本功能。
键盘快捷键 键0-从所有对象上移开焦点 键1-创建一个“水平线”对象 键2-创建一个“矩形”对象 键3-创建一个“趋势线”对象 键\-从图表中删除各种对象 键]-删除“”类型的对象 键[-删除“矩形”类型的对象 键\-从图表中删除所有图形对象(仅绘制) 按键q-o-更改当前时间范围
创建水平线和趋势线 视频说明中提供了一个示例。 创建一个矩形 其他设置: -为将来自动扩展矩形; -当价格越过矩形的内部边界时,更改矩形的颜色; -选择的能力-是否用颜色填充矩形。 通知设置 通知类型: -Telegram-将通知发送到您先前在Telegram
FREE
This is a medium-term conservative system. It tracks quote movements and defines entry points. The Expert Advisor is completely automated and features the unique algorithm. This demo version trades USDJPY.
Features It does not use Martingale; No grid; No scalping; No excessive parameters; Fixed lot; No complicated settings. Trades are usually opened infrequently. Orders may remain open for a few days for obtaining greater profit. Amount of trades per month is from 5 to 20. Deals are closed by
FREE
Highly configurable Relative Vigor Index (RVI) indicator.
Features: Highly customizable alert functions (at levels, crosses, direction changes via email, push, sound, popup) Multi timeframe ability Color customization (at levels, crosses, direction changes) Linear interpolation and histogram mode options Works on strategy tester in multi timeframe mode (at weekend without ticks also) Adjustable Levels Parameters:
RVI Timeframe: You can set the lower/higher timeframes for RVI. RVI Bar Shift:
FREE

一个简明的趋势与震荡的标示指标。 版本升级:增加预警及通知,增加买卖方向建议,优化界面显示。 更多编程服务可加微信 luolin9687
使用红黄绿三色来标示。 红色表示空头趋势(下跌)。 绿色表示多头趋势(上涨)。 黄色表示震荡区域。 从黄色转变为红色时,行情可能从震荡转变为下跌趋势。一段连续的红色,说明下跌趋势很强。 从黄色转变为绿色时,行情可能从震荡转变为上升趋势。一段连续的绿色,说明上升趋势很强。 指标的上半部分区域和下半部分区域若同步为红色,表明下跌趋势已经形成共振,接下来大概率走出一段空头趋势。 若上下 同时为绿色,表明上涨趋势已经形成共振,接下来大概率走出一段多头趋势。 若上下同时为黄色,表明当前行情为震荡。
参数可调。 //+-------------------------------------------------------------------------------------------+ 特别提示 市场行情是不确定的,任何指标都是根据行情价格的演变而来,不保证使用此指标的盈利性。
FREE

Trend Rising 是自定義 MT4 (Metatrader 4) 指標,最適合剝頭皮 TF M30 及以下,使用基於多個時間框架的 Bill William 指標分析趨勢和動量模式。結果,它確定了適用於大多數貨幣對的趨勢的開始和結束。 Trend Rising 指標是基於 Accelerator Oscillator 和 Awesome Indicator 開發的。
主要特徵 用顏色顯示趨勢的開始和結束。 使用 base-TF H1 輕鬆識別趨勢強度(強牛市和熊市)。 識別市場調整。 (當前圖表的弱勢和可能的逆轉) 當建議的條目發佈時,在圖表上繪製 SL 級別。 獲取圖表中發生的每一次趨勢變化的警報。
趨勢上升的優勢 使用所有貨幣對(外匯、加密貨幣、指數和商品) 使用所有時間範圍。 (推薦時段:M30及以下TF) 警報生成器。 (彈出警報、推送通知警報等) 未重新粉刷 100% 免費指標
接觸 如果您有任何疑問或需要幫助,請通過私信與我聯繫。
作者 Safwan Daud,馬來西亞貿易分析師。青年商品交易員(YCT)
FREE

This is a simple script that places a defined number of lines above and below a given price. The script lets you set the number of lines, the separation in pips and the color. Instructions:
Drop the script on a chart to draw the level lines If the last parameter is set to false, the script will delete the lines previously placed by it.
Parameters:
English? Turn it yes to use English language, false will turn language to Spanish Separation Set the pips distance among lines From Price
FREE
This indicator displays in the form of an oscillator the difference between the maximum/minimum prices for the current period of time and the maximum/minimum price for a longer period. An increase in indicator values above zero indicates that the maximum price for the current period is greater than the maximum price for the period selected as an indicator parameter. This situation in most cases indicates an increase in the value of the asset. A drop in indicator values below zero indicates t
FREE

Spin is an intrinsic form of angular momentum carried by elementary particles, composite particles (hadrons), and atomic nuclei.
Spin is one of two types of angular momentum in quantum mechanics, the other being orbital angular momentum. The orbital angular momentum operator is the quantum-mechanical counterpart to the classical angular momentum of orbital revolution and appears when there is periodic structure to its wavefunction as the angle varies.For photons, spin is the quantum-mechanica
FREE

This indicators when combine with its slave version can help you a better view in backtesting visual mode. https://www.mql5.com/en/market/product/61574 They will help you in developing a multi time frame trading strategy. 1) Run backtest in visual mode 2) Add the master indicator to the backtesting chart 3) Add the slave indicators to other charts of the same symbol with different time frames. Run the backtest and you will see all the charts auto scrolling.
FREE
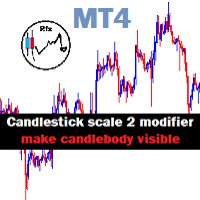
Candlestick Mod rapat.
Chart Candlesticks will stick together. make it look neat and tidy Switch between Candlestick and Line chart fixed. Instruction.
If you don't like the candles colors, you can do so by changing color. read below:
-Colors must be changed in the indicator setting.
-It won't change through the Chart properties to modify.
-After changing the color, save it as template so it wont change the colors to default value.
FREE
This indicator identifies the current trend, thus allowing the trader to capture a maximum of strong price movements with pending order. The indicator settings are very simple and its application is intuitive. The line serves as a strong support/resistance level depending on its location relative to the price. Individual dots of the indicator mark short-term resistance/support levels. Place pending orders to enter the market above or below (taking the spread into account) those values. The indi
FREE
MetaTrader市场提供了一个方便,安全的购买MetaTrader平台应用程序的场所。直接从您的程序端免费下载EA交易和指标的试用版在测试策略中进行测试。
在不同模式下测试应用程序来监视性能和为您想要使用MQL5.community支付系统的产品进行付款。
您错过了交易机会:
- 免费交易应用程序
- 8,000+信号可供复制
- 探索金融市场的经济新闻
注册
登录