适用于MetaTrader 4的技术指标 - 120
This indicator will help you a lot to caculate all of your orders ( Both real current orders and pending orders) for all of your charts ( Calculation separately in each charts). And it will show you the direction of each chart (Settlement lot) that it's BUY, SELL or HEDGING with how many lot. For example, your EURUSD is 0.6 lots BUY (totally), but GBPUSD is 1.5 lots SELL (totally) and BTCUSD is HEDGING with total BUYs 0.5 lot and total SELLs 0.5 lot. (including summar
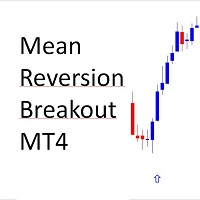
!! FLASH SALE !! Over 80% off !! For ONE week only. Now only $47 - normally $297! >>> Ends on 30 June 2023 - Don't miss it!
Buy and Sell Arrows when price breaks away from mean price. Sends Alerts – On MT4 To Your Phone To Your Email
Does not repaint .
Works on any Forex pair, any timeframe.
10 Activations allowed so you are free from limitations >> MT5 Version Here
For spreads from a tiny 0.1 pips RAW/ECN Accounts, click here . Check out my Waka Esque EA signal here: >

The Magic SMA indicator is of great help in determining trend direction. It can be an excellent addition to your existing strategy or the basis of a new one. We humans can make better decisions when we see better visually. So we designed it to show a different color for rising and falling trends. Everyone can customize this in the way that suits them best. By setting the Trend Period, we can optimize it for longer or shorter trends for our strategy. It is great for all time frames.
IF YOU NEE

The Magic EMA indicator is of great help in determining trend direction. It can be an excellent addition to your existing strategy or the basis of a new one. We humans can make better decisions when we see better visually. So we designed it to show a different color for rising and falling trends. Everyone can customize this in the way that suits them best. By setting the Trend Period, we can optimize it for longer or shorter trends for our strategy. It is great for all time frames.
IF YOU NEE

The Magic LWMA indicator is of great help in determining trend direction. It can be an excellent addition to your existing strategy or the basis of a new one. We humans can make better decisions when we see better visually. So we designed it to show a different color for rising and falling trends. Everyone can customize this in the way that suits them best. By setting the Trend Period, we can optimize it for longer or shorter trends for our strategy. It is great for all time frames.
IF YOU NE

The Magic SMMA indicator is of great help in determining trend direction. It can be an excellent addition to your existing strategy or the basis of a new one. We humans can make better decisions when we see better visually. So we designed it to show a different color for rising and falling trends. Everyone can customize this in the way that suits them best. By setting the Trend Period, we can optimize it for longer or shorter trends for our strategy. It is great for all time frames.
IF YOU NE

Dear Traders this is my another tool called " Swing Master Indicator ". As the name above the indicator is designed to help you in swing trading by capturing the low and highs of the price. You may us this tool with any trading strategy and style from scalping to position trading. It is made for level of traders including newbies and advanced traders even prop-firms, hedge funds and banks to help them make sold market analysis. I create tools for serious traders who want to make a difference in

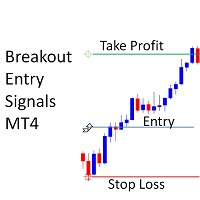
!! FLASH SALE !! Over 80% off !! For ONE week only. Now only $47 - normally $297! >>> Ends on 30 June 2023 - Don't miss it!
Buy and Sell Alerts when price breaks out following strict price action. Sends Alerts – On MT4 To Your Phone To Your Email
Does not repaint .
Works on any Forex pair, any timeframe.
10 Activations allowed so you are free from limitations >> MT5 Version Here For spreads from a tiny 0.1 pips RAW/ECN Accounts, click here . Check out my Waka Esque EA sig

QCAFE+ Trend Filters is a simple but useful for Traders to eliminate false signal from all kinds of Buy/Sell signal indicators. With QCAFE+, Traders can identify UP Trend/DOWN Trend or SIDEWAY period of Market to decide whether Enter a Trade or Not. With 5 Elements of Filters which are shown the Momentum and Strength of the Market; Each element has 3 types of arrows to show Uptrend (Blue UP arrows), Down Trend (Orange Down arrows) or Sideway (Grey Arrows). The Top Element is the main signal tha
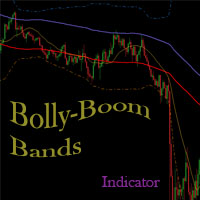
Bolly Boom Bands is an indicator which identifies when a Trend is strong and when it is not, hence it is just a lateral oscillation of the price which can push you to waste money opening inconsistent positions. It is so easy to use and similar to kind-of Bollinger Bands with Fibonacci ranges, it will be useful to find those channels where you should wait if price is inside or when these are broken to start operating into the trend area... As you can imagine it is recommended for opening position

用箭頭顯示價格反轉點。 適用於所有時間範圍和所有貨幣對。 適用於剝頭皮交易和長期交易。 當藍色箭頭出現時,您需要開一個買單。 當紅色箭頭出現時,您需要開賣單。 推薦時間框架 M5、M15、H1、H4。 該指標顯示 GBPUSD、XAUUSD、EURUSD、USDJPY、AUDUSD、USDCHF、EURGBP、EURJPY、EURCHF 和其他主要貨幣對的最佳結果。
該指標非常適合日內剝頭皮,因為它每天在較小的時間範圍 M5 和 M15 上顯示許多切入點。 也就是說,使用這個指標,我們可以在一天之內收到很多進場信號。
該指標的好處: 適合剝頭皮交易 在一天之內提供許多有效的入口點。 適用於所有時間範圍 適用於所有貨幣對
建議: 出現藍色箭頭時打開買單 出現紅色箭頭時打開賣單
指標設置: Averaging_Period - 指標的工作平均數。 此參數設置信號的數量和精度。 Send_Email - 發送信號到電子郵件和電話 width - 信號箭頭的大小
獎金: 購買指標 發表評論。 誠實的評論。 不一定好。 審查必須是誠實的。 獲得機器人作為禮物 https:/
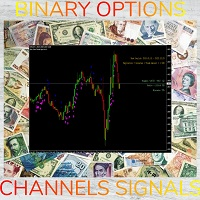
SYSTEM INTRODUCTION: The Binary Options Channels System Is Specifically Designed For Binary Options Trading. Unlike Other Systems And Indicators That Were Adopted From Other Trading Environments For Binary Options. Little Wonder Why Many Of Such Systems Fail To Make Money . Many End Up Loosing Money For Their Users. A Very Important Fact That Must Be Noted Is The Fact That Application Of Martingale Is not Required. Thus Making It Safer For Traders Usage And Profitability. A Trader Can Use Fi
SYSTEM INTRODUCTION: The Binary Options Momentum System Is Specifically Designed For Binary Options Trading. Unlike Other Systems And Indicators That Were Adopted From Other Trading Environments For Binary Options. Little Wonder Why Many Of Such Systems Fail To Make Money . Many End Up Loosing Money For Their Users. A Very Important Fact That Must Be Noted Is The Fact That Application Of Martingale Is not Required. Thus Making It Safer For Traders Usage And Profitability. A Trader Can Use Fi

What is a Point of Interest? Traders who follow Smart Money Concepts may call this a Liquidity Point, or where areas of liquidity have been built up by retail traders for for Big Banks to target to create large price movements in the market. As we all know, retail traders that use outdated and unreliable methods of trading like using trendlines, support and resistance, RSI, MACD, and many others to place trades and put their stop losses at keys points in the market. The "Big Banks" know these me

TradeMo 是一個 100% 準確的信號指標,僅響應價格行為。 因此,當 8 條線性移動平均線穿過 10 條線性移動平均線時,預期買入信號,當 8 條線性移動平均線低於 10 條線性移動平均線時,預期賣出信號。 而已! 看我在這裡解釋我是如何使用它的。
該指標會針對所有時間範圍進行調整,但我建議使用更高的時間範圍,例如 1 小時時間範圍,以最大化您的點數。 我有一種獨特的方式來解釋為什麼更高的時間框架在這裡使交易變得如此容易。
我不使用止損,但如果您必須使用,我建議您只使用 5 點止損。
指標說明: 為避免虛假信號,只有在出現信號警告框時才開始交易。 聲音通知可用。 為獲得最佳結果,我建議在 1 小時時間範圍內進行交易。 箭頭也將出現在圖表上,向下表示賣出交易,向上表示買入交易如果出現箭頭但沒有發出警報,則這是一個錯誤信號,因此可以防止重新繪製。
幾個月前,當我終於完成了這個指標的開發時,我製作了這個視頻來展示我的新指標的功能,直到今天它仍然完美運行。 在這裡使用我的課程僅 1 週後,聽聽一個完全陌生的人不得不說的話。 您可以在下面視頻的設置中關閉字幕您的語言。

VaviStar is an indicator based on trend retracements determined by ZigZag segments. It is theorized, and statistics confirm, that stocks react to certain retracement levels. Many use Fibonacci retracement levels (23.6%, 38.2%, 61.8%). It is assumed that once the price goes beyond the 61.8% retracement, we can already speak of a trend reversal. This indicator allows you to comfortably chart a segment of the ZigZag with the relative operating levels chosen. With a reversal mindset , you can use it

MAD - Moving Average Distance The MAD Indicator uses ATR and the distance to a moving average to determine if price has the potential for mean reversion. Works on all time frames and pairs. It will only check for the condition at the beginning of a new candle so it doesn't repaint. A signal will include an arrow on the chart, alert popup and cell phone notification.
Settings: ATR_Multiplier: Multiplier of ATR for the calculation. (Recommended: 5)
MA_Period: Moving Average Period to use (EMA

Dear Trader It is my pleasure to introduce to you my tool called the " Forex Sniper Indicator" . The major aim of this tool is to help serious traders and investors in all type of Financial Markets to catch price next movement right at the moment the price direction is about to change. This tool can be used to snipe the price direction in both down trend, uptrend and ranging markets. This tool can be used as the stand alone tool though it may be combined with other tools as well. My goal is to h

Fibo Quartz. It has a special fibonnaci where the indicator is placed and it adapts only to any temporality, works great for forex, all pairs. for crypto also if any broker offers. special for scalping and intraday With the indicator alone and the candles you can get high percentages of profit. That's why the Quartz fibo is made. World Investor. MT4!!!!!!!!!

Buy Sell Professional. It consists of an automated buying and selling strategy according to the arrow that appears on the graph and the alarm that goes off every time you mark a sale or purchase. Special for scalping and intraday. It works for all forex pairs, and if the broker has crypto too! The indicator also has a moving average, trix and mom to capture each movement of the market!

Uses a trend filter to plot the lines and arrows. Great for scalping. Settings: TrendPeriod: change to your preference. Alerts. How to use: Can be used on any time frame. Attached to chart, and wait for arrow to appear on multiple timeframes. Buy : - Blue arrow and blue line cross below price on multiple time frames; e.g., on D,W,M or H1,H4,Daily or M30,H1,H4 Sell : - Yellow arrow and red line cross above price on multiple time frames; e.g., on D,W,M or H1, H4, Daily or M30,H1,H4
**Best r

DYJ RSI控制器 是一个全货币对RSI交易系统它能显示每一个货币对M1到MN周期的RSI值当某个周期的RSI值达到超卖区和超买区时有颜色提示,你能根据这些信息做出正确的交易 请你制作一个RSI指标模板命名为DYJ RSI,保存它 当你用鼠标单击超卖区或者超买区时,自动打开相应货币对 周期的 图表,并加载RSI指标 INPUT
InpPairs = "GBPUSD,EURUSD,USDJPY,USDCHF,XAUUSD,USDCAD,GBPJPY,EURJPY,EURGBP,EURAUD,EURNZD,EURCAD,CADJPY,AUDUSD,AUDNZD,AUDCAD,AUDJPY,NZDJPY,NZDUSD,NZDCAD,GBPAUD,GBPNZD,GBPCAD,CHFJPY,NZDCHF,AUDCHF,EURCHF"; InpStrategyMinTimeFrame = PERIOD_M1 -- Strategy MinPeriod InpStrategyMaxTimeFrame = P

Bank Executive Indicator Uses A Simple method of tracking price as it moves across the chart and signals when a potential long or short position is active and indicates this to the trader giving you the opportunity to take a position on the market. Or you can simply use this indicator to give yourself signals and determine if you want to take the trade or learn the strategy on your own.
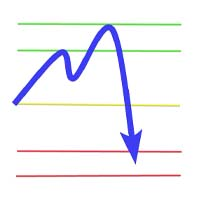
To measure the daily range, sell when above 30 pips in the European or US session, buy when below 30 pips in the European or US session. Take profit only around 30 pips because this is only an indicator for daily trading. FEATURES : Sum Range, max 30 Show Rectangle
Show Level
OC SR Line Width OC SR Line Color Show Label
Custom Label Position
Custom Font Label
Custom Font Size
Custom Mark Session
Show Line Break Event Point

Median Renko Terminator works best with renko charts if you do not have a renko chart generator I will email it to you for free and give you the correct settings for scalping or to swing trade NON-REPAINT COMES WITH ALERTS WHEN THERE IS A SIGNAL Conditions to sell: big purple arrow shows you the direction first then you take the small purple arrow to enter the same direction of the purple arrow. Conditions to buy: big white arrow shows you the up direction first then you take small white arrow
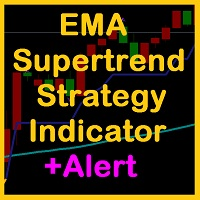
Exponential moving average (EMA) and super trend are popular and good indicators that is often and used to determine the trend direction. One of the best trading strategies with trailing stop is trading strategy with using a combination of Exponential Moving Average (EMA) and Super Trend indicators. EMA SuperTrend Strategy Indicator is the indicator consist of EMA, Super Trend and Alert function also other calculations are needed. It's also has extra indicator there are Automated Fibonacci Retr

Bank Expert Indicator Uses A Simple method of tracking price as it moves across the chart and signals when a potential long or short position is active and indicates this to the trader giving you the opportunity to take a position on the market. Or you can simply use this indicator to give yourself signals and determine if you want to take the trade or learn the strategy on your own. The Signals From this indicator are targeted at long-term positions and focus on top quality call outs.
!! FLASH SALE !! Over 80% off !! For ONE week only. Now only $47 - normally $297! >>> Ends on 30 June 2023 - Don't miss it!
Sends Alerts – On MT4 To Your Phone To Your Email
Does not repaint .
Works on any Forex pair, any timeframe.
10 Activations allowed so you are free from limitations >> MT5 Version Here
For spreads from a tiny 0.1 pips RAW/ECN Accounts, click here . Check out my Waka Esque EA signal here: >> High Risk Settings or Medium Risk Settings .
What Is An

The indicator is coded to be suitable for every parity and every period. The purpose of the indicator is to capture the correct signal levels. The product is equipped with all notification and alarm options. In this way, you will be able to receive signals even if you are not at the screen. The product tries to find the signals in the trend direction as a strategy. Thus, it is more reliable. you have input signals. For default settings, recommended periods should be M15,M30,H1.

Innovative Max Min swing This is a really different indicator for drawing Max and Min on the charts. This indicator draws Min and Max levels in a innovative way, based on a volatility proprietary calculation. In this way you will be able to draw trendlines in an objective way and also to see the break of Max and Min levels. You have three paramaters you can play with, in order to suite the volatility to your trading style. The indicator works on every time frame. Added: - Sound Notification
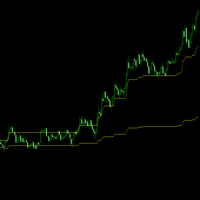
Is the market ranging (balance) or trending (Imbalance) ? This indicator exports a huge concept used in volume analysis (value area) into the price action. It makes it on Intraday level. How to read it? Simple! But you need to make practice. Making profit in market is more than a 2-rule system.
When the price inside the lines, the market is in "range mode".
If the price is above the upper line, the market is trending up.
If the price is below the lower line the market is trending down

Clear trend filter This is a filter-trend indicator. From the settings you can select to use more filter or less. The very interesting part of the indicator comes out using with all the filter. In this way you can follow the trend easily even when the market is without a strong trend, but is instead more flat. I personally use it on 1 minutue timeframe with MORE FILTER (you can select it from the input setting) in order to have an overlook of trend in the market. Added: - Sound Notificatio
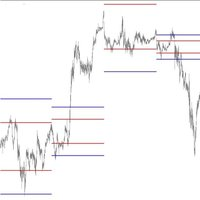
Equilibrium Levels support resistence Intraday indicator --> it means it works on lower TimeFrames , from 1minute to 4hours. This indicator is able to calculate and draw 2 levels (1 support and 1 resistence) representing the Barycenter's levels for a specific day session. From the setting you can choose only one parameter, that's the lenght of Barycenter's orbit. I personally attach the same indicator 2 times on the same chart, inputting as orbit: 0.15 and 0.30. Then what you will no
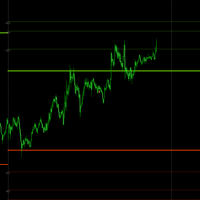
This indicator draws the projections of Fibonacci above the yesterday high and below the yesterday low. Why?
1) First of all, in this you can take the pulse of the market (trend or range). For instance If the price runs above yesterday's high the trend is UP.
2) In this way you will have automatic targets for the trend
3) you can wait the market on excess levels for contrarian and low risk trades.
If you buy the product feel free to contact me for additional tips or info.
I wish you
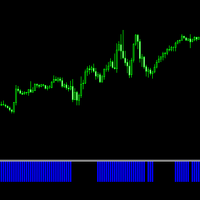
This is a clear and simple filter I've created based on a Ichimoku strategy and setup. I personally like to use the indicator in a multi timeframe approach. It can be used in a double way:
1) Every time the indicator change the colour, you can use the this first change as your trigger point.
2) You can follow the indicator for the trend direction and trade with your other signals.
Added: - Sound Notification - PopUp Notification - Mobile Push Notification (To make it work follow
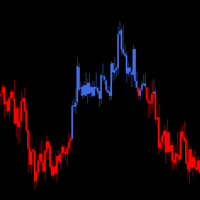
Never aginst the trend This is a really top indicator indicating the main trend in a clear and easy way. I reccomend you to use it on multiple timeframe in order to create a powerful view and strategy. It works on every market in the same way. If you trade against the trend you will work more for less, so stick with the trend. I hope you will find it useful. All the best with your trading! Keep it simple stupid, is the way! Added: - Sound Notification - PopUp Notification - Mobile Push Noti
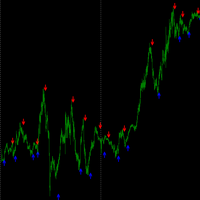
This indicator gives you nice trigger entry....whatever it is your trading style. You can use on different timeframes and also you can select from the setting the sensibility of the indicator itself, changing the input parameter "cycle period". For faster trigger signals you need to use shorter "cycle periods". You can use it in reversal strategy as well as in trending strategy. Added: - Sound Notification - PopUp Notification - Mobile Push Notification (To make it work follow the inst
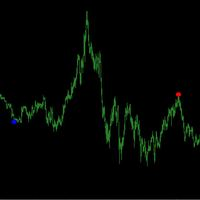
Semi automatic system John Bollinger bands Entry Bollinger Excess with Filter.With this indicator you can build your own semi-automatic strategy based on bollinger bands excess. You can play with the settings to find the best solution for your style and trading attitude. The indicator shows a signal whenever it finds a trigger-entry(coded inside) based on bollinger bands excess and an additional trend-filter(moving average). This tool will support your manual trading in order to easily spot
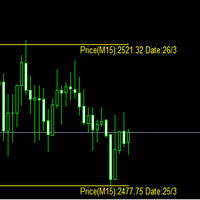
This indicator can spot strong volume levels on different timeframes. Everything is customised from the setting. You can hide by the colour the leveles you don't need. In this way you will map the market with reaction zone and you can use them as target levels or entry levels depending on your strategy. Hope you will find it useful and all the best with your trading. Added: - Sound Notification - PopUp Notification - Mobile Push Notification (To make it work follow the instructions: htt

'Zig Zag Percentage strenght' This indicator is awesome. Why? It's able to show the percentage of the last leg, compared with the previous leg. In this way you have a better understanding of the forces in play in that moment. In fact, for example, if you see that the up extensions are, in percentage, greater of the down legs, that means that there is more bullish pressure or maybe the market is starting to reverse from downtrend to uptrend. Hope you will ind it useful !
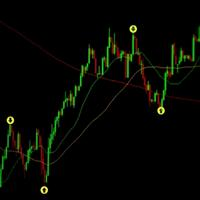
Indicator with 95% Assertiveness
Average of 2% to 3% per day of the value of your capital
Indicator that directs buy and sell entries based on bullish and bearish price targets.
Here are some settings to make it operational:
Currency pair: XAUUSD Timeframe: 15 Minutes Do not operate with news Better nighttime performance
Easy setup Full support
Schedule Take Profit to 100 pips
Entry only on the second candle
Any further queries, please get in touch. Support via WhatsApp.

Tame the trend just got easier! The PDS indicator will signal the use of price sentiment. Just one setting!
Study the offer of the indicator and get the opportunity for profitable trading based on a proven and tested strategy. The mathematical algorithm proves its performance even to skeptics under any market conditions. It goes well with any trading strategy. Never recalculates signals. Signals appear at the opening of the bar. Works with any financial instruments, including forex, cryptocur
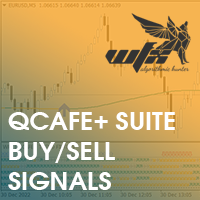
Based on Trend Following Strategy, QCAFE SUITE was built to get more accurate signal for Traders to decide whether to enter trades, included in the SUITE is QCAFE+ filter to eliminate false signals. The Signals are generated based on formula of Hull Moving Average ( HMA ) to minimize the lag of a traditional moving average - developed by Alan Hull in 2005 Setting: Limited Bars of back test Fast Period Low Period Fast/Low period to generate Buy/Sell signal
Based MA Period B ased Moving Averag

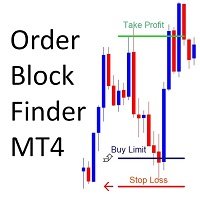
True Order Blocks is an excellent indicator for day traders, swing traders, and even scalpers. It is combined with multiple market-moving strategies. It identifies market structure, marks supply and demand zones, displays imbalance moves, structure break, trendline breakout, and much more. True order blocks are compatible with forex, stocks, cryptocurrency, and any market with any timeframe. NOTICE:- CONTACT ME TO GET FREE ACCESS OF ADVANCED TREND
And I'll show you how to use this tool in yo
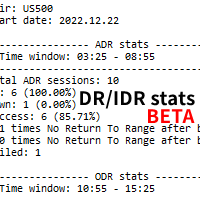
Based on the free DR/IDR indicator but with basic stats. Has the feature to export the daily data to a HTML file. So you can check the daily DRs yourself. Be mindful that the stats can vary from different broker feeds. So make sure your MT4 has enough data.
Scroll back in your MT4 and check for any gaps in the feed. Sometimes you will have to scroll back to update the stats. Feel free to contact me for questions related to the purchase, installation and use of the Indicator.
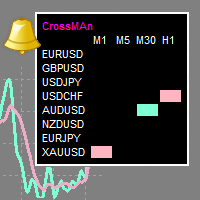
"CrossMAn" is a table indicator that gives signals about the intersection of two moving averages, on selected instruments and time periods.
The intersection of moving averages is one of the most popular signals on the stock exchange.
The signal is displayed as colored rectangles in the table. Thus, you can assess at a glance which tool should be paid attention to.
(Crossman does not add moving averages to the chart.)
The indicator table can be dragged with the mouse.
The size of the table

rsi sniper It has the strategy of an rsi line where the same indicator marks you buy and sell , When the line turns red, it marks a sale, it comes with alerts! + a red arrow that also confirms the sale, the same for the purchase, when the line becomes true mark sale, plus the alert accompanied by the phlegm that marks on the candle! works for all seasons ideal for scalping and day trading, suitable for forex and synthetic indices, all pairs are tradeable ! enjoy the sniper!

We’ll start off by just testing the default DMI crossover strategy. We’ll buy when the 14-period DMI-plus crosses above the 14-period DMI-minus, and sell once the former crosses below the latter. Here are the results: As you see, the strategy seems to work well in bull markets. Still, this isn’t something we’d like to trade in its raw form! So how could we go about improving the strategy? We’ll one common approach is to demand that ADX is above 25. However, in our tests, we’ve found out that a l

The Accelerator MT4 forex indicator was designed by Bill Williams’ and warns you of early trend changes for any currency pair. The indicator is also known as the Accelerator/Deceleration forex indicator. It basically looks for changes in momentum, either accelerating or decelerating. As you can see from the EUR/USD H1 chart shown below, the indicator draws green and red bars above and below the 0.00 level. Green and red bars above the 0.00 level suggest bullish momentum in price (price goes up).

Prometheus Trade Engine is an indicator that combines price action, ratio based indicator with custom indicators& other lagging indicators to create this leading indicator that has a multi-timeframe approach to trading so that you are able to see what other timeframes are doing all in one chart and give you high probability trade setups to assist you to make a prediction on what is MOST likely to happen in the market going foward
Chart Features 1. Reversal Zone
It is the rectangular box on
Parabolic SAR Parabolic SAR Technical Indicator was developed for analyzing the trending markets. The indicator is constructed on the price chart. This indicator is similar to the Moving Average Technical Indicator with the only difference that Parabolic SAR moves with higher acceleration and may change its position in terms of the price. The indicator is below the prices on the bull market (Up Trend), when it’s bearish (Down Trend), it is above the prices. If the price crosses Parabolic SAR

Everyday trading represents a battle of buyers ("Bulls") pushing prices up and sellers ("Bears") pushing prices down. Depending on what party scores off, the day will end with a price that is higher or lower than that of the previous day. Intermediate results, first of all the highest and lowest price, allow to judge about how the battle was developing during the day. It is very important to be able to estimate the Bears Power balance since changes in this balance initially signalize about possi

Everyday trading represents a battle of buyers ("Bulls") pushing prices up and sellers ("Bears") pushing prices down. Depending on what party scores off, the day will end with a price that is higher or lower than that of the previous day. Intermediate results, first of all the highest and lowest price, allow to judge about how the battle was developing during the day. It is very important to be able to estimate the Bears Power balance since changes in this balance initially signalize about possi

Everyday trading represents a battle of buyers ("Bulls") pushing prices up and sellers ("Bears") pushing prices down. Depending on what party scores off, the day will end with a price that is higher or lower than that of the previous day. Intermediate results, first of all the highest and lowest price, allow to judge about how the battle was developing during the day. It is very important to be able to estimate the Bears Power balance since changes in this balance initially signalize about possi
您可以将此指标与助理 EA 结合使用
MT4助手: https://www.mql5.com/en/market/product/91340
MT5 助手: https://www.mql5.com/en/market/product/97828
增强型动量加权移动平均线 (EMWMA) 指标
增强型动量加权移动平均线 (EMWMA) 指标是传统移动平均线的复杂变体,经过精心设计,旨在捕捉和放大市场动量,同时最大限度地减少虚假信号。 它经过微调,可以为交易者提供识别重要趋势和潜在反转点的高胜率。
算法及修改:
动态加权公式:EMWMA 采用动态加权公式,根据当前市场势头调整近期价格数据的重要性。 这种自适应功能使指标能够在波动时期做出更灵敏的反应,同时在平静的情况下保持对市场噪音的弹性。
波动性过滤器:EMWMA 结合了波动性过滤器,可以减轻不稳定价格波动的影响。 它通过调整对价格变化的敏感度来智能地适应不同的市场条件,确保在动荡的市场阶段提供更顺畅的信号。
确认信号:EMWMA 包括来自补充技术指标或价格行为分析的额外确认信号。 这些信号充当

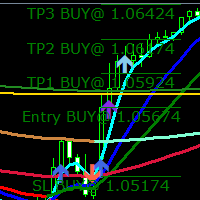
趨勢信號指標。 在圖表上用箭頭向交易者顯示價格反轉點和趨勢方向。 當紅色箭頭出現時,價格下降。 當藍色箭頭出現時,價格反轉向上。 該指標不會重新繪製其值。 不重繪箭頭。 箭頭出現在蠟燭的開頭。 您可以使用“period_long”和“period_short”參數調整信號的準確性。 如果您將這些參數的值設置得更小,指標將顯示更準確的短距離價格反轉點。 而如果需要看更長的趨勢,那麼就需要更多的指定這些參數的值(例如:period_long =77 and period_short=55)。
該指標的好處: 不重繪信號。 輕鬆調整以進行更精確的工作。 用箭頭顯示價格反轉點。
交易建議: 任何貨幣對。 時間框架 M5、M30、H1、H4、D1
指標設置: period_long - 計算趨勢長波的參數。 period_short - 計算趨勢短波的參數。 arrow - 箭頭的大小。
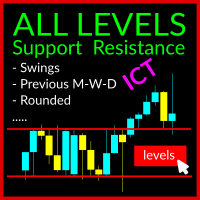
The Swing Levels Support and Resistance Indicator is a robust tool designed for MetaTrader 5 traders (also available for MT4). It aids in identifying crucial market levels where price direction may change by showcasing: Swing High and Swing Lows across all timeframes Previous Highs and Lows for Day, Week, and Month ICT US Midnight level and Yesterday Midnight Level ICT US Preopen 8:30 AM Level Rounded Levels This indicator features a toggle button, enabling you to display or hide these levels o
An Ultimate Tool for quick and efficient market analysis. Unique combination of solid indicators defining market direction for trend tracking and filtration designed for you to stay on the right side of the market.
Market Rider Tools gives you access to one of the most used from professional trades indicators on worldwide, which were not build in for MT4 and MT5 terminals . These are unique non-repainting indicators designed to be used on all time frames for all instruments classes: Fore

An Ultimate Tool for quick and efficient market analysis. Unique combination of solid indicators defining market direction for trend tracking and filtration designed for you to stay on the right side of the market.
Market Rider Oscillators gives you access to one of the most used from professional trades indicators on worldwide, which were not build in for MT4 and MT5 terminals . These are unique non-repainting oscillators designed to be used on all time frames for all instruments class

This Nice Trade Point indicator is designed for signal trading. This indicator generates trend signals.
It uses many algorithms and indicators to generate this signal. It tries to generate a signal from the points with the highest trend potential.
This indicator is a complete trading product. This indicator does not need any additional indicators.
The indicator certainly does not repaint. The point at which the signal is given does not change.
Features and Suggestions Time

該指標顯示黃金和其他貨幣對的價格反轉點。 建議工作時間:M1、M5、M15、M30、H1。 該指標分析市場並向交易者顯示價格可能朝另一個方向反轉的點。 信號的準確性取決於設置、週期和所選的操作模式。 平均而言,信號准確率高達93%,適合日內剝頭皮交易。 您可以使用“週期”設置中的參數來控制指標信號的準確性。 此外,信號的準確性取決於使用“重繪”參數選擇的信號過濾模式。 在“redraw=false”模式下,指標不重繪其信號並顯示大量日內交易信號。
在 XAUUSD 貨幣對的不同時間範圍內進行交易的推薦參數表: 週期M1-參數設置週期=2 週期M5-參數設置週期=2 週期 M15 - 參數設置週期=3 週期 M30 - 參數設置週期=5 週期H1-參數設置週期=4
樞軸點指標的好處: 有兩種操作模式(信號稀少但重繪的長波和大量準確信號不重繪的日內交易模式)。 這些模式在指標參數中配置。 指示器信號准確度高達 93% 適用於大多數貨幣對。 XAUUSD 的最佳結果 很好地顯示週期信號:M1、M5、M15、M30、H1 很容易設置
指標設置: period - 指標操作週期。

该工具能够根据价格变化 , 利用真实的数学计算方法来识别市场真实走势。 TradeighT 的执行正是基于一直存在的数学关系。 大多数投资者都在看相同的东西 , 研究相同的信息 , 这就是为何大多数人都亏损的原因。 该产品并非依照大多数人的想法而设计 , 而是基于支撑市场的四大基础。 该工具是一个可视化工具 , 易于理解 , 简单易用 , 适用于所有可回测的符号。 专为 MT4 打造。
该指标使用高反应价格水平: 提供当前获利价格 提供用于技术分析的水平 提供锯齿 提供当前趋势 提供高百分比的成功目标概率 ________________________________________________________________________________________________________________________________________________ 趋势线 (可选) 水平非永久性买入趋势线 编号从1到5 可从指标属性编辑颜色 用作买入订单的获利价格
水平非永久性卖出趋势线

This indicator labels swing highs and swing lows as well as the candle pattern that occurred at that precise point. The indicator can detect the following 6 candle patterns: hammer , inverse hammer , bullish engulfing , hanging man , shooting star and bearish engulfing .
The notations HH, HL, LH, and LL you can see on the labels are defined as follows:
HH : Higher high
HL : Higher low
LH : Lower high
LL : Lower low
Setting
Length: Sensitivity of the swing high/low de
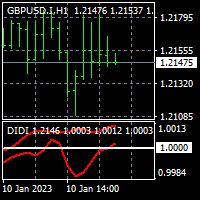
To get access to MT5 version please click here . - This is the exact conversion from TradingView: "Didi Index" by " everget ". - This is a popular version of DIDI index on tradingview. - This is a light-load processing and non-repaint indicator. - Buffer is available for the lines on chart and arrows on chart. - You can message in private chat for further changes you need. Thanks for downloading
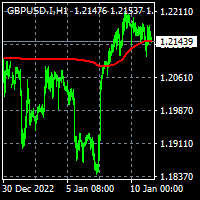
To get access to MT5 version please click here . - This is the exact conversion from TradingView: "Trend Regularity Adaptive Moving Average","TRAMA" By " LuxAlgo ". - This is a light-load processing and non-repaint indicator. - Buffer is available for the main line on chart. - You can message in private chat for further changes you need. Thanks for downloading

Lets dabble a bit into Elliot Waves.
This is a simple indicator which tries to identify Wave 1 and 2 of Elliot Impulese Wave and then projects for Wave 3.
Ratios are taken from below link: https://elliottwave-forecast.com/elliott-wave-theory/ - Section 3.1 Impulse
Wave 2 is 50%, 61.8%, 76.4%, or 85.4% of wave 1 - used for identifying the pattern. Wave 3 is 161.8%, 200%, 261.8%, or 323.6% of wave 1-2 - used for setting the targets
Important input parameters MaximumNumBars : To calculate
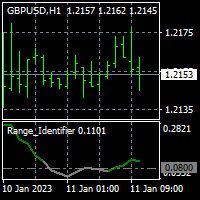
To get access to MT5 version please click here . - This is the exact conversion from TradingView: "Range Identifier" By "Mango2Juice". - All twelve averaging options are available: EMA, DEMA, TEMA, WMA, VWMA, SMA, SMMA, RMA, HMA, LSMA, Kijun, McGinley - This is a light-load processing and non-repaint indicator. - Buffer is available for the main line on chart and not for thresholds. - You can message in private chat for further changes you need.

The indicator changes the current chart timeframe depending on the drawdown in the deposit currency, the number of orders or the percentage of the deposit. You can set the drawdown in the deposit currency, the number of orders in one direction or the percentage of the deposit, at which the current timeframe will change to the selected one. This significantly reduces the drawdown during the work of Expert Advisors using order networks.
Indicator parameters: Drawdown in currency, orders or perce

在一个窗口中分析货币对的多个时间范围可能会让您感到困惑。
要分析多个时间范围,您需要可靠的指标。
其中之一是使用 9TF Double RSI Double MA。
我夜以继日地工作,以创建简单但可靠的代码,并在一个指标中涵盖所有九个时间范围。
让我们看一下该指标的一些优点:
双 RSI,即 RSI 更快和 RSI 更慢。 双 MA,即更快的 MA 和更慢的 MA。 10 配色方案。 每个时间范围内的曲线颜色各不相同。 RSI 的 OBOS 水平线。 实时 9TF 仪表板监视器。 9TF 仪表板监视器计算非常准确,即使您从一个时间范围更改为另一个时间范围也是如此。 监控哪条 RSI 曲线高于超买水平,哪条低于超卖水平。 监控曲线是否 MA 快线高于 MA 慢线,反之亦然。 监控曲线是否有 MA 快线和 MA 慢线之间的交叉。 监视当前信号与先前信号的移动。 在上升或下降的过程中。 (注意:这是剥头皮非常重要的功能!) 一个非常重要的趋势栏功能,用于发现长期趋势。 改变颜色的能力。 能够选择要显示的曲线。 能够仅显示 RSI、仅 MA、仅显示仪表板等。 能够将 9T
MetaTrader市场是独有的自动交易和技术指标商店。
阅读MQL5.community用户备忘更多地了解我们提供给交易者的独特的服务:复制交易信号,自由职业者开发的自定义应用程序,通过支付系统完成的自动付款和MQL5云网络。
您错过了交易机会:
- 免费交易应用程序
- 8,000+信号可供复制
- 探索金融市场的经济新闻
注册
登录