适用于MetaTrader 4的技术指标 - 133

Are you tired of missing crucial market movements? Do you wish for a tool that not only identifies swing points but also provides insights into price action movements?
Look no further – our Market Structure Analysis indicator is here to revolutionize the way you analyze markets on MQL5! MT5 Version : WH Market Structure Analysis MT5 Key Features:
Swing Point Detection: Our indicator excels at identifying significant swing points in the market, helping you understand key turning points with p

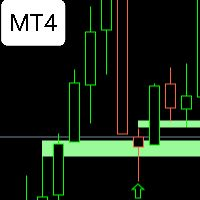
Simple but effective entry improving indicator that you want to use. Combine with other indicators and your trading strategies. Explore different ways to use it and find your perfect entry.
Basic instructions: Buy Signal Example: colour change from red to green Sell Signal Example: colour change form green to red
Check screenshots below for examples of use.

玛莉指标:MT4 中的精确交易 使用玛莉指标提升您的交易,该指标专为MT4和MT5中的卓越信号精确度设计。这一多功能工具针对加密货币和外汇市场进行了优化,为您的交易策略提供精确性和灵活性。 无缝集成至MT5:对于MT5平台用户,玛莉指标完全兼容且可在 此处 访问。 针对加密货币和外汇市场的优化: 加密货币卓越性 :玛莉指标专为动态的加密货币市场量身定制,提供精确及时的信号,对于导航加密货币交易至关重要。 外汇友好默认设置 :其设置同样适用于外汇市场,确保在不同的市场条件下具有多功能性和可靠性。 主要特点: 灵活的显示选项 :选择您偏好的信号显示方法——视觉冲击力强的箭头或信息丰富的文本标签。 可调敏感度 :微调敏感度,实现信号响应性和准确性之间的平衡。 高级ATR周期自定义 :调整ATR周期,以迅速适应波动的市场条件,增强您的分析。 基于平均趋势指示的信号 :通过基于平均趋势指示蜡烛的信号,探索市场趋势,提供独特的市场视角。 信号设计和提醒: 可定制视觉效果 :个性化信号大小和颜色,以获得清晰的视觉提示。调整文本标签颜色以提高可读性。 实时提醒 :配置提醒以保持最新状态。选择MT4弹

这确实需要一个分形来闭合,因此如果切换且分形尚未闭合,指标将再次计算。 这就是分形的本质。 该区内的交易是一个备受追捧的供需指标,以其在识别金融市场内关键交易区方面的有效性而闻名。 该指标的原始版本经常面临重新绘制和删除先前识别的区域的问题,与此不同的是,这种改进的迭代确保了这些区域在整个历史数据中保持可见,为交易者在确定关键支撑和阻力位方面提供了明显的优势。
该指标的主要功能围绕市场内供需动态的概念。 它确定了买卖压力之间存在严重不平衡的领域,从而导致潜在的转折点或交易者的兴趣水平。 通过避免重新绘制的常见问题(先前识别的区域消失或转移),交易者可以依靠指标的历史准确性来做出明智的交易决策。
从本质上讲,区域交易为交易者提供了一个宝贵的工具,可以更好地了解市场情绪并预测潜在的价格变动。 它能够保持历史数据中已识别区域的完整性,使交易者能够了解过去发生过重大价格水平的情况,从而促进更精确的进入和退出策略。
总体而言,区域内交易是一个强大的供需指标,通过提供准确可靠的历史区域信息,为交易者在应对复杂的金融市场方面提供了明显的优势。

我们向您展示 Currency Smart Scalper 指标 - 专为 EURUSD 货币对和 H1 时间间隔设计的新一代趋势指标。 这个强大的工具会自动分析市场并提供开仓和平仓信号。 使用 Ichimoku、抛物线 SAR 和布林线指标,Currency Smart Scalper 在外汇市场交易时提供无与伦比的效率。 通过订阅我们的频道,了解有关指标和其他交易相关主题的更多信息 。 该指标的主要优点是其准确的信号。 得益于对源指标的全面数据分析,Currency Smart Scalper能够为进出市场提供可靠的信号。 这使得交易者能够做出交易决策并为有利可图的交易做出准确的预测。
通过以箭头的形式直观地显示信号,该指标可以让您快速轻松地了解何时开仓和平仓。 此外,我们的指标配备了过滤器,可以消除市场噪音,使您能够做出最准确和最有利可图的决策。
Currency Smart Scalper 还提供不同类型的警报,包括推送通知和音频警报,因此您永远不会错过重要的交易信号。 得益于此,您可以随时了解当前的市场状况并及时应对变化。
Currency Smart Scal
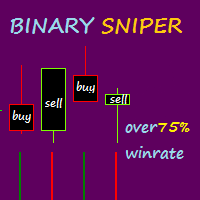
Binary Sniper 是一个 mt4 指标,为二元期权交易提供买入和卖出信号,该指标有不同的方法, 对于二元期权交易,该指标不会重新绘制或延迟信号。 参赛规则: 1. 看涨(买入),当红色蜡烛收盘时,二进制狙击条颜色在红色后变为绿色。(第一次颜色翻转) 2. 卖出(卖出),当绿色蜡烛收盘时,二进制狙击条颜色在绿色后变为红色(第一次颜色翻转)。 该指标适用于价格行为/交易量和蜡烛形态,因此设置受到限制。 ==========================================================================================================

介绍 Session Range Highlight 指标 使用 Session Range Highlight 指标,释放您在外汇交易中精准定位的力量。这款工具旨在简化您的交易体验,为您轻松识别会话高点和低点提供了关键。 主要特点: 清晰的会话可视化: 轻松识别和可视化图表上的会话范围。 通过精确定位特定市场会话期间的关键价格水平,增强您的交易策略。 简单而优雅的设计: 简单之美 - 我们的指标拥有简洁而用户友好的设计。 在不妥协功能的前提下,欣赏会话范围的视觉愉悦。 轻松识别会话极值: 立即识别每个交易会话内的最高和最低价格。 通过快速查看突出显示的会话范围,做出明智的交易决策。 ️ 简便的定制: 使用可定制的设置调整指标以适应您的喜好。 选择与您独特交易环境相匹配的颜色和样式。 兼容性: 与流行的交易平台无缝集成,确保无忧体验。 使用 Session Range Highlight,释放您交易策略的潜力。这不仅仅是一个指标;这是您掌握会话分析的视觉指南。 立即在 Meta Market 上获取,提升您的交易体验! 感谢您选择 S

Introducing our advanced MQL4 Indicator, a groundbreaking tool for identifying support and resistance zones with unmatched precision. Elevate your trading strategy with a host of features, including a dual-color upper and lower box system that allows for easy visual recognition of market trends.
Key Features: Dual-Color Box for the Support and Resistance Zones Customize your analysis with dual-color box. The upper and lower boxes offer distinct colors, providing a clear visual representation o

该指标最多绘制 6 个级别,可以根据交易者的要求启用/禁用以使图表更清晰
这 6 个级别分为 2 组:高和低
对于每组,可以选择不同的时间范围
它基于先前高低反转的策略,因为它认为当价格达到每日、每周或每月高低时,价格通常会在更小的时间范围内(如 5 分钟)显示拒绝
特征 :
- 在单个图表中跟踪多达 6 个时间帧高低点
- 在这些级别设置警报,邮件、推送或终端警报,当价格触及这些级别时,您将立即收到警报
- 自定义关卡样式,包括线条样式、宽度、颜色等
- 班次:想要跟踪或研究第 2 天或第 3 天的高低?您可以将 shift 设置为 2 用于 2nd Bar 的 High Low 或 3 设置为 3rd Bar 的 High Low 等等。
该指标最多绘制 6 个级别,可以根据交易者的要求启用/禁用以使图表更清晰
这 6 个级别分为 2 组:高和低
对于每组,可以选择不同的时间范围
它基于先前高低反转的策略,因为它认为当价格达到每日、每周或每月高低时,价格通常会在更小的时间范围内(如 5 分钟)显示拒绝
特征 :
- 在单个图

Cobra Pivot Points 是一个用于绘制最佳优化枢轴点的指标,您可以通过下载 DEMO 自行回测。
1. 选择两种最佳枢轴模式:Cobra Pivots 或 Camrilla Pivots
2. 您可以使用任何时间范围,不限于 D1。
3. 您可以使用 Shift 参数来调整前一天的高低收盘值。 1 = 前一柱,2 = 前一柱之前的柱,依此类推。这些参数将帮助您研究和开发枢轴。
4. 触摸级别后发出警报、电子邮件或推送通知。 一旦触及水平,枢轴水平将被视为缓解,因此不会再次提醒您。 如果您想再次发出警报,则需要更改时间范围以重置警报。
5. 完全自定义线条颜色、线条样式、线条宽度、文本颜色和字体。
Cobra Pivots 分为三个区域:LZone(非常接近的剥头皮水平)、NZone(当市场盘整时)和 HZone(距离稍远的水平最适合头寸交易),可以在指标设置中显示/隐藏。
卡姆里拉枢轴公式为:
LS1 = 前一日收盘价- ((前一日最高价-前一日最低价)*0.50);
LS2 = 前一日收盘价- ((前

Introducing our revolutionary intra-day trading indicator, meticulously crafted to optimize your trading insights within the 24-hour market cycle. Immerse yourself in historical data with precision using two distinctive modes - "All History" and "Last X Hours."
Key Features: All History Mode Uncover a comprehensive view of the day's dynamics. Instantly analyze the preceding day's high and low, 50% mid-point, and the open versus close price for the current day. Decode critical patterns to infor

An extended version of the indicator for visualizing the time ranges of key trading sessions: Asian, European and American. The main advantage of this indicator is the automatic construction of a price profile for a trading session. The indicator has the functionality to set the start and end time of each trading session, as well as automatically determine the time zone of the trading server. The indicators include the ability to work with minimal CPU usage and save RAM. In addition, the option

箭头指示器"冷量"是基于mt4上的滴答量。
指标本身跟踪在一段时间内买入或卖出的数量(时间框架选择)。 当卖家或买家的交易量出现异常过剩时,它会发出卖出或买入的信号。
在较低的窗口中绘制彩色直方图,其中绿色显示了当时买家的主导地位,这意味着在这个价格范围内可能立即逆转增加。 相反,红色表示卖方的优势,这意味着潜在的立即向下逆转。
此外,为了方便视觉感知,箭头已直接添加到主图表窗口。
为了方便用户,外部变量包含信号频率及其在历史记录(HistoryBars)上的编号的设置变量。 但不建议将值设置为1000以上。 更多的这将减慢您的终端的性能。
同样在"===<<箭头设置>>>==="部分中,您可以自己设置任何箭头和直方图参数。 直方图的厚度,箭头与蜡烛的距离,箭头代码及其颜色。 或者您可以完全禁用主图表窗口上的箭头。 箭头和信号根本不画。 即使在更改时间框架和更新终端之后。 但有必要在固定直方图和箭头后进入交易! 祝大家好运!!!

MT4 外汇指标“WPR 和 2 条移动平均线”
WPR 本身是剥头皮的最佳振荡器之一 “WPR 和 2 条移动平均线”指标可让您查看 WPR 振荡器的快速和慢速移动平均线 指标提供了尽早看到价格调整的机会 通过参数设置该指标非常容易,它可以在任何时间范围内使用 您可以在图片上看到买入和卖出的入场条件 考虑买入(卖出)信号条件: (1)-快速MA向上(向下)穿越慢速MA且WPR值低于(高于)-50值:开启买入(卖出)交易 (2) - WPR值位于-20以上的超买区(-80以下的超卖区):退出买入(卖出)交易
// 这里提供更多优秀的 EA 交易和指标: https://www.mql5.com/en/users/def1380/seller // 也欢迎您加入盈利、稳定、可靠的信号 https://www.mql5.com/en/signals/1887493 它是仅在该 MQL5 网站上提供的原创产品。

The Trend Analysis Indicator is an innovative tool designed for traders and investors who seek to navigate the complexities of the financial markets with greater precision and insight. This powerful indicator is engineered to adeptly identify whether a market is trending or not, offering users a vital edge in their trading strategy. Key Features: Accurate Trend Detection : The core functionality of the Trend Analysis Indicator lies in its ability to accurately detect market trends. It analyzes p
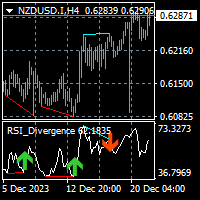
The indicator shows/alerts divergences of RSI indicator. note: You can check the free EA here that utilizes this indicator. repaint and lag issue Divergence indicators are usually repaint and lagging in their nature. You may have experienced in trading when you see a divergence on chart but the divergence continues further or just disappear. pivots_period input The smaller this value is the more and faster signals are generated. The greater this value you will have less and late signals. displa
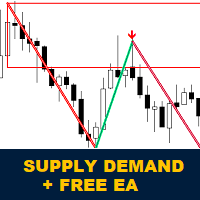
介绍 Koala 供需指标 MetaTrader 4:
欢迎使用 Koala 供需指标。该指标设计用于识别不间断的供应和需求区域,有助于交易者将市场视为区域,您可以看到价格如何尊重一些强大的区域,该指标还可以在这些区域内形成价格行动信号时显示给您。 加入 Koala Trading Solution 频道 在 mql5 社区中获取有关所有 Koala 产品的最新消息,加入链接如下: https://www.mql5.com/en/channels/koalatradingsolution https://www.mql5.com/en/blogs/post/755700
重要提示 :此产品包含免费的专家顾问(EA)。购买后,请在MQL5 Messenger上与我联系,以获取与指标关联的免费EA。 重要提示: 从1.2版本开始,此指标是多时间框架供需指标,用户可以通过点击按钮在不同时间框架间切换。
主要特点:
图上回测功能:通过独特的图上回测功能体验分析的未来。只需单击图表上的任何位置,立即查看该特定时刻的未过期供应和需求区域。此功能使用户能够实时了解更明智的决策。 价

Introducing our groundbreaking indicator designed to elevate your trading strategy! Unlock the power of precise volume analysis with Buy, Sell, and Neutral indicators. Tailor your approach with customizable levels based on timeframes and moving average methods.
Key Features: Dynamic Volume Insights Instantly identify Buy, Sell, and Neutral volumes for informed trading decisions. Gain clarity on market sentiment like never before. Adaptable Level Configuration Customize and adapt levels to matc

LLAMA stands for Lag-Less Adaptive Moving Average it is a state of the art moving average that is very close to the price, specially those sudden moves that put every typical moving average away from the price. This finding comes from the latest research in adaptive moving averages, with a lag close to 0
This MA keeps a very high smoothing ability while keeping a lag almost null.
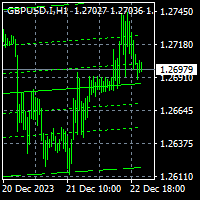
To get access to MT5 version click here . This is the exact conversion from TradingView: "Linear Regression Channel" by "LonesomeTheBlue". This is a repaint indicator. Buffers are not available for processing. You need to parse objects on chart. All input fields are available. You can message in private chat for further changes you need. Thanks for downloading
FVG WATCHER is an indicator that helps traders identify fair value gaps in the market. The indicator draws fair value gaps and alerts the user when the fair value gap has been swept. It allows users to specify how it should be swept, what time range to alert, and the size of the fair value gap to alert. It also allows the user to apply a moving average trend filter for better choice of alerts. The indicator also allows push mobile notifications. What makes FVG Watcher special is that it can be
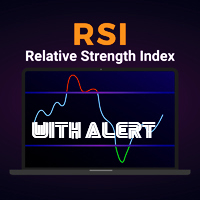
Indicador Universal RSI con Alertas de Oportunidad Este indicador para MetaTrader ha sido meticulosamente diseñado para adaptarse a todos los periodos de tiempo, proporcionando una herramienta versátil para los operadores de todos los niveles. Basado en el índice de fuerza relativa (RSI), este indicador destaca oportunidades potenciales en el mercado y te notifica de manera instantánea a través de alertas personalizadas. Características Principales: Universalidad de Periodos de Tiempo: Funciona
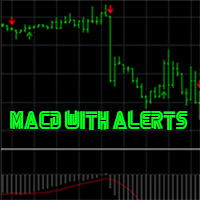
Indicador de Oportunidades MACD en Tiempo Real con Alertas de Precisión Descubre un indicador excepcionalmente preciso diseñado para potenciar tu experiencia de trading. Basado en el Moving Average Convergence Divergence (MACD), este indicador ofrece señales nítidas y oportunas, mejorando tu capacidad para identificar puntos de entrada y salida estratégicos. Además, este potente instrumento te mantendrá informado con alertas en tiempo real, proporcionándote una ventaja competitiva en los mercado
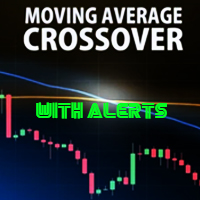
Descubre una nueva dimensión en el análisis técnico con CrossAlert MA, un poderoso indicador basado en cruces de medias móviles con funciones de alerta incorporadas. Diseñado para MetaTrader 4, CrossAlert MA utiliza la estrategia de cruce de medias móviles para identificar cambios significativos en la dirección del precio, proporcionando señales claras y oportunas. Características Principales: Cruces de Medias Móviles: CrossAlert MA aprovecha la potencia de los cruces de medias móviles para iden

PrecisionBands Descripción: Explora el mundo del trading con mayor precisión utilizando PrecisionBands, un indicador avanzado basado en las famosas Bandas de Bollinger. Diseñado para MetaTrader 4, PrecisionBands combina la versatilidad de las bandas de volatilidad con marcadores nítidos de señales de compra y venta, proporcionando una herramienta esencial para los traders que buscan tomar decisiones informadas. Características Principales: Bandas de Bollinger Mejoradas: PrecisionBands utiliza al

Introducing our groundbreaking indicator designed to elevate your trading experience by employing a unique fusion of price and time calculations. This innovative tool goes beyond traditional methods, utilizing advanced algorithms to draw levels and determine the authenticity of market peaks. Welcome to a new era of precision trading with our [Indicator Name]! Key Features: Price and Time Calculations: Harnesses the power of sophisticated price and time calculations to identify key levels on the

Introducing our cutting-edge indicator, designed to revolutionize your trading approach by capturing trends at a unique 90-degree angle. The [Indicator Name] is a powerful tool that automatically draws trend lines, providing a visual representation of extended trends for breakout strategy enthusiasts. Key Features: 90-Degree Angle Trend Lines: Identifies and draws trend lines at a precise 90-degree angle on the chart. Captures extended trends with mathematical accuracy, enhancing the visibility

Introducing our innovative trading indicator, designed to transform the way you analyze price movements. The [Indicator Name] goes beyond traditional methods by dynamically drawing two distinct trends on the chart. The space between these trends acts as a unique reflection surface, providing valuable insights into potential market reversals and trend continuations. Key Features: Dual Trend Drawing: Automatically draws two trends on the chart, creating a visually distinctive analysis of price mov

Unlock the secrets of the market with our groundbreaking indicator, [Univerasal Code], a fusion of astronomy strategy and numerology calculations. This unique tool revolutionizes your trading approach by dynamically drawing precise support and resistance levels on your MetaTrader charts. Key Features: Astro-Numerical Precision: Leverages advanced astronomy strategy and numerology calculations for unparalleled precision in identifying support and resistance levels. Unveils a strategic approach to

My indicator is 1000%, it never repaints, it works in every time period, there is only 1 variable, it sends notifications to your phone even if you are on vacation instead of at work, in a meeting, and there is also a robot version of this indicator With a single indicator you can get rid of indicator garbage It is especially suitable for scalping in the m1 and m5 time frames on the gold chart, and you can see long trends in the h1 time frame.
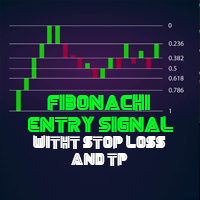
Indicador Trend and Fibonacci ProTrader Mr Beast El Indicador Fibonacci ProTrader v1.0 es una potente herramienta diseñada para optimizar tus estrategias de trading en MetaTrader, aprovechando la precisión y la lógica de la secuencia de Fibonacci. Este indicador incorpora señales avanzadas de take profit, tendencia take profit y stop loss, proporcionando una guía estratégica sólida para tus operaciones. Características Principales: Secuencia de Fibonacci Dinámica: El indicador traza automátic

ndicador ADX Crossing Alertby Mr Beast El Indicador ADX Crossing Alert v1.0 es una herramienta avanzada diseñada para potenciar tu análisis técnico en MetaTrader, centrándose en las señales generadas por el cruce del Indicador de Dirección del Movimiento (ADX). Este indicador ofrece alertas visuales en el gráfico y la conveniencia de alertas via email, permitiéndote estar siempre al tanto de las oportunidades de trading. Características Destacadas: ADX Crossing Signals: El indicador utiliza el c

The PUA MultiType Pivot indicator is built on the daily chart of the previous day. The PUA MultiType Pivot indicator is one of the most popular tools in technical analysis, used by traders to identify potential reversal points in financial markets. This indicator constructs three types of Pivot points: Classic, Fibonacci, and Camarilla, each offering its unique approach to market analysis. The advantages of this indicator include: Simplicity and Clarity PUA MultiType Pivot provides clearly defi

Created by imjesstwoone and mickey1984, this trade model attempts to capture the expansion from the 10:00-14:00 EST 4h candle using just 3 simple steps. All of the information presented in this description has been outlined by its creators, all I did was translate it to MQL4. All core settings of the trade model may be edited so that users can test several variations, however this description will cover its default, intended behavior using NQ 5m as an example. Step 1 is to identify our Price Ra

The indicator displays information on the chart about the average number of points per day the price of the instrument and the spread.
It differs from analogues in that it does not take into account huge or insignificant daily fluctuations, they are smoothed out, so in any situation it allows you to see the real picture, not distorted by random news bursts or days with "near zero" trading activity. How can the indicator be useful? 1. Assistance in choosing charts for trading with the required v
FxTDR is a bespoke technical indicator tailored for analyzing asset prices. The primary objective of this indicator is to identify favorable entry points for trading on selected currency pairs. It employs a set of criteria to detect optimal trading opportunities within the chosen time frame.
Key Features: 1. Entry Point Detection: Pinpoints favorable trade conditions. 2. Arrow Signals: Provides visual cues for identified opportunities. 3. Push Notifications: Real-time alerts for timely awaren

#WinPlus Trend and Entry Indicator
Unlock the power of precision in your trading with WinPlus, a bespoke technical indicator designed for financial assets. This indicator is meticulously crafted to discern trends and pinpoint entry opportunities across a diverse range of currency pairs on the h4 Timeframe. WinPlus analyzes price movements and utilizes our advanced algorithms to identify trends. When an optimal entry point is detected, the indicator generates clear arrow signals on the chart.
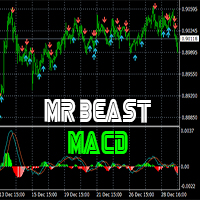
MR BEAST MACD Momentum Signals BUY SELL es una poderosa herramienta diseñada para optimizar las decisiones de trading al identificar oportunidades clave de compra y venta en los mercados financieros. Basado en el popular indicador MACD (Moving Average Convergence Divergence), este sistema utiliza algoritmos avanzados para generar señales precisas que reflejan cambios significativos en la dinámica del mercado. Características Destacadas: Señales de Compra y Venta Precisas: El Indicador MACD Mo

力向指标
力向技术指标的基础是将一组元素组合在一起,这些元素可用于帮助交易员衡量价格运动的相对强度,并同时识别和跟踪趋势的方向性。
该指标由一个慢速振荡器(黑线)、一个快速振荡器(灰线)和一个具有降低值的指数中线组成,该中线充当信号线(蓝线),识别运动的逆转并充当方向指南。该指标的振荡器在100值的上方或下方移动,比较最后一个价格的收盘价与先前的收盘价,无论时间视野如何。
该指标在识别趋势逆转方面特别有效,可以成功地应用于任何时间框架。然而,建议在更长的时间框架上使用它,以更准确地评估运动或趋势的强度,以做出更明智的决策。
如何使用: 建议的策略是当慢速振荡器向上穿过信号线,值小于100时,做多,当其向下穿过信号线,值大于100时,做空。值的扩展越大,入场效果越好。只要慢速振荡器在信号线上方,就保持多头仓位,只要慢速振荡器在信号线下方,就保持空头仓位。
关键模式: 泡沫: 往往预示着趋势逆转或突显仓位卸载。当快速振荡器向上穿过慢速振荡器(预示上升趋势)或向下穿过慢速振荡器(预示下降趋势)时形成。泡沫是趋势强度和即将结束的宝贵指标。
分歧: 当力向指标与价格运动

The GGP SuperTrend MT4 Indicator is a technical analysis tool that can assist investors in identifying market trends. The indicator is based on ATR and is very useful for capturing the direction of an asset’s momentum and is widely employed when looking at stocks, currencies, and commodities. It plots a line on the price chart, which acts as a dynamic level of support or resistance, helping traders and investors make informed decisions about entry and exit points. This indicator is MT5 conversi

"MR BEAST ELLIOT WAVES" para MetaTrader: Transforma tu Trading con Precisión y Generosidad El indicador "MR BEAST ELLIOT WAVES" para MetaTrader es una herramienta innovadora que combina la precisión de las ondas de Elliott con la filantropía de Mr. Beast. Diseñado para traders de todos los niveles, este indicador proporciona una visión clara de las oscilaciones del mercado, identificando patrones de manera efectiva. Características Principales: Ondas de Elliott Simplificadas: El indicador visual

El indicador "MR BEAST PATTERNS WITH ALERTS" es una herramienta avanzada diseñada para identificar y notificar automáticamente patrones de oportunidad en el mercado financiero. Basándose en una combinación de análisis técnico y algoritmos inteligentes, este indicador escanea constantemente el gráfico en busca de patrones específicos que podrían indicar momentos propicios para la toma de decisiones. Características Principales: Detección de Patrones: El indicador identifica patrones de oportunida

Indicador "Candlestick Alert Pro" para MetaTrader: Maximiza tu Trading con Alertas de Patrones de Velas El indicador "Candlestick Alert Pro" es una herramienta esencial para traders que desean potenciar su análisis técnico, identificando patrones de velas clave y recibiendo alertas estratégicas en tiempo real. Compatible con MetaTrader, este indicador proporciona una visión detallada de la acción del precio, permitiendo decisiones informadas y oportunas. Características Destacadas: Identificació

Asesor Experto "MR BEAST MIN MAX Price Extremes Master": Potencia tu Trading con Precisión en Mínimos y Máximos El asesor experto "Price Extremes Master" redefine la toma de decisiones en el trading al basarse en los precios mínimos y máximos del mercado. Este innovador asesor utiliza algoritmos avanzados para identificar oportunidades estratégicas en los puntos extremos de precios, permitiendo a los traders capitalizar las fluctuaciones del mercado de manera eficaz. Características Destacadas:

LLAMA MACD has been made from the same formula that creates regular MACD. The only difference is that both smoothing alogrithms has been replaced by the LLAMA (LagLess Adaptive Moving Average)
Main parameters are the same : 2) LLAMA Period (Fast) 1) LLAMA Period (Slow) 3) LLAMA Signal Period
and the LLAMA Parameters are the same as with the single AMA: 1) ActiveBar : computes last bar as well in Realtime (higher CPU usage) 2) ATRPeriod 3) ATRDistMul =: Multiplier1 (Detect) 4) ATRDistMul2 :
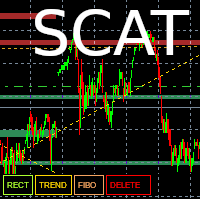
This tool allows you to draw trend lines, polarity zones, supports and resistances, Fibonacci retracements and save them. The user has 4 buttons which are displayed in their default configuration at the bottom left of the main window :
- A "Level" button allowing you to draw support and resistance zones
- A “Trend” button allowing you to draw a trend line
- A “Fibo” button allowing you to display a Fibonacci retracement
- A “DELETE” button which allows you to delete the selected object.

Indicator Name: SignalPro Serro Buy Sell Arrows Description: SignalPro Serro Buy Sell Arrows is a powerful and user-friendly MQL4 indicator designed to enhance your trading experience by providing clear and accurate signals for market sell opportunities. Developed with precision and reliability in mind, this indicator is a valuable tool for both novice and experienced traders. Key Features: Buy and Sell Arrows: The indicator displays clear buy and sell arrows on the chart, making it easy for tra

LLAMA BB has been made from the same formula that creates regular BB. The only difference is that the smoothing alogrithms have been replaced by the LLAMA (LagLess Adaptive Moving Average)
Main parameters are the same :
2) LLAMA Period
1) STDDEV Period
3) STDDEV Multiplier
and the LLAMA Parameters are the same as with the single AMA:
1) ActiveBar : computes last bar as well in Realtime (higher CPU usage)
2) ATRPeriod
3) ATRDistMul =: Multiplier1 (Detect)
4) ATRDistMul

Старый, добрый "AP" в версии трендового осциллятора. Это простой индикатор, который использует максимум возможностей языка MQL4. Но при этом он работает достаточно быстро даже на процессорах 1 Гигагерц и менее. При анализе следует обращать внимание на пересечение уровня 50, если вы намеренны использовать его как трендовый индикатор. Индикатор не перерисовывает, и работает на всех типах графиков и таймфреймах. Сделаны основные возможности оповещения, оповещения работают в обоих направлениях

Exclusive Limited Time Offer! Grab this powerful indicator for a lifetime at just $89. Introducing a cutting-edge, non-repainting indicator designed for peak performance in dynamic markets across various timeframes. Enjoy seamless compatibility with any symbols and receive timely mobile alerts. Indicator Features:
Multiple Timeframe Dashboard Conduct comprehensive multiple timeframe analysis from M1 to Monthly charts simultaneously with our dashboard. Higher timeframe signals can confirm lon

All in one Indicator. Multiple market analysis tools. Non-Repaint Oscillator signals, Trend lines, Price channel, Fibonacci levels, Support and Resistance, Regression, Pivot levels, Candle Strength and Oversold/Overbought line detector. Includes buttons to hide or show. Advanced algorithms to detect important reversal points and draw trend lines or shapes automatically in appropriate areas. A simple and professional chart display, user friendly and easier to understand for faster and accurately

ForexAnalysis Indicator that shows a whole series of information that the broker doesn't tell me, i.e.: volumes, swaps, that is, what I spend every day to leave it open, then you see the pivot with a suggestion on the operation and the stop loss to adopt. We see that with this new indicator, when the price approaches the zero line of the trade, which is automatically suggested, generally with Price Action signals on the screen, we are at an advantage because in the lower bar we have an indicati

产品从另一个平台转换而来,由 TradeMaster Lite 原创。该指标基本上使用 MACD 概念,但通过不同类型的平均技术来增强其能力。它在趋势和反转识别方面非常强大。
以下是原作者提供的一些详细信息:
我们提供的是一个可定制的 MACD 指标,具有以下功能: 多时间框架 可发现异常波动的偏离带 9 种移动平均线类型 条件着色和线交叉 用于发现异常波动的偏离带: 围绕信号线绘制的偏离带有助于识别异常波动期。当 MACD 线在偏离带之外交叉时,表明市场正变得更加波动,并可能朝着该方向形成强劲趋势。
脚本中可使用 9 种移动平均线类型。每种类型的移动平均线都提供了独特的视角,可在不同情况下用于识别市场趋势。 SMA(简单移动平均线): 它按所选数值范围内的周期数计算该范围内数值的平均值。 SMMA(平滑移动平均线): 它考虑了所有可用数据,并对各值赋予相同权重。 EMA(指数移动平均线): 它对最近的数据点赋予更大的权重和意义。 DEMA(双指数移动平均线): 这是一种移动速度更快的平均值,使用专有计算方法来减少数据点的滞后性。 TEMA(三重指数移动平均线): 它
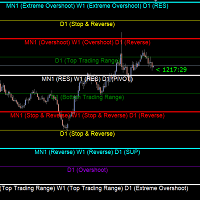
Gold Levels MTF - this is a fine stock technical indicator. The indicator algorithm analyzes the movement of the asset price, displays price levels of support and resistance from all time frames (TF) using the Murray method based on the Gann theory. The indicator indicates overbought and oversold fields, giving an idea of possible reversal points and at the same time giving some idea of the strength of the current trend. Description of levels: (Extreme Overshoot) - these levels are the ultimat

Introducing the Gold Massive Arrow indicator, exclusively designed for gold traders in both long-term and short-term markets. This cutting-edge tool provides high-probability trading signals without the need for numerous indicators, streamlining your trading experience in the dynamic gold market.
Tailored for traders of all styles, this 15-minute signal indicator offers the potential for both long-term and short-term traders to maximize profits within a single tool.
Crucially, the indicators
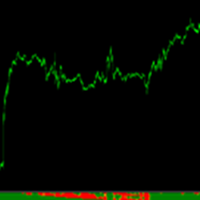
Power Real Trend es un indicador que no repinta y que muestra la dirección real que tiene el mercado, ofreciendo una clara manera de confirmar entradas. Es un indicador que para su constitución se realizan múltiples operaciones para formar los distintos rangos que se utilizan para su creación. Tiene un manejo muy sencillo dando sólo tres posibles valores (1,0,-1) altamente visual y de muy sencilla comprensión. La parte superior del mismo es la zona más sensible y la inferior corresponde a la te
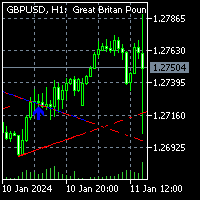
To get access to MT5 version click here . This is the exact conversion from TradingView: "Trendlines with Breaks" by LuxAlgo
This is a REPAINT indicator. Buffers are available for processing. However there are objects on chart to process also. All input fields are available. Alerts are generated based on bars closure. You can message in private chat for further changes you need. Thanks for downloading

现在用中文: 您是寻找金融市场长期机会的投资者吗? 我向您介绍自定义长期趋势指标。该指标专为希望在比日线、周线和月线更长时间跨度上交易仓位的交易者设计。 凭借清晰而准确的信号,您将获得所需的支持,以做出明智的决策。 主要特点: 长期策略:该指标非常适合致力于长期交易的投资者。 推荐时间框架: 我建议在比日线更长的时间框架上使用该指标,以获得最佳结果。 准确的信号: 等待指标生成的信号和蜡烛图的收盘,以做出明智的决策。 挂单交易: 为了优化使用,请考虑使用挂单交易,如买入止损单或卖出止损单。 适当的手数: 账户余额较小的情况下,可以通过使用0.01手的手数来进行有效的风险管理。 推荐货币对: 该指标的理想货币对包括XAUUSD(黄金)、XAGUSD(白银)、EURUSD(欧元/美元)和GBPUSD(英镑/美元)。 重要提示: 请记住,该指标是长期交易者的有价值工具。遵循推荐的指南,并将其适应到您的交易风格中。 如有任何问题或需要支持,请联系作者。 请注意,该指标是技术分析工具,不能保证盈利。 在使用任何指标或交易策略时,进行全面的市场分析并适当管理风险至关重要。 选择通过电子邮件直接从卖

TMA - 三角形移动平均指标 TMA - 三角形移动平均指标是交易者分析和识别金融市场趋势的强大工具。 该指标智能地计算三角形移动平均值,为市场方向提供有价值的洞察。 主要特点: 适用于较长时间框架:建议在D1/W1/MN以上的周期使用,提供对长期趋势的全面视图。 通用性:适用于所有货币对,在各种交易情境中提供灵活性和实用性。 精确计算:基于高级的三角形移动平均计算,该指标有助于识别市场潜在的进出点。 这个指标是寻求强大技术分析并旨在提高其交易策略的交易者的不可或缺的工具。 有关更多信息和技术支持,请通过电子邮件联系。 注意:这是MetaTrader交易平台的一个指标。 立即获取TMA - 三角形移动平均指标,将您的市场分析提升到新的高度! 选择通过电子邮件直接从卖家那里获取材料,并充分利用该指标提供的长期交易机会!

Fnix Ma 有色。 这是一个定制的指标,旨在帮助交易员识别金融市场中的趋势。 MA - Master Trend Position Trade 是一个计算和显示移动平均线的工具,以帮助分析资产趋势。 主要特点: 计算移动平均线以识别趋势。 建议在D1/W1/MN(日线/周线/月线)以上的时间框架上使用。 建议使用挂单进行分析。 与所有货币对兼容。 附加细节: 简单直观的可视化界面。 可调整的指标,具有可配置的参数。 使用说明: 在您的技术分析平台上安装该指标。 将其应用于财务资产图表以可视化计算的趋势。 支持和联系: 如有疑问或需要技术帮助,请通过电子邮件联系。 注意:这是一个定制指标,不能替代投资分析和策略。 建议在实盘交易之前在模拟账户上进行测试。

Exclusive Limited Time Offer! Grab this useful indicator for a lifetime at just $49. Enhance your trading experience with this amazing Metatrader indicator that tracks your live trade status. The indicator displays live take profit, stop loss & trailed stop loss, or trailed profit value with the best dashboard with account balance alert. Indicator Features:
Trade Details The indicator shows the last 5 active trades data in chronological order. Don't miss this opportunity to get your copy today
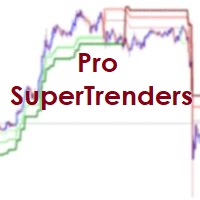
Dear traders! This indicator automatically plots SuperTrends across 3 timeframes. SuperTrend is a trend following indicator. However, it is not much useful on single timeframe, as that gives many whipsaws. Professionals analysis across multi timeframes before taking trades. This adds confluence to trade setups.For the same purpose, Pro SuperTrends shows trend (or absence of trend) on 3 timeframes. Our trading odds improve, when positions are aligned with higher timeframes. Further, SuperTren

The Book of Changes is a product of ancient civilization and a philosophical work that highly integrates natural and social sciences in China. The Book of Changes believes that all things in heaven and earth are constantly developing, and it explains the laws of nature. This law reveals the characteristics of the entire universe, covering the attributes of all things in heaven and earth. The Book of Changes is the crystallization of the wisdom of the Chinese nation. It is the crystallization of
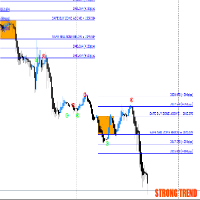
Introducing Breakout scalper system(BSS), an innovative and robust trading solution designed to elevate your trading experience to new heights. This sophisticated MetaTrader 4 compatible system is meticulously crafted to empower traders with precise buy and sell levels, strategic targets, and timely signals, all delivered with utmost accuracy and efficiency. Key Features: Buy and Sell Levels: Gain a competitive edge with carefully calculated buy and sell levels, providing you with clear entry an

The GGP Trendlines with Breaks Alert MT4 Indicator is a technical analysis tool that can assist investors in identifying market trends. The indicator returns pivot point based trendlines with highlighted breakouts. Users can control the steepness of the trendlines as well as their slope calculation method. This indicator is MT4 conversion of the Trendlines with Breaks Indicator by “ LuxAlgo “ in Trading View website and some alert methods are added to provide real-time alerts when a trading sign
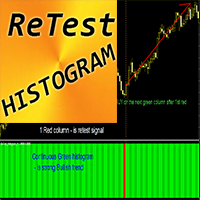
MT4 外汇指标“重新测试直方图”
ReTest_Histogram 指标可用于在重新测试强 S/R 水平后搜索进入主要趋势方向的入场信号 重新测试直方图有 2 种颜色:红色表示看跌趋势,绿色表示看涨趋势。 一旦您看到相同颜色的稳定连续直方图列,则意味着新趋势发生 重新测试信号是直方图中具有相反颜色的 1 列,下一列具有趋势颜色(参见图片) 指示器内置移动和 PC 警报
如何使用指标: - 对于买入信号:稳定连续的绿色柱状图(上升趋势)+柱状图上的 1 个红色柱(重新测试)+1 个绿色柱(在此处打开多头交易) - 对于卖出信号:稳定连续的红色柱状图(下降趋势)+柱状图上的 1 个绿色柱(重新测试)+1 个红色柱(在此处打开空头交易)
// 这里提供更多优秀的 EA 交易和指标: https://www.mql5.com/en/users/def1380/seller // 也欢迎您加入盈利、稳定、可靠的信号 https://www.mql5.com/en/signals/1887493 它是仅在该 MQL5 网站上提供的原创产品。

RockTrader is an indicator that identifies market direction across chosen currency pairs and generates line signals for potential buy and sell opportunities within the selected timeframe. Its straightforward design makes it highly regarded and easily comprehensible for traders at basic and intermediate levels. The visual representation on the chart also enables users to conduct pure price action analysis. RockTrader is versatile, functioning across various financial assets, and boasts over an 85
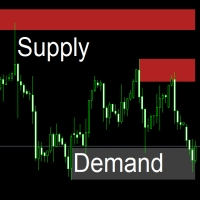
The indicator draws supply and demand zones. The zone timeframe can be set independently of the chart timeframe. For instance, it is possible to set M5 zones on an H4 chart. The importance of zones can be adjusted using the zone strength parameter. Demand zones are displayed if at least one candle in the range of the zone is entirely above the zone. Similarly, supply zones are displayed if at least one candle within the zone is entirely below the zone.

Key Features A key concept of technical analysis is that when a resistance or support level is broken, its role is reversed. If the price falls below a support level, that level will become resistant. If the price rises above a resistance level, it will often become support.
Horizontal support and resistance levels are the most basic type of these levels. They're simply identified by a horizontal line: Green Level in the chart, is Resistance Level. Red Level in the chart, is a Support Level.

The FX_ride custom indicator assists traders in recognizing market trends across preferred currency pairs and provides signals based on trend strength via a multi-colored histogram within chosen timeframes. It is particularly suited for day trading, swing trading, and position trading. Following signals from FX_ride in conjunction with employing sound money management practices can enhance the likelihood of profitable trading outcomes.
MetaTrader 市场 - 在您的交易程序端可以直接使用为交易者提供的自动交易和技术指标。
MQL5.community 支付系统 提供给MQL5.com 网站所有已注册用户用于MetaTrade服务方面的事务。您可以使用WebMoney,PayPal 或银行卡进行存取款。
您错过了交易机会:
- 免费交易应用程序
- 8,000+信号可供复制
- 探索金融市场的经济新闻
注册
登录