Conheça o Mercado MQL5 no YouTube, assista aos vídeos tutoriais
Como comprar um robô de negociação ou indicador?
Execute seu EA na
hospedagem virtual
hospedagem virtual
Teste indicadores/robôs de negociação antes de comprá-los
Quer ganhar dinheiro no Mercado?
Como apresentar um produto para o consumidor final?
Pagamento de Indicadores Técnicos para MetaTrader 5 - 10

Xtreme TrendLine is an advanced powerful trend indicator. This indicator is based on candles analysis and trend channels. It can be used on any trading pair or instrument on any time-frame. This indicator is accessible in EA via iCustom functions and is fully customizable by user.
Features Any trading instrument Any timeframe Fully customizable by user More Trendlines on one chart Can be used in EA via iCustom function Can be use on more timeframe at once to catch best moment for the trade ent

Traders Dynamic Index (TDI) MetaTrader indicator — a comprehensive but helpful indicator that uses RSI (Relative Strength Index), its moving averages, and volatility bands (based on Bollinger Bands) to offer traders a full picture of the current Forex market situation. Here is single timeframe product. Once puscharse this indicator, you free to use MTF scanner (free at here ) The Traders Dynamic index TDI indicator is the next generation of the popular Trader Dynamic index indicator dev

O indicador Vwap Bands Auto busca mapear automaticamente a frequência máxima do mercado ( atualização automática da banda mais externa ) e possui duas bandas intermedíarias que também se ajustam à volatilidade diária.
Mais uma ferramenta da White Trader que combina preço e volume, além de mapear a amplitude diária.
A banda externa é atualizada automaticamente quando a máxima ou mínima diária rompe a frequência atual, e pode ser um sinal de entrada, buscando o retorno à vwap diária.
De

"2nd To NoneFX Scalper" is one powerful indicator which you can use on any timeframe. The accuracy is in between 90% - 95% can be more. The indicator is 100% non repaint so it doesn't repaint at all. When the arrow comes out wait for the candlestick to close the arrow won't repaint/recalculate or move. The indicator works with all volatility indices,step index, Boom & Crash(500 & 1000) and all currency pairs. You can change settings of the indicator. For great results find the trend of the pair,

I do not have the exact indicator for MT4 but the nearest possible look alike can be downloaded from here . Also you may check this link . This is the exact conversion from TradingView: "Donchian Trend Ribbon" By "LonesomeTheBlue". One of the coolest indicators out there to detect trend direction and strength. As a trader you always need such indicator to avoid getting chopped in range markets. There are ten buffers as colors to use in EAs also. The indicator is loaded light and non-repaint. Not

Mean Reversal Heikin Ashi Indicator calculates special trade reversal points based on Heikin Ashi candlesticks patterns. This indicator can be used on all symbols, even in Forex or B3 Brazillian Markets. You can configure just the position of each arrow. Then, after include the indicator on the graphic, pay attention on each arrow that indicates a long or short trade.

To get access to MT4 version please click here . - This is the exact conversion from TradingView: "CM Super Guppy" by "FritzMurphy" - This is a light-load processing indicator. - This is a non-repaint indicator. - This is not a multi time frame indicator. - Buffers are available for the lines on chart. - You can message in private chat for further changes you need. Thanks for downloading

To get access to MT4 version please click here . - This is the exact conversion from TradingView: "Twin Range Filter" by " colinmck ". - This is a light-load processing and non-repaint indicator. - All input options are available. - Buffers are available for processing in EAs. - You can message in private chat for further changes you need. Thanks for downloading

To get access to MT4 version please click here . This is the exact conversion from TradingView: QQE MT4 Glaz-modified by JustUncleL This is a light-load processing and non-repaint indicator. All input options are available. This is not a multi time frame indicator. Buffers are available for processing in EAs. You can message in private chat for further changes you need.

To get access to MT4 version please click here . Also you can check this link . This is the exact conversion from TradingView: "UT Bot" by "Yo_adriiiiaan". This is a light-load processing indicator. This is a non-repaint indicator. Buffers are available for processing in EAs. All input fields are available. You can message in private chat for further changes you need. Thanks for downloading

This indicator helps you identify support and resistance levels. Also it adds break points when level is broken. Price sometimes goes back to break point. It has 4 technical parameters and 4 buffers for expert advisors. Buffer indexes: 0 - Resistance, 1 - Support, 2 - Resistance break point, 3 - Support break point". Number of Levels: Determines how many levels are on graph ( if 3 - 3 levels of support and 3 levels of resistance) Tolerance in percentage %: This parameter is used to filter out

You can think of these indicators as moving pivot points. MasterChartsTrading Price Action Indicators show good price levels to enter or exit a trade. The Blue indicator line serves as a Bullish Trend setter. If your instrument closes above the Blue line, we think about going Long (buying). When your trading instrument closes below the Red line, we think about Shorting (selling). It is very easy to read price action if you have a reference point. These support/resistance lines are there to help

Symbol Changer this Indicator for make more easy when change Chart pair, this more usefull if trader make deal with many pair.
Property Input Indicator Custom Unique ID : Indicator have Id for make different. Show Profit Loss : Adjustable for Show or no Profit and Loss Option Horizontal/Vertical button : Button can change Horizontal or Vertical. Option Window : Adjustable in main Chart as window or buttom chart as Window 1, 2 Main Pairs Preset / Own Pair : available group pair for make easy ha

Think of the rarest pair you can think of. And I assure you that this indicator can compute it is strength. This Currency Meter will literally calculate any currency pairs, either it is a major pair, metal, CFD, commodity, cryptocurrency like Bitcoin/BTC or Ethereum/ETH and even stocks. Just name it and you will get it! There is no currency pair this Currency Meter cannot solve. No matter how rare or exotic is that currency, it will always be solved by this Currency meter on a real-time basis. S

Esta ferramenta foi desenvolvida para ajudar os traders nos treinos candle a candle e em modo replay. Nas configurações do indicador, o usuário escolhe a data inicial do treino e o indicador irá esconder automaticamente todos os candles após esta data. Dessa forma, o usuário poderá fazer estudos no gráfico antes de iniciar o treino. Iniciando o treino, o usuário poderá então simular os seus trades com muita rapidez e facilidade!
Este é mais um produto desenvolvido por Renato Fiche Junior e di

O indicador de preço médio ponderado por volume é um indicador de estudo de linha que aparece na janela do gráfico principal do MT5. O indicador monitora o preço típico e, em seguida, o volume de negociação usado para empurrar automaticamente a linha do indicador em direção a preços fortemente negociados. Esses preços são onde a maioria dos contratos (ou lotes) foram negociados. Em seguida, esses preços ponderados são calculados em um período de retrospectiva e o indicador mostra o estudo de lin

Are You Tired Of Getting Hunted By Spikes And Whipsaws?
Don't become a victim of the market's erratic moves.. Do Something About It!
Instantly make smarter decisions with Impulse Pro's precise balance of filters and accurate statistics.
Timing Is Everything In Trading
To learn more, please visit www.mql5.com/en/blogs/post/718212 Anticipate the next big move before it unfolds in 3 Simple Steps!
Advantages You Get
Early impulse detection algorithm.
Flexible combination to different tr

Introducing "Congestion Breakout MT5" - the indicator that helps you identify congestion zones in your chart and alerts you when the price breaks through them. Traders know that congestion zones can be key areas of price action and can indicate potential turning points in the market. However, spotting these zones and anticipating breakouts can be a difficult and time-consuming task. That's where "Congestion Breakout" comes in. This powerful indicator uses advanced algorithms to analyze the pri
Introduction to the Magic TD Sequential 9
The "Magic TD 9" is a technical analysis tool for stocks. It is based on historical price data and divides prices into nine levels based on a certain magnitude. It then calculates the average price of each level and constructs a sequence of nine data points. This sequence is called the "Magic TD 9," with the first data point representing the stock's lowest price and the ninth data point representing the highest price.
Index inputs:
1 Turns: repr

Contact me after payment to send you the user manual PDF file. Download the MT4 version here. Unlocking Trading Insights Dive into the heart of market dynamics with Advance Divergence Scanner designed for traders seeking a competitive edge. The Divergence Indicator is your key to identifying crucial divergences across various charts, empowering you to make informed decisions in the dynamic world of financial markets. The Divergence A Divergence signals a potential reversal point because directi

Este indicador permite-lhe desfrutar os dois produtos mais populares para analisar volumes de ofertas e das negociações no mercado a um preço favorável: Actual Depth of Market Chart Actual Tick Footprint Volume Chart Este produto combina o poder de ambos os indicadores e é fornecido como um único arquivo.
Venda Anti-crise. Hoje com menor preço. Anda logo! A funcionalidade do COMBO Actual Depth of Market e Tick Volume Chart é totalmente idêntica aos indicadores originais. Você vai aproveitar o p

Gann 9+ Indicator Introduction The "Gann Matrix Chart" is the most simple and clear technical analysis in Gann theory, which is the calculation tool that Gann has always been committed to using. It is the essence of Gann's whole life. The Gann 9+ indicator uses the matrix chart to find the future high or low points of stocks or futures. Indicator Input: The base and step size can be set as 1 by default; When the multiple is -1, the multiple will be automatically obtained, or it can be filled in
Automatically scans the chart to find Harmonic Patterns, and give you the chance to enter early in good operations. Also if selected, it will alert you in advance when future patterns appears, showing you a projection of a posible future pattern. The main goal for this algorithm is to determine with high precision the moment when a trend ends and a new one begins. Giving you the best price within a reversal. We have added the "Golden Trade", we define it as the perfect order: For those ord

There is a very simple rule
It is Always difficult to cross high pressure areas and easy to cross low pressure areas
MT4 version is available here
This is definitely true for price
It was so simple, it was not!
So let's get started
This indicator shows you the amount of pressure in that area according to the bars that it shows. The longer the bar, the higher the pressure in that area It also marks the most pressed area with a rectangle
From now on you can simply decide on the

The indicator is designed to close positions on the market in time. For example: to take profits ahead of schedule if the price has not reached TakeProfit, and the market is turning around. The indicator analyzes the momentum, not the trend. He does not give any information about the trend. The indicator is well suited for finding divergence. The Ershov 38 Parrots indicator dynamically adjusts to the market and detects price movement impulses of medium and high amplitude. It almost does not rea

Indicador que faz a catalogação automática de estratégias probabilísticas como a MHI para Opções Binárias.
Incluindo:
*Catalogações: MHI 1, 2 e 3, MHI potencializada, Variação de M5, Five Flip, Padrão do Milhão, Três Vizinhos, C3 e Turn Over.
*Análise por intervalo de horário, data, e dias da semana.
*Função que traz resultados de outros pares na sua catalogação!
*Análise apenas seguindo a tendência e/ou mercado lateral.
*Filtro de análise de entradas somente após hit.
*Alerta (

The True Oversold Overbought indicator provides you with ability to swiftly check whether the asset is oversold or overbought. Other than complementing your trading with True Oversold Overbought, you can use the indicator as your only trading system. It works with all forex instruments and will save you the headache of estimating when the market is due for a reversal or retracement. When the "Super Charge" feature is enabled, the areas where the price is in oversold/overbought status are ampli

O indicador VSA Smart Money rastreia a movimentação dos traders profissionais, Trades institucionais e todos os movimentos do homem composto.
O Indicador VSA Smart money faz leitura barra por barra, sendo uma excelente ferramenta para quem usa as análises de VSA, Wyckoff, PVA e Qualquer outra que utilize preço e volume.
São 10 indicações que você vai encontrar no seu Gráfico:
*No Demand *Climax *UT Thrust *Top Reversal bar *Stop Volume *No Supply *Spring *Bottom Reversal *Shakeout *Bag Ho

Analise rapidamente a estrutura do mercado com esta ferramenta e tire partido dos níveis de preços importantes.
Estrutura do mercado Este indicador personalizado traça os níveis de preços importantes, que podem ser utilizados como pontos de entrada ou objectivos de lucro.
Identificar o seu intervalo de negociação Faça scalping com este indicador respeitando os pontos de viragem do mercado.
Oportunidades de negociação de breakout Utilize este indicador para detetar oportunidades de b

Aqui temos o Start Midas Fibo Bands , confesso que é um indicador que t em me animado bastante para operar por eu ter conseguido encontrar regras mais definidas. Bem, o indicador conta com as funcionalidades dos demais indicadores da linha start que é a possibilidade de plotar diversas Midas na tela, pode movimentar o ponto de ancoragem utilizando atalhos de teclado e usar a legenda para diferenciar uma ancoragem de outra. As regras que tenho analisado para meu possível setup se referem à critér

Alpha Trend MT5 is a trend indicator for the MetaTrader 5 platform; it has been developed by a group of professional traders. The Alpha Trend MT5 indicator finds the most probable tendency reversal points, which allows making trades at the very beginning of a trend. This indicator features notifications, which are generated whenever a new signal appears (alert, email, push-notification). This allows you to open a position in a timely manner. Alpha Trend does not redraw, which makes it possible t

Hi there! Since I am starting commercial and non-commercial product publishing I would highly appreciate: If you like this product, please rate it. That will help to promote not only this product, but indirectly another ones. So, such promotion will help to make some money from commercial products. Thus, I will have opportunity to fund my another directions of trading researches like bot development using mql4 and mql5 programming languages as well as python written products like crypto bots. If

The indicator ‘Probability Range Bands’ gives a prediction of the amount, how much the asset is moving from its current price. The range bands give probabilities, that the candle close will not exceed this certain price level. It is also called the expected move for the current candle close. This Indicator is based on statistical methods, probabilities and volatility. Asset price is assumed to follow a log-normal distribution. Therefore, log returns are used in this indicator to determine the

Volality 75 Fractal Scalper Non-repaint The arrows appear on the current candle. momentum and trend based strategy Works on all timeframes from the 1 Minute to the Monthly timeframe Bollinger bands have been added to show the trend direction whether its bullish or bearish Blue fractal arrow is your buy entry Orange fractal arrow is your sell entry you can use the Vix 75 fractal scalper in combination with other indicators.

Here is the boom and crash crazy Ma scalper a secretly coded color MA that is 1000% NON-REPAINT Works best on boom and crash 1000 Can be used on all timeframes from the 1 Minute timeframe to the Monthly timeframe The indicator is also a multi-time frame indicator you can select which timeframe to use The indicator is made for scalping purposes. as the trend changes the color of the indicator changes all well

Boom and Crash Buy and Sell Trend. Non-repaint. Can be used on all timeframes 1 minute for scalpers. 5 minute to monthly timeframe for swing trading. works on all boom and crash pairs Crash300, Crash500, Crash1000. Boom300, Boom500, Boom1000. Green histogram colour means the trend is up(bullish) Buy signal. Dark orange histogram colour means the trend is down(bearish) Sell signal.

BestPointOfInitiation是一个很好的短线交易指示器,能与 ShortBS ( https://www.mql5.com/zh/market/product/96796 )完美的配合,可以很好的指出最佳的buy和sell位置,指标不含有未来函数,不会重新绘制,不仅能够应用到自己的手动交易过程中,还能完全可以写入到自己的EA中。(如果你感觉到这个指标能够帮助你进行更准确的交易,请帮忙给个好评,希望我的作品能够帮助更多多有需要的人) ===================参数列表===================== fastPeriod: 9 slowPeriod:30 PassivationCoefficient:5 =================参考使用方法=================== 此指标可以适用于任何交易品种,能够用在任何周期。

This product is converted form Trading View of Kivanc Ozbilgic to be used on MT5 and below are descriptions of developer on Trading View:
Anıl Özekşi's latest development on his precious OTT - Optimized Trend Tracker:
In this version, there are two lines of OTT which are derived from HIGHEST price values (HOTT) and LOVEST price values (LOTT) which were originally sourced to CLOSE values on default OTT.
Another significant difference is there is no Support Line (Moving Average) in this ver

This indicator is converted from UT Bot alerts indicator by @QuantNomad of Trading View to MT5. its considering ATR and creating new candles on chart and also is giving good entry points based on its candles. all buffers of new candles and also entry signals are included as buffer so can be used easily on any EA. there are also some different strategies on the internet that can be used or contact me to create it for you.

Ticks Candles Chart indicator build equi-volume candles and designed for Oracle Strategy The Period in ticks is set directly on the chart Tick chart opens in a separate window Recommended to use tick periods from 50 and above Works on real time only
Input Parameters Ticks_In_Bar - default period in ticks Counting_Bars - how many tick bars of history to build Custom_Symbol_Suffix - additional suffix for symbols

1. Why did I develop this series of indicators
I found that most traders need to use multiple time frame indicators. They usually switch time frame to see indicators. However, once the timeframe is switched, you cannot see the corresponding relationship between the price in the smaller timeframe and the indicator in the larger timeframe . For example: if your price chart is in H1 timeframe, you can see H4, D1 and W1 indicators in H1 timeframe Chart. This is more helpful for you to find t

How to use Pair Trading Station Pair Trading Station is recommended for H1 time frame and you can use it for any currency pairs. To generate buy and sell signal, follow few steps below to apply Pair Trading Station to your MetaTrader terminal. When you load Pair Trading Station on your chart, Pair Trading station will assess available historical data in your MetaTrader platforms for each currency pair. On your chart, the amount of historical data available will be displayed for each currency pai
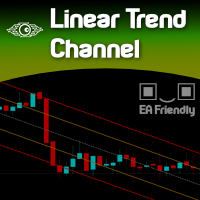
Imagine a way to automatically and clearly recognize the direction of the current market. Uptrend or Downtrend?
Forget about moving averages, there is a simple way to determine that. Welcome to the world of statistics. Welcome to the simple yet powerful world of Linear Regression. Just a complicated name for a genius and simple measurement.
Calibrating this indicator is pretty clear and obvious since the degree of freedom is total and deep.
Once calibrated to your desired Symbol/Asset,

The Breaker Blocks with Signals indicator aims to highlight a complete methodology based on breaker blocks. Breakout signals between the price and breaker blocks are highlighted and premium/discount swing levels are included to provide potential take profit/stop loss levels.
This script also includes alerts for each signal highlighted.
SETTINGS
Breaker Blocks
Length: Sensitivity of the detected swings used to construct breaker blocks. Higher values will return longer te

Indicador projetado para levar aos investidores a vantagem de identificar fortes padrões de candles em tempo real, através da coloração dos candles que representam estes padrões, tornando possível atuar na compra ou venda. A cor para cada padrão identificado pelo indicador por ser parametrizada, de acordo com seu gosto.
Os Padrões de Candle identificados por este indicador são: Inside Bar Preço de Fechamento de Reversão de Alta ou Closing Price Reverse Top (PFRA)
Preço de Fechamento de Revers

This indicator displays the wave structure of the market in the form several wave levels nested in each other. For each of these levels an automatic preliminary (draft) marking of waves in Elliott's style (123..., ABC... etc.) is created. This markup is completely automatic and absolutely univocal. The indicator is especially useful for beginner wave analysts, because among all the possible versions for wave marking, it allows you to immediately take the most adequate version as a ba

This is the Full Version, to get the free version please contact me.
The free version works on “AUDNZD” and “XAUUSD” charts.
All symbols and time frames scanner
Head and Shoulder
One of the most popular Price Action patterns is the Head and Shoulders pattern. The pattern has three local tops that resemble the left shoulder, head, and right shoulder. The head and shoulders chart pattern appears in all kinds of markets, including Forex, cryptocurrency, commodities, stocks, and bonds. The

This is the Full Version, to get the free version please contact me. The free version works on “GBPCHF” charts. All symbols and time frames scanner. Harmonic Pattern
Harmonic patterns are used in technical analysis that traders use to find trend reversals. They are considered one of the most accurate technical analysis tools, as they allow traders to predict the future price movement direction and the potential trend targets. Also, unlike many other technical tools, the number of false signal

tO indicador é destinado ao reconhecimento e marcação dos padrões 1-2-3 comprar e vende de um gráfico. O indicador vai ajudar um negócio para determinar o início e o sinal de fractais, e especificar os possíveis pontos de entrada em todos os tempos do МetaTrader 5. Linhas de Fibonacci são desenhados no gráfico para indicar supostos alvos de movimento sobre a base da teoria ondulatória. As formações 1-2-3 parecem ser especialmente importante como as divergências (convergências) são formados em to
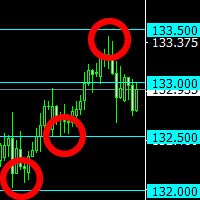
The indicator plots "round" levels, the step of which is specified in the settings. Perfect as an addition to any trading systems.
Very low price - only $30! Round levels often become price support or resistance. MT4 version: https://www.mql5.com/en/market/product/67245
This allows you to either fix a profit, or open a position after a breakdown of the level, work towards a rebound in price. Support: https://www.mql5.com/en/channels/TrendHunter The indicator will be an excellent tool in a

Session Volume Profile is an advanced graphical representation that displays trading activity during Forex trading sessions at specified price levels. The Forex market can be divided into four main trading sessions: the Australian session, the Asian session, the European session and the favorite trading time - the American (US) session. POC - profile can be used as a support and resistance level for intraday trading.
VWAP - Volume Weighted Average Price.
ATTENTION ! For the indicator to

A ferramenta profissional de traders de ações agora disponível no MetaTrader 5 . O indicador Actual depth of market chart visualiza a profundidade de mercado sob a forma de um histograma apresentada no gráfico, que atualiza em tempo real. Conheça as novas atualizações de acordo com as solicitações do usuário!
Agora, o indicador Now Actual Depth of Market mostra a relação atual do volume de compra e venda de ordens (razão B/S). Ela mostra a percentagem de volume de cada tipo de pedidos em todo

RUBFX Trend histo mt5 , indicator works on synthetic indices, Currencies , Indices ,Stocks Gold etc , good for follwoing trend on the markets suitable for scalping Buy Rules; When the histo changes to Blue you place buy order ,stop loss just below the previous swing low Sell Rules; When the histo changes to Red you place sell order ,stop loss just below the previous swing high Trade on a timeframe which best suits your trading style

BeST_Trend Exploiter is a Metatrader Indicator based on a smart proprietary algorithm which can detect the market Median Trend while it filters out the noise providing Buy and Sell Signals and also wherever it is applicable it provides us with TP Levels of High Probability. Additionally as it has Built Inside all the necessary features it can be used as a Complete Strategy of very Impressive Results. Essential Advantages of the Indicator
Clear and Easily Understandable trading rules. Real

This is a multi-timeframe indicator that detects and displays support and resistance (S&R) lines using the ZigZag indicator.
Features
The support and resistance lines are not redrawing. The indicator is capable of adding new support and resistance levels as they appear. Each S&R line has a tooltip that displays the price level and start time. Shows the start time, price level and number of touches of all S&R lines when pressing the shortcut Shift+I Save time for multi-timeframe analysis on

É desafiador capturar rompimento com forte momento. O propósito do Super Breakouts Monitor é identificar tais condições de mercado. Este indicador foi inspirado em um conceito do renomado Analista Técnico Tushar Chande, que combina dois indicadores altamente adaptativos, VIDYA e o Índice de Momento Dinâmico (ambos suas criações), para capturar as fases iniciais de um rompimento de sucesso. Na Minions Labs, adicionamos nossos próprios aprimoramentos para adaptar essas ótimas ideias para mercados

i-Orders is a simple indicator to monitor your own trade/analyze others' trades. I use it for a long time and do not imagine a chart without these arrows, lines and trade result numbers. The features allow you to: change the size and location of the control buttons ( Control buttons size , Control buttons corner ), disable display of opened and closed positions ( Show OPENED , Show CLOSED , Show PENDING ), change colors of arrows and lines for profitable and unprofitable buy and sell positions s
Linear regression AI powered Indicator: Linear regression is a simple yet effective AI technique that is the foundation of complex neural networks, This indicator is built based on linear regression analysis and tries to make predictions on the upcoming event in the market Inputs : train_bars: This controls the number of bars that the price information will be collected and used to train the AI inside it, The greater this value the better also the slower the indicator becomes during initializati

DETECT THE TREND AND THE BEST PRICE TO ENTER A TRADE
Trend Detection for perfect entry - Distinguish the direction of the trend and its strength , showing a line of different colors depending on whether the trend is strong bullish, weak bullish, strong bearish or weak bearish.- Best Entry point for perfect entry - Shows an area with the best entry in favor of trend. Never trade against the trend again.
Entry signals and alerts - When the price is in a valid zone, it sends pop up alerts, tel

This indicator draws price channels. Easy to use. It has various settings, for example, you can configure it to show channels only for buy or sell, you can display trend lines instead of channels. There are many trading strategies that are based on trading in channels, you can trade on the rebound from the borders of the channels, or the breakdown of the channel. Parameters History - the maximum number of bars for building channels; Distance - the minimum distance from one maximum (or minimum

O Heikin Ashi Delta PRO aproveita a refinada elegância dos candlesticks Heikin Ashi, conhecidos por sua capacidade de filtrar ruídos do mercado e destacar tendências e reversões mais claras. Construído sobre uma base sólida, este indicador avançado integra o método da Média Móvel de Hull, aprimorando sua precisão e responsividade. Junto com um sistema de alerta intuitivo, ele transforma os dados brutos do mercado em insights comerciais acionáveis, capacitando os traders a tomar decisões mais inf

This is HTF (or MTF) of original Kolier SuperTrend indicator. On this version, you can use 4 Lines of supertrend to define the trend, it will be more powerful. Remade signals on smalls timeframes, the indicator will not repaint if used on small timeframes.

Weiss Wave com muitas funcionalidade e extremamente leve. O mesmo pode ser usado tanto no mercado brasileiro quanto no mercado exterior!
Voce poderá: - Analisar o volume do mercado pelos swings realizados! - Definir a fonte dos dados apresentados no grafico, seu tamanho e cor! Ou simplesmente oculta essa informação!
- Definir se quer mostrar ou não os swings no grafico e quantos swings! Alem de definir a cor da linha de tendencia, espessura e estilo da linha de tendencia! - Defini

Diversas técnicas utilizam o volume como ponto importante no trade. Seja para indicar força, exaustão, fraqueza do pullback, entre outros.
Em principal eu cito a teoria de Richard Wyckoff, que dizia sobre a importância de olhar preço e volume.
Entretanto, são diversas as possibilidades de filtrar o que é volume que deve ser notado.
Os usuários de PVRSA / PVA utilizam um indicador com cores específicas, que auxiliam na identificação do volume e do tipo de movimento que o preço fez.
Se
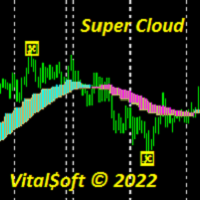
The Super Cloud indicator helps to determine the direction of the trend when trading. Shows on the chart signals about a possible upcoming trend change. The indicator provides an opportunity to detect various features and patterns in price dynamics that are invisible to the naked eye. Based on this information, traders can anticipate further price movement and adjust their strategy accordingly. Works on all timeframes except MN.

Você gosta de operar Análise Técnica, assim como eu? Então você vai gostar deste indicador, pois ele calcula de forma automática os suportes e resistências do ativo em tempos gráficos simultâneos, ou o famoso MTF (Multi Time Frame). Além dos suportes e resistências é possível ter sinais de alerta quando o preço rompe ou toca (ou os dois). Sua configuração é bem simples. O visual é totalmente configurável. Faça bom uso!
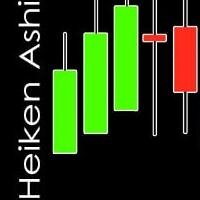
Heiken World is a heikin ashi candlestick strategy, to facilitate the view of the chart and capture trends for all types of pairs, it works perfectly in synthetic indices as well as forex! The strategy consists of taking out the common candles and placing only the Heiken World ones, plus adding some other channel like the Critical Channel since it facilitates where the market is going to bounce and to be able to facilitate the profit, it works for any type of temporality!
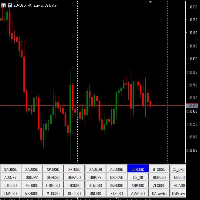
"Symbol Changer" is an indicator created for the Metatrader 5 (MT5) platform, providing the ability to change symbols. To perform all operations with this indicator, use the following characteristics:
Characteristics: Installation: To install the indicator on the MT5 platform, place your .mq5 code in the Indicators folder and restart MT5. Visualization: On the chart, the "Symbol Changer" indicator places special buttons to change symbols. Initial Settings: There are no additional settings for

The best quality application of the famous Super Trend indicator that requires no introduction. It is completely faithful to the original algorithm and powered by the CCI indicator.
- easy to trade - It implements all kinds of warnings. - It implements a multi-timezone dashboard. - It cannot be repainted or backpainted.
Input parameters - ATR Period – This is the average true range period. - ATR Multiplier - The ATR multiplier that defines the trend. - CCI - Makes trend following powerful. -
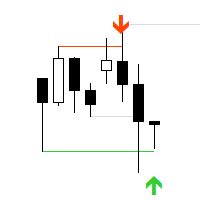
"AV Stop Hunter MT5" is an indicator for MetaTrader 5, which draws entry arrows for long and short after so-called Stop Hunt candles and has several notifications about them. Since this is a smart money concept , the periods H1 and H4 are the best. Increasing volume improves the signal, lines and arrows are then thicker. The MQL5 variant has colored stop-hunting candles. NEW: Signal Buffer: 1, 0 or -1
Definition :
Stop hunting, also known as stop running, is the practice of institutional
O Mercado MetaTrader oferece um local conveniente e seguro para comprar aplicativos para a plataforma MetaTrader. Faça download de versões de demonstração gratuitas de Expert Advisors e indicadores a partir do seu terminal para testes no Testador de Estratégia.
Teste os aplicativos em diferentes modos para monitoramento do desempenho e assim fazer um pagamento para o produto que você deseja, usando o sistema de pagamento MQL5.community.
Você está perdendo oportunidades de negociação:
- Aplicativos de negociação gratuitos
- 8 000+ sinais para cópia
- Notícias econômicas para análise dos mercados financeiros
Registro
Login
Se você não tem uma conta, por favor registre-se
Para login e uso do site MQL5.com, você deve ativar o uso de cookies.
Ative esta opção no seu navegador, caso contrário você não poderá fazer login.