Conheça o Mercado MQL5 no YouTube, assista aos vídeos tutoriais
Como comprar um robô de negociação ou indicador?
Execute seu EA na
hospedagem virtual
hospedagem virtual
Teste indicadores/robôs de negociação antes de comprá-los
Quer ganhar dinheiro no Mercado?
Como apresentar um produto para o consumidor final?
Pagamento de Indicadores Técnicos para MetaTrader 5 - 8

** All Symbols x All Timeframes scan just by pressing scanner button ** *** Contact me after the purchase to send you instructions and add you in "Channel Scanner group" for sharing or seeing experiences with other users. Introduction: The Channel pattern is described as the area located between two trend lines. This area is used for a measure of a trading range. In this case, the upper trend line connects price highs while the lower trend line connects price lows. Also when it comes to

Delta Aggression Volume PRO é um Indicador desenvolvido para acompanhar a força e continuidade do volume das agressões de venda e de compra. Nota : Ele só funciona com corretoras e/ou mercados que informam o tipo de agressão de cada negociação , ou seja, informando se foi uma agressão de venda ou de compra . Criptomoedas e Forex não fornecem este tipo de dado, ou seja, não funciona com eles .
O Delta Agrression Volume PRO possui recursos que possibilitam visualiza

Multi-currency, multi-timeframe, harmonic pattern indicator AB = CD. Supports sending push notifications about signals to a mobile device, messages on e-mail, as well as messages using alerts on all available currency pairs and timeframes. This indicator was based on the indicator Harmonic ABCD Universal. Version for MetaTrader 5: https://www.mql5.com/en/market/product/44972 . See also: Harmonic ABCD Universal for MetaTrader 4 . Using modern software development methods has made the indicator a

This indicator searches for candlestick patterns. Its operation principle is based on Candlestick Charting Explained: Timeless Techniques for Trading Stocks and Futures by Gregory L. Morris. If a pattern is detected, the indicator displays a message at a bar closure. If you trade using the MetaTrader 4 terminal, then you can download the full analogue of the " Candle Pattern Finder for MT4 " indicator
It recognizes the following patterns: Bullish/Bearish (possible settings in brackets) : Hamme

A must-have tool for any strategy based on divergence detection. 10 different oscillators can be used to detect divergences and can be combined with Double Top/Bottom patterns to confirm reversal signals. SCANNER is included . Now with Scanner you can find trading opportunities and setups easily and faster.
Features Easily detect strong reversal signals. 10 different oscillators are available for divergence detection. Divergence & Top/Bottom detection can operate independently or combined. Get

This incicator shows you when a pin bar is formed, and aid you perform a inversion strategy or a trend continuation based on resistence support and or channel. Typically a pin bar shows you a price rejection from the market and the signal most of time is profitable. So i suggest to use buy/sell limit order over ratrace SL little bit over or below bar and take profit based on your strategy and money management.
Best timeframe are D H4 H1

To download MT4 version please click here . This is the exact conversion from TradingView: "B-Xtrender" By "QuantTherapy". - It is an oscillator based on RSI and multiple layers of moving averages. - It is a two in one indicator to calculate overbought and oversold zones for different RSI settings. - This indicator lets you read the buffers for all data on the window. - This is a non-repaint and light processing load indicator. - You can message in private chat for further changes you need.

For MT4 version please send private message. - This is the exact conversion from TradingView source: "Hurst Cycle Channel Clone Oscillator" By "LazyBear". - For bar color option please send private message.
- This is a non-repaint and light processing load indicator. - Buffers and inputs are available for use in EAs and optimization purposes. - You can message in private chat for further changes you need.

Индикатор RSI magic kjuta5 .
Пользовательский Индикатор ( RSI magic kjuta ) на основе стандартного Индикатора Силы ( Relative Strength Index, RSI ) с дополнительными настройками и функциями. К стандартной линии RSI добавлены линии максимального и минимального значения RSI на графике. Теперь можно визуально наблюдать прошедшие максимумы и минимумы RSI , а не только значения по закрытию баров, что позволяет избежать путаницы при анализе торгов. Например, советник открыл или закрыл ордер, но

To get access to MT4 version please click here . This is the exact conversion from TradingView: "Supertrend" by " KivancOzbilgic ". This is a light-load processing and non-repaint indicator. You can message in private chat for further changes you need. Here is the source code of a simple Expert Advisor operating based on signals from Supertrend . #include <Trade\Trade.mqh> CTrade trade; int handle_supertrend= 0 ; input group "EA Setting" input int magic_number= 123456 ; //magic number input dou

The Trend Quality Indicator (by David Sepiashvili) is intended to measure trend activity. Some benchmarks can be used to determine the strength of a trend.
In the range of values from -1 to +1 ( Ignored zone parameter) , the trend is buried beneath noise. It is preferable to stay out of this zone.
The greater the value, the less the risk of trading with a trend, and the more reliable the trading opportunity.
The range from +1 to +2, or from -1 to -2, may be treated as zone of weak tr

The Netsrac Correlation Trade Indicator (NCTI) was created to trade correlations between different assets. NCTI offers five different strategies to do this. Five different correlation trading strategies with two or three assets Fast access your assets with one click via asset buttons Your profit/loss at a glance Configurable alerts via screen or mobile You can use the indicator with every timeframe. Higher timeframes give fewer but better signals. If you have some questions or suggestions - pl

Indicador de cointegração entre ativos Indicador para estratégias de arbitragem estatística e quantitativa. Podendo realizar Long&Short ou Long&Long/Short&Short entre dois ativos distintos. O indicador realiza uma série de testes estatísticos entre os ativos e mostra se o par é cointegrado ou não.
Estratégias sugeridas de uso (a) Verificar se o par está cointegrado pelo teste ADF (Augmented Dickey-Fuller Test). 0% o par não está cointegrado; 90% 95% 97.5% e 99% o par está cointegrado (o maior

Average Daily Range (ADR) with Support (S) and Resistance (R) Levels is an indicator which shows how far a currency pair can move in a day. It can be used to find hidden support and resistance levels, estimate effective profit and stop loss targets, and provide short term trade signals from the hidden S and R levels. Features
Automatically plots on the chat, the top and bottom of the ADR value (i.e. a horizontal channel) which acts as Support and Resistance Levels Automatically calculates the

The " Stochastic Advanced " indicator displays the signals of the 'Stochastic" indicator directly on the chart without the presence of the indicator itself at the bottom of the screen. The indicator signals can be displayed not only on the current timeframe, but also on a timeframe one level higher. In addition, we have implemented a filter system based on the Moving Average indicator.
Manual (Be sure to read before purchasing) | Version for MT4 Advantages
1. Displaying the signals of the "Sto

Displays multiple indicators, across multiple timeframes and symbols to give a comprehensive overview of the market. Uniquely, the indicators are configurable and can include custom indicators, even those where you just have the ex4 file or those purchased from Market. Standard indicators can also be selected, the default being ADX, CCI, market price above/below Moving Average (MA), Moving Average Cross (MAX), MACD, Momentum (MOM), OsMA, RSI, Parabolic SAR, William's Percentage Range (WPR). Use

According to Bill Williams' trading strategy described in the book "Trading Chaos: Maximize Profits with Proven Technical Techniques" the indicator displays the following items in a price chart: 1.Bearish and bullish divergent bars: Bearish divergent bar is colored in red or pink (red is a stronger signal). Bullish divergent bar is colored in blue or light blue color (blue is a stronger signal). 2. "Angulation" formation with deviation speed evaluation. 3. The level for placing a pending order (

The Bheurekso Pattern Indicator for MT5 helps traders automatically identify candlestick pattern that formed on the chart base on some japanese candle pattern and other indicator to improve accurate. This indicator scans all candles, recognizes and then displays any candle patterns formed on the chart. The candle displayed can be Bullish or Bearish Engulfing, Bullish or Bearish Harami, and so on. There are some free version now but almost that is repaint and lack off alert function. With this ve

Este sistema é bom em identificar reversões de curto prazo no mercado. É baseado em um estudo de aprendizado de máquina sobre a estrutura do mercado e pode ser uma ótima ferramenta para escanear o mercado ou negociar diretamente. Com tudo, não há uma taxa de vitória de 100%, mas esse indicador às vezes é sempre preciso.
Quando ele pensa que uma reversão vai acontecer, ele vai colorir a vela uma cor específica, desenhar uma seta e, em seguida, alertá-lo sobre a compra ou venda da próxima vela.

SMARTMASS INDICATOR
This indicator is different from all known volume indicators. It has a significant distinction; it is an algorithm that relates price movement to volume, attempting to find proportionality and efficient movement while filtering out noise and other movements that are more random and do not follow a trend or reversal. Ultimately, it reveals the true strength of the movement, indicating whether it has genuine support from bulls or bears or if it's merely a high-volume movemen
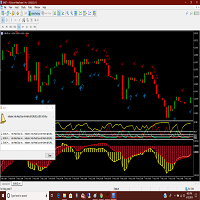
Adx and Macd are powerful indicators which can warn you of a change of direction. Put them together with this great indicator that will warn you of impending changes long before any ma lines cross. More screen shots on the MT4 version. Arrow indicates a solid macd cross and the check marks show the adx movements. You can trade the long term with the macd crosse and scalp the adx changes while you hold the main trend. Thanks for checking out my indicators.

O esgotamento do intervalo ocorre quando o preço atinge ou excede o intervalo esperado para o período atual. Nesses níveis, o preço começa a perder seu ímpeto em relação ao início do período, portanto, é bom garantir que você não esteja assumindo novas posições. Este indicador mostrará onde é provável que isso aconteça em seu gráfico, mostrando os níveis para os períodos Diário, Semanal e Mensal. Quando você vê o preço excedendo esses níveis de exaustão, está dizendo que o momento por trás do mo

Mega Spikes Max Indicator for MT5 is an innovative solution for any beginner or expert trader! Trading Deriv Boom and Crash spikes has never been easy without mega spikes max. It combines technical indicators and price action to determine the best spiking zone for Boom and Crash spikes. Mega Spikes Max can be applied on any Boom & Crash Chart on mt5. It is a real breakthrough product that gives you a clear picture of trading the boom and crash market. It uses colored buy and sell arrows that in

INDICADOR baseado em INTELIGÊNCIA ARTIFICIAL que gera possíveis entradas de chamada e venda para opções binárias.
o indicador funciona em 3 estratégias diferentes:
1) ao ler volumes, envia um sinal quando o preço deve reverter
2) através da divergência entre preço e volume, envia um sinal quando a tendência deve continuar ou reverter
3) através da convergência entre preço e volume, envia um sinal de quando a tendência deve continuar.
o indicador funciona em todos os prazos, mas os

Crash Spike Master é o futuro para operações nos mercados de queda. Foi projetado para funcionar nos mercados Crash 300, 500 e 1000 no intervalo de tempo de 1 minuto. Possui 2 modos de negociação diferentes (Agressivo e Normal). O modo Agressivo irá plotar setas amarelas e azuis. São duas condições diferentes para ajudar na tomada da decisão correta. Entre na primeira negociação com a seta amarela e na segunda negociação com a vela azul. O stop-loss neste modo será 10 velas após a seta azul. O m

Este indicador de zona de oferta e demanda desenha as zonas no gráfico e envia alertas quando o preço atinge ou rompe uma zona. Também é possível usá-lo para ser alertado sobre topos/fundos duplos regulares em vez de zonas. É possível usar filtros RSI, volume e divergência para filtrar apenas as configurações mais fortes. Combinado com suas próprias regras e técnicas, este indicador permitirá que você crie (ou aprimore) seu próprio sistema poderoso. Este indicador é para o trader mais experiente

DYJ TRADINGVIEW é um sistema de classificação de vários indicadores, usando as contagens de sinais de classificação e ferramentas de análise para encontrar oportunidades de entrada nos mercados globais
DYJ TRADINGVIEW possui 10 indicadores integrados para análise de mercado.
A análise baseada em indicadores é usada por muitos traders para ajudá-los a tomar decisões sobre quais negociações realizar e onde entrar e sair delas.
Usamos vários tipos diferentes que podem se complementar bem.

Este indicador detecta reversões de preços em zigue-zague, usando apenas análise de ação de preços e um canal donchiano. Ele foi projetado especificamente para negociações de curto prazo, sem repintar ou retroceder. É uma ferramenta fantástica para traders astutos, com o objetivo de aumentar o tempo de suas operações. [ Guia de instalação | Guia de atualização | Solução de problemas | FAQ | Todos os produtos ]
Surpreendentemente fácil de negociar Fornece valor em cada período de tempo Imple
Unique trend trading algorithm with advanced filtering and many features which should become a part of your trading arsenal. This indicator can give you also trading advisors (with take profit target), success rate scanner and much more. TrendMagiX PRO comes with built-in multi-pair and multi-timeframe scanner which is fully adjustable. User can select own symbols and time-frames to monitor. + ALL the features of standard TrendMagiX indicator
Important information For additional detailed infor

Pipfinite creates unique, high quality and affordable trading tools. Our tools may or may not work for you, so we strongly suggest to try the Demo Version for MT4 first. Please test the indicator prior to purchasing to determine if it works for you. We want your good reviews, so hurry up and test it for free...we hope you will find it useful.
Combo Energy Beam with Swing Control Strategy: Confirm swing pullback signals Watch Video: (Click Here) Energy Beam with Trend Laser Strategy: Confirm Tr

The Pioneer Of Trend Detection! A Powerful Indicator That Avoids Whipsaws And Uncertain Market Noise. Functions mainly as a filter to help you trade in the direction of the trend. It works in any pair or timeframe.
Features Advanced trend detection software using complex algorithms that can be used as the supporting tool or system. Unique trend detection that avoids whipsaws and uncertain market noise Analyzes statistics of maximum profits and calculates possible targets for the next signal Fl

Pipfinite creates unique, high quality and affordable trading tools. Our tools may or may not work for you, so we strongly suggest to try the Demo Version for MT4 first. Please test the indicator prior to purchasing to determine if it works for you. We want your good reviews, so hurry up and test it for free...we hope you will find it useful.
Combo Razor Scalper with Trend Laser Strategy: Scalp in the direction of the trend Watch Video: (Click Here)
Features Scalping indicator using a confir

The professional browser of News and Trading Sessions is now available in MetaTrader 5.
Now all the most important market information is collected on one dial!
News located on the Time scale. Planning your working time has never been so easy and convenient ... The news scale can be switched a day, two, a week, a month forward or backward (see the details in the short video). All news updates in real time.
Thanks to the built-in filters, you can configure the display of news by importanc

The indicator calculates the correlation coefficient of 2 instruments, shifts the chart of the 2nd instrument relative to the 1st and displays the charts of both instruments on the current chart. The maximum positive and negative deltas and the current delta as a percentage of the maximum are calculated. It is possible for signals to set a delta for entry and exit with displaying the direction of entry into trade for each instrument. The space between the charts is also filled with different col

HEIKEN PLUS is the only indicator you really need to be a successful trader , without in depth knowledge of the forex trading or any tools.
Also there is automatically trading EA available now: https://www.mql5.com/en/market/product/89517? with superb SL/TP management! and sky high profit targets !!!
Very suitable tool for new traders or advanced traders too. This is MT5 version. For MT4 version visit : https://www.mql5.com/en/market/product/85235?source=Site
HEIKEN+ is a combination o

Contact me for instruction, any questions! Introduction The Elliott Wave in technical analysis describes price movements in the financial market that are related to changes in trader sentiment and psychology. The 5 W Pattern (Known as 3 Drives) is an Elliott Wave pattern that is formed by 5 consecutive symmetrical moves up or down. In its bullish form, the market is making 5 drives to a bottom before an uptrend forms. In a bearish 5-drive, it is peaking before the bears take over. 5W Pattern S

Nós da Minions Labs consideramos o ATR ( Average True Range ) um dos indicadores mais fantásticos e subestimados de Análise Técnica. A maioria dos traders realmente não dá a mínima para o True Range do mercado e isso provavelmente pode ser porque eles não conseguiram aplicar essas informações de imediato e de maneira prática em seus estudos gráficos ou em sua própria estratégia de trade, deixando esse indicador no limbo da obscuridade e da dúvida.
Bem, este indicador, Bigger Than ATR , é um a

A combination of trend, pullback, range breakouts and statistics in one indicator Mainly functions as an Entry indicator. Works in any pair and timeframe.
Suggested Combination Cluster Helix with Strength Meter Strategy: Confirm signals with ideal strength levels Watch Video: (Click Here)
Features Detects range breakouts on pullback zones in the direction of the trend Analyzes statistics of maximum profits and calculates possible targets for the next signal Flexible tool, can be used in many

"Volality 75 Boom Crash VIX" is an advanced analysis tool designed to identify key breakout zones in volatile asset pairs and boom crashes. Its focus is on highlighting moments of high volatility in the market.
This indicator is perfect for both scalping and swing trades.
"Volality 75 Boom Crash VIX is not just an indicator, but a trading strategy in itself.
The most recommended timeframe for using the indicator is 15M MINUTES.
The breakout levels represent the balance between bullish a

Meta Trend Indicator is an efficient way to forecast and detect the trend in any market. It reveals the trend, support and resistance levels, volatility and the maximum potential target, all in one indicator. To adapt to the price and to decrease consecutive trend failures, the internal trend detector algorithm studies the market and dynamically chooses the right values for the internal parameters. This indicator is a perfect trend filter for any strategy or expert advisor. Features Super Adapti

This indicator shows when user set sessions are active and returns various tools + metrics using the closing price within active sessions as an input. Users have the option to change up to 4 session times.
The indicator will increasingly lack accuracy when the chart timeframe is higher than 1 hour.
Settings
Sessions
Enable Session: Allows to enable or disable all associated elements with a specific user set session.
Session Time: Opening and closing times of the user set session

Little Hanzel is t he best spike Detector, the indicator is made for trading Boom and Crash using the 1 min timeframe.It use levels on the 1 min timeframe to detect spikes.A horizontal line(order level) will appear on all the buying levels for on Boom and selling level, horizontal line will also appear on Crash. Join mql5 Little Hanzel channel https://www.mql5.com/en/channels/littlehanzel Input section: Choose Boom for the Boom indices (Boom 1000, Boom 500,and Boom 300 ) Choose Crash for t

A Gann Box (ou Gann Square) é um método de análise de mercado baseado no artigo "Fórmula matemática para previsões de mercado" de WD Gann. Este indicador pode representar três modelos de Quadrados: 90, 52(104), 144. Existem seis variantes de grades e duas variantes de arcos. Você pode plotar vários quadrados em um gráfico simultaneamente.
Parâmetros Square — seleção de um modelo quadrado: 90 — quadrado de 90 (ou quadrado de nove); 52 (104) — quadrado de 52 (ou 104); 144 — quadrado universal

A supply and demand indicator designed with a minimalist trading strategy based on the nature of the market. Indicator type: Price Action indicator The Bull zone is a strong support area, and the Bear zone is a strong resistance area. When a Bull zone was breakout, it becomes the "base" of the Bears and vice versa. When the price meets these areas, there is a high probability that the price will reversal , so we call them Obstacles. It is a suitable indicator for traders interested in manual pr

Non standard attitude to the standard moving average indicator. The essence of the indicator is to determine the strength and speed of the price direction by determining the tilt angle of the moving average. A point is taken on the fifteenth MA candle and a point on the last closed MA candle, a straight line is drawn between them, it is movable and on a hemisphere shows an angle of inclination from 90 degrees to -90. above 30 degrees is the buying area, below -30 degrees is the selling area. abo
The FCPI indicator or Forex Currency Power Index indicator is a multi currency pairs indicator that displays 28 pairs on 1 chart, which consists of 8 Major Pairs and 20 Cross pairs. 8 Major Pairs dan 20 Cross pairs: EURUSD,GBPUSD,AUDUSD,NZDUSD,USDCAD,USDCHF,USDJPY,EURGBP,EURAUD,EURNZD,EURCAD,EURCHF,EURJPY,GBPAUD, GBPNZD,GBPCAD,GBPCHF,GBPJPY,AUDNZD,AUDCAD,AUDCHF,AUDJPY,NZDCAD,NZDCHF,NZDJPY,CADCHF,CADJPY,CHFJPY. Automatically detects symbols that have a symbol prefix and/or a symbol suffix.
The

ICT Core Content Concepts turned into indicator plus all previous tools known from the Position Smart Indicator . This makes it the Full PSI Private Version ( read more ) restricted up to now but available only after the Mentorship Core Content was made public on YouTube. You will find many price action study tools like: Central Bank Dealing Range - CBDR Asian Range FLOUT Profiles and SD targets on the CBRD, Asian Range and Flout both on the wicks and on the bodies Seek & Destroy Prof

Overview
The Volume SuperTrend AI is an advanced technical indicator used to predict trends in price movements by utilizing a combination of traditional SuperTrend calculation and AI techniques, particularly the k-nearest neighbors (KNN) algorithm.
The Volume SuperTrend AI is designed to provide traders with insights into potential market trends, using both volume-weighted moving averages (VWMA) and the k-nearest neighbors (KNN) algorithm. By combining these approaches, the indicat

MA Alert Indicator
You do not need anymore to constantly and tediously look at the chart . If your strategy uses any type of moving average with any settings, just add this indicator to the chart according to your required settings
You will be notified whenever the price hits your MA , whether touch or candle close by crossing it. Also, an arrow symbol will be displayed on the chart based on movement.
If you d o not have access to your computer, just set your MetaTrader notification by t

The indicator is designed for pair trading with 2 highly correlated instruments.
Indicator charts can be displayed as lines or histograms. There is an MTF mode, the maximum and minimum deltas for the calculated number of bars are displayed with a check for a specified minimum value. It is possible to enable the calculation of trade operations with checking the current correlation coefficient for the minimum specified, the current delta in points or percent of the maximum (minimum) delta and

Cryo is based on the process of identifying the rate of change in price growth and allows you to find entry and exit points from the market. A fundamental technical indicator that allows you to assess the current market situation in order to enter the market of the selected currency pair in a trend and with minimal risk.
The Cryo indicator was created on the basis of the original indicators for searching for extremes, the indicator is well suited for determining a reversal or a large sharp je

This indicator will draw a label above or below each candle based on Rob Smith's The Strat as they develop over time on your chart.
As price evolves, a candle can switch between three states. When the candle first opens, if it sits completely within the previous candles high and low, then it will start as a Type 1. As time moves on, if it breaks either the high or low of the previous candle, it will be come a type 2, and should the price action be volatile and directionless, it may then
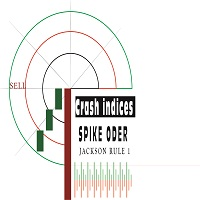
This is a powerful crash spike detector indicator. It design to work on crash only it might be crash 100 ,crash 500 or crash 300 .binary.com broker provide crash indices .on 1minete only make sure to take signals consistence .it have a notification that makes sound whenever the spike it about to shown ,it proven 98% correct since 2017 . Try it now. check the recent result on the screenshot.

This is a multiple timeframe version of the classic Parabolic SAR indicator (stands for "stop and reverse"). PSAR follows price being a trend following indicator. Once a downtrend reverses and starts up, PSAR follows prices like a trailing stop. You can choose the timeframes for displaying PSAR on the chart. Of course, you can see PSAR only from the current and higher timeframes. Input parameters: bM15 - PSAR from M15 bM30 - PSAR from M30 bH1 - PSAR from H1 bH4 - PSAR from H4 bD1 - PSAR from D1

This indicator uses candlesticks with large real bodies to predict possible market structure shift. Displacement is a very powerful move in price action resulting in strong selling or buying pressure. Generally speaking, displacement will appear as a single or a group of candles that are all positioned in the same direction. These candles typically have large real bodies and very short wicks, suggesting very little disagreement between buyers and sellers. Often, a displacement will occur just af

Squat bar.
One of the signals of the "Trade Chaos" system of Bill Williams.
It is calculated based on the difference in price changes and tick volume.
Strengthens the signal of the "Bearish/Bullish Divergent Bar (First Wiseman)" if it coincides with it or is nearby.
Tested in comparison with the original program "Investor's Dream".
For more effective development of the system, read and see the materials of Bill Williams.
In the settings you can choose the color of bar.
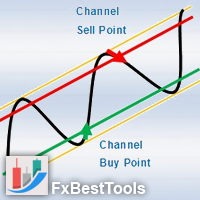
Channels Indicator is an All-In-One Indicator with a powerful calculation engine. The Indicator contains 4 different and usual methods for finding channels on the market. Indicator is powered by a visual interface and with various selections of alerts and notifications.
Testing Indicator : Strategy Tester does not respond to your clicks on panels (This is metatrader tester limitation). Thus input your desired settings on the indicator pre-settings and test.
Using Indicator :
Display
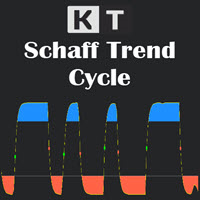
The Schaff Trend Cycle (STC) is a technical analysis tool that helps traders and investors plot highly-probable predictions on the price direction of an instrument. Due to its predictive properties, It's a good tool for foreign exchange (forex) traders to plot buy and sell signals. The Schaff Trend Cycle was developed by prominent forex trader and analyst Doug Schaff in 1999. The idea driving the STC is the proven narrative that market trends rise or fall in cyclical patterns across all time fr

ATR dynamic level The indicator calculates the price range within which the asset price moved for the specified period of time, and also builds the boundaries of the calculated range for the current week and for today. The levels are calculated from the beginning of the opening of the week (weekly) and from the beginning of the opening of the day (daily).
Features:
1) Support and resistance levels are always relevant, since these levels change along with the price movement. If the price has

Este é um indicador linear de uma potência monetária com a capacidade de filtrar suavizando valores. Mostra a potência atual das moedas selecionadas (o número máximo é 8), bem como os valores históricos. O cálculo depende do período de tempo do gráfico selecionado no qual o indicador é lançado. O indicador exibe os dados como linhas para todas as moedas ou como um histograma para o par de moedas atual. A interseção dos índices de força da moeda para o par de moedas atual também é exibida como se

KT Higher High Lower Low marks the following swing points with their respective S/R levels: Higher High: The swing high made by the price that is higher than the previous high. Lower High: The swing high made by the price that is lower than the previous high. Lower Low: The swing low made by the price that is lower than the previous low. Higher Low: The swing low made by the price that is higher than the previous low.
Features The intensity of swing high and swing low can be adjusted by cha

KT Forex Trend Rider uses a trend following algorithm developed specifically for the Forex market to provide reliable buy & sell signals across the major currency pairs. It works best on major FX pairs and all time-frames.
Features
It comes with a Multi-Timeframe scanner that can search for upcoming signals across all the time-frames. It comes with four preset profiles to facilitate trading for scalpers, tick-trend, swing, and trend traders. It marks the potential reversal points in the mark

Smart Drawing Assist PRO MT5. Buttons will appears next to the selected object. The buttons are straightforward and amazingly easy to use. Features are as follow: Draw zigzag . Enabling you to draw patterns, draw zigzag, and draw shapes. All you have to do is click the button and start clicking point to point and it will draw automatically. Change object color . Rectangle/Trendline/HLine/Vline/Text/Price Arrow/Arrowed Line/ and your suggestion please. Flatten trendline . make a perfect flat line

Atenção: Nova atualização - 4 grandes melhorias de praticidade!
1) Alarme 2) Valor em texto na Midas 3) Painel de cliques 4) Pode ser ligado em um EA para operar no modo semiautomático
Atenção - Este indicador não funciona perfeitamente em backteste por particularidades do MT5 (Leitura de teclas de atalho ou cliques no painel). Minhas sugestão é que você teste o Automatic Vwap Midas que tem o funcionamento automático para analisar o cálculo e depois comprar o Start se achar que o indicador v

Quarterly Cycles
Quarterly Cycles is based on the Quarterly Theory developed by Daye ( traderdaye on X ). This is an aid to the user to find Cycles and it is NOT automatic detected, user can select AMDX or XAMD in each Cycle and it will be visually drawn on the chart. Quarterly Cycles: Yearly, Monthly, Weekly, Daily, 6 Hour (90 minutes)
– Yearly Cycle : The year is divided in four sections of three months each Q1 - January, February, March Q2 - April, May, June Q3 - July, August, Sept

This is MT5 version, MT4 on this link: Alert Line Pro MT4 Alert line pro allows to make alert when price cross these objects: Horizontal lines Trendline Price Zone (Rectangle) Alert when close current bar (have new bar) When the price crosses the alert lines, the software will sound an alarm and send a notification to the MetaTrader 5 mobile application. You need to settings your MetaQuotes ID of MT5 apps to MetaTrader5 software to get notification to the mobile phone. Sound files must be pl

This indicator contains Pivot Levels of: Traditional Fibonacci Woodie Classic Demark Camarilla Calculation periods can be set to auto / Daily / Weekly / Monthly / Yearly. Number of Levels are editable. Options to hide level labels and price labels. Pivots Points are price levels chartists can use to determine intraday support and resistance levels. Pivot Points use the previous days Open, High, and Low to calculate a Pivot Point for the current day. Using this Pivot Point as the base, three

Este indicador reconhece um tipo especial de formação de barra interna que é formada por uma grande vela Mestre seguida por 4 velas menores (consulte a explicação da estratégia abaixo). Recursos Representa as linhas de stop de compra / venda no gráfico, bem como os níveis de take profit e stop loss. Os níveis de TP / SL são baseados no indicador Average True Range (ATR). As cores dos objetos são mutáveis. Envia um alerta em tempo real quando uma formação de vela mestre é identificada - som / pop

Combination of Ichimoku and Super Trend indicators, with Signals and live notifications on Mobile App and Meta Trader Terminal. Features: Display five reliable signals of ARC Ichimoku Filter signals by their strength level (strong, neutral, weak) Send live notifications on Mobile App and Meta Trader terminal S ignals remain consistent without repainting Applicable across all time-frames Suitable for all markets Notifications format: "ARC Ichimoku | XAUUSD | BUY at 1849.79 | Tenken-Kijun cross |

Big summer sale. Save up to 40% on my products. ADR Dashboard - save 9$! The intention of the dashboard is to provide a quick overview of the daily, weekly and monthly range of configured assets. In "single asset mode" the dashboard shows you possible reversal points directly in the chart, thus making statistics directly tradable. If a configured threshold is exceeded, the dashboard can send a screen alert, a notification (to the mobile MT5) or an email. There are various ways of using this in
O mercado MetaTrader é um espaço, sem precedentes, para negociar robôs e indicadores técnicos.
Leia o artigo Manual do usuário da MQL5.community para saber mais sobre os serviços exclusivos que oferecemos aos traders: cópia de sinais de negociação, aplicativos personalizados desenvolvidos por freelances, pagamentos automáticos através de sistema de pagamento e a rede em nuvem MQL5.
Você está perdendo oportunidades de negociação:
- Aplicativos de negociação gratuitos
- 8 000+ sinais para cópia
- Notícias econômicas para análise dos mercados financeiros
Registro
Login
Se você não tem uma conta, por favor registre-se
Para login e uso do site MQL5.com, você deve ativar o uso de cookies.
Ative esta opção no seu navegador, caso contrário você não poderá fazer login.