Conheça o Mercado MQL5 no YouTube, assista aos vídeos tutoriais
Como comprar um robô de negociação ou indicador?
Execute seu EA na
hospedagem virtual
hospedagem virtual
Teste indicadores/robôs de negociação antes de comprá-los
Quer ganhar dinheiro no Mercado?
Como apresentar um produto para o consumidor final?
Pagamento de Indicadores Técnicos para MetaTrader 5 - 12

BeST_Hull MAs Directional Strategy is a Metatrader Indicator based on the corresponding Hull Moving Average.It timely locates the most likely points for Entering the Market as well as the most suitable Exit points and can be used either as a standalone Trading System or as an add-on to any Trading System for finding/confirming the most appropriate Entry or Exit points. This indicator does use only the directional slope and its turning points of Hull MAs to locate the Entry/Exit points while it
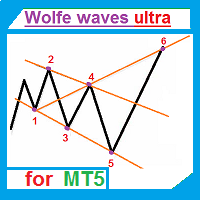
The indicator automatically draws Wolfe waves. The indicator uses Wolfe waves found in three timeframes. This indicator is especially accurate because it waits for a breakout in the wave direction before signaling the trade. Recommended timeframe: М1.
Indicator features Amazingly easy to trade. The indicator is able to recognize all the patterns of Wolfe waves in the specified period interval. It is a check of potential points 1,2,3,4,5 on every top, not only the tops of the zigzag. Finds the

The ICT Concepts indicator regroups core concepts highlighted by trader and educator "The Inner Circle Trader" (ICT) into an all-in-one toolkit. Features include Market Structure (MSS & BOS), Order Blocks, Imbalances, Buyside/Sellside Liquidity, Displacements, ICT Killzones, and New Week/Day Opening Gaps. It’s one kind of Smart money concepts. USAGE: Please read this document ! DETAILS Market Structure Market structure labels are constructed from price breaking a prior extreme point. T

ICT Kill zone and Macros Indicator mark and display the following zone times on the chart: Kill zones Kill zone Forex Asian
London Open New York Open London Close Central Bank Dealing range
Kill zone Indices Asian London Open New York AM New York Lunch New York PM Power Hour
Macros London 1 London 2 New York Am 1 New York AM 2 New York Lunch New York PM 1 New York PM 2
Silver bullet London Open New York AM New York PM
Sessions Asian London New York
Chart The display of Kill zone ,
This Renko is: Live : constantly updated on the market prices Dynamic : updating on each new ATR value Backtestable : Generating the chart during backtest, allowing Real Ticks Accuracy and Time Period Accuracy Guppy Built-in : GMMA with 12 EMA built-in This is what you are looking for! RENKO A Renko chart is a type of chart, developed by the Japanese, that is built using price movement rather than both price and standardized time intervals like most charts are. It is thought to be named a

MACD Histogram tracks the difference between the MACD line and the Signal line (which is the exponential moving average of the first line). For better visibility, when plotting the lines and the histogram in the same window, we scale up the histogram by a factor of 2. Furthermore, we use two separate plots for the histogram, which allows us to color-code the bars for upticks and downticks. The MACD Combo overlays MACD lines on MACD Histogram. Putting both plots in the same window enables you to

The indicator displays the delta and the cumulative delta based on the "Time & Sales" deals list data. In addition to the standard timeframes, the indicator displays data regarding the seconds timeframes (S5, S10, S15, S20, S30) to choose from. Using the rectangle, user can select an arbitrary area in the indicator subwindow to view the ratio of the volumes of deals of buyers and sellers within this area.
Indicator features:
The indicator works correctly only on those trading symbols for whi

" A trading range occurs when a financial instrument trades between constant high and low prices over a period of time. The upper part of the trading range of a financial instrument often provides price resistance, while the lower part of the trading range usually offers price support. Traders can enter in the direction of a breakout or breakdown from a trading range... "
This is the "Classical Theory" understanding of ranges. We have a different understanding of the nature of ranges and th

Uses the built-in news calendar of the MT5 terminal or the Investing.com website (in the latter case, the Get news5 utility is required) Has the Scale parameter={100%, 110%, 125%, ...} to adjust the comfortable size of the text and control elements
Tells you in which direction it is safer to open positions 3 in 1: news + trends + news impact index
news for the selected period: current and in tabular form
actual trends for 5 customizable timeframes and trend reversal levels
forecast of exc

A Swing Failure Pattern ( SFP ) is a trade setup in which big traders hunt stop-losses above a key swing high or below a key swing low for the purpose of generating the liquidity needed to push price in the opposite direction. When price 1) pierces above a key swing high but then 2) closes back below that swing high, we have a potential bearish SFP . Bearish SFPs offer opportunities for short trades. When price 1) dumps below a key swing low but then 2) closes back above that swing low, we have

[ MT4 Version ] Order Block Indicator MT5 Order Block Indicator MT5 is currently the most accurate and customizable indicator in the market. It has been developed to facilitate the analysis of operations based on Order Blocks and Supply and Demand Zones. These zones are possible reversal points of a movement. Order Blocks indicate a possible accumulation of orders in one area. The price usually gets to reach and react strongly to those areas. The most relevant levels for this reaction are the c
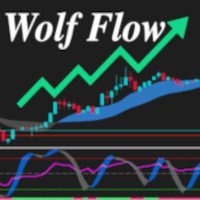
The Wolf Flow Indicator for MetaTrader 5 is the perfect solution for traders looking for instant clarity and precision in their market analysis. Simple to use and immediate to view, this tool offers you a complete overview of market dynamics in a single glance.
Strengths:
Absolute Simplicity: A clean and intuitive interface guarantees effortless use, even for less experienced traders. I mmediate and Rapid: Key data is presented in real time, allowing you to make instant decisions with
BW Dance - Bill Williams Trading Chaos Signal MTF Indicator for MetaTrader 5
!!! This indicator is not a trading system !!!
This is only a convenient tool for receiving signals of the Bill Williams trading system in visual and sound mode - Signals are not redrawn/ not repainting
The main idea of the indicator:
display current signals of the BW system on the right edge of the chart, according to the principle HERE and NOW output signals in three ways:
next to the price scale unde

PACK 1 do Phi Cubic Fractals com opção para estender os indicadores no FUTURO, para o lado direito do gráfico Este produto contém os indicadores do PACK 1 (Lines + LineSAR + Channels + BTL + Ladder) + MODO FUTURO Phi Lines - medias moveis especiais, semelhantes às MIMAs do Phicube, capazes de indicar com muita clareza tanto a tendencia como a consolidação; Phi LineSAR - apaga ou destaca as Phi Lines para mostrar apenas as linhas que funcionam como suporte ou resistencia, indicando o limite de

FFx Universal Strength Meter PRO is more than a basic strength meter. Instead of limiting the calculation to price, it can be based on any of the 19 integrated strength modes + 9 timeframes. With the FFx USM, you are able to define any period for any combination of timeframes. For example, you can set the dashboard for the last 10 candles for M15-H1-H4… Full flexibility! Very easy to interpret... It gives a great idea about which currency is weak and which is strong, so you can find the best pai

The FFx Watcher PRO is a dashboard displaying on a single chart the current direction of up to 15 standard indicators and up to 21 timeframes. It has 2 different modes: Watcher mode: Multi Indicators User is able to select up to 15 indicators to be displayed User is able to select up to 21 timeframes to be displayed Watcher mode: Multi Pairs User is able to select any number of pairs/symbols User is able to select up to 21 timeframes to be displayed This mode uses one of the standard indicators

Support Resistance View draws horizontal lines in the current chart that define in real time the values of Supports/Resistances for the timeframe tha you choose. Inputs: Lines color: color of the lines. Timeframe: timeframe for calculations. Support and Resistance are values at which the currency usually inverts the trend or have a breakthrought, so you can use this values to define a strategy for trading.

Expert Market Edge is scalping, trending, reversal indicator, with alerts . You can use it all and fit with your strategy whatever it fits you. My recommendation is to combine with my Colored RSI , and when 2 signals are matched, and pointing same direction (for example buy on this indicator, and green on RSI, you can take a long position, stop loss should be last local low, if you want to be more conservative, add ATR. ) you can take position. If you using moving averages, that's even better i

!! FLASH SALE !! Over 80% off !! For ONE week only. Now only $47 - normally $297! >>> Ends on 30 June 2023 - Don't miss it!
The Consolidation Breakout Alerts Indicator will revolutionize your trading strategy. Our innovative indicator offers unique buy and sell arrows when price breaks out from consolidation, allowing you to get in at the most optimal entry with minimal risk and maximum reward potential. Never again will you miss out on the lucrative trading opportunities available

PACK 2 do Phi Cubic Fractals com opção para extender os indicadores no FUTURO, para o lado direito do gráfico Este produto contem os indicadores do PACK 2 (ROC full / SAINT 8 / SAINT 17 / SAINT 34 / SAINT 72 ) + MODO FUTURO Phi ROC - indicador do tipo oscilador, semelhante ao MIMAROC, que é capaz de mostrar a direção e a força do mercado, bem como determinar o ponto de entrada ótimo; Phi SAINT - indicador do tipo oscilador, semelhante ao SANTO do Phicube, que é capaz de mostrar a direção e a

A melhor codificação da Vwap Midas para MT5 é da White Trader. O indicador foi otimizado para não recalcular (melhorando o desempenho) e traz diversas configurações visuais para você adaptar do seu jeito. TESTE GRATUITAMENTE clicando em demo grátis
Onde e porque usar A Vwap Midas (e o Auto Zig Vwap Midas) pode ser usada em diversos ativos de índices, moedas, forex, criptomoedas, ações, índices e commodities. Muitos traders de sucesso usam preço e volume para conseguir seus resultados. Outros

Time And Sales Layout indicator shows traded buy and sell volumes right on the chart. It provides a graphical representation of most important events in the time and sales table. The indicator downloads and processes a history of real trade ticks. Depending from selected depth of history, the process may take quite some time. During history processing the indicator displays a comment with progress percentage. When the history is processed, the indicator starts analyzing ticks in real time. The l

Introduction
One of the patterns in "RTM" is the "QM" pattern, also known as "Quasimodo". Its name is derived from the appearance of "Hunchback of Notre-Dame" from Victor Hugo's novel. It is a type of "Head and Shoulders" pattern.
Formation Method
Upward Trend
In an upward trend, the left shoulder is formed, and the price creates a new peak higher than the left shoulder peak . After a decline, it manages to break the previous low and move upward again. We expect the pric
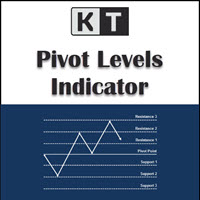
KT Pivot Points automatically plots the daily, weekly, and monthly pivot levels on a chart with the precise calculation based on the latest data. Pivot points is a widely used indicator in technical analysis, particularly in the Forex market.
Features
Send alerts when the price touches the pivot level. It offers complete customization for each kind of pivot level. Shows daily, weekly, and monthly pivot levels without any fuss. It uses minimum CPU resources for faster calculation. Compati
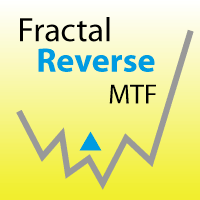
Fractal Reverse MTF - Indicator for determining the fractal signal to change the direction of the trend for МetaТrader 5.
The signal is determined according to the rules described in the third book of B. Williams:
- In order to become a signal to BUY, the fractal must WORK ABOVE the red line
- In order to become a signal for SALE, the fractal must WORK BELOW the red line
- Signals are not redrawn/ not repainting The main idea of the indicator:
- Determine the change in the directio

The indicator measures and displays the difference in the number of "Bid" and "Ask" prices changes in the form of digital, analog and graphic indicators. Designed for market research and for determine the moments of position closing during scalping trade with H1 or less timeframe. Use with bigger timeframe is not prohibited, but it is not informative because of a large number of accumulated values. Theory
"Bid" and "Ask" prices do not change simultaneously for most symbols. Often you can see h
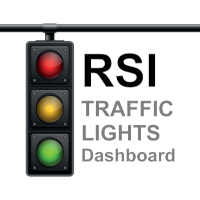
RSI Traffic Lights Dashboard Trend is you friend, one of the classical Trend following is the Relativ Streng Index (RSI). With RSI Traffic Light Dashboard you get an Overview how the current trend is moving for several Pairs. How many pairs you monitor, can be configured in Indicator settings. The order of symbols is equivalent to your Market Watchlist. The RSI Traffic Light Indicator alerts you if the trend is changing for your pair. Alert can be switched on/off
Important: Get informed about
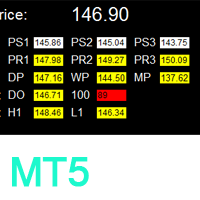
如果产品有任何问题或者您需要在此产品上添加功能,请联系我 Contact/message me if you encounter any issue using the product or need extra feature to add on the base version.
To access the free demo version, please re-direct to this LINK . To access the dashboard version, please re-direct to this LINK . Critical Support and Resistance is an intuitive, and handy graphic tool to help you to monitor and manage critical support and resistance price point easily with one glance to know status of all important S&R. Price is likely

This indicator shows price changes for the same days in the past. This is a predictor that finds bars for the same days in past N years, quarters, months, weeks, or days (N is 10 by default) and shows their relative price changes on the current chart. Number of displayed buffers and historical time series for comparison is limited to 10, but indicator can process more past periods if averaging mode is enabled (ShowAverage is true) - just specify required number in the LookBack parameter. Paramet
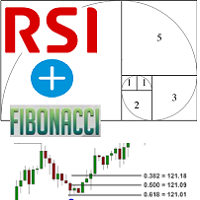
Fibonacci and RSI.
The indicator is a combination of the Fibonacci and RSI indicators.
Every time the price touches one of the fibonacci levels and the rsi condition is met, an audible alert and a text alert are generated.
Parameters number_of_candles : It is the number of candles that will be calculated. If you put 100, the indicator will give you the maximum and minimum of the last 100 candles.
sound_signal: If you want the indicator to notify you that the conditions are met using

This new unique indicator Actual tick footprint (volume chart) is developed for using on Futures markets, and it allows seeing the volume of real deals right when they are performed. The indicator Actual tick footprint (volume chart) represents a greatly enhanced tick chart that includes additional information about the volume of deal performed at a specific price. In addition, this unique indicator for MetaTrader 5 allows to clearly detecting a deal type – buy or sell. Alike the standard tick c

The indicator is designed for easy construction of synthetic charts based on data of various financial instruments. It will be useful both arbitrage and pair trading, as well as for analysis purposes. Its main advantage is simplicity and clarity. Each chart is given as a common mathematical formula. For example, if you want to plot the spread (difference) between EURUSD and GBPUSD with coefficients 4 and 3, then set the following formula: EURUSD * 4 - GBPUSD * 3 The resulting chart is shown in t

The Chandelier Exit, introduced by Charles LeBeau, is described in "Come into My Trading Room" book.
It calculates each stop on a long position in an uptrend from the highest point reached during that rally, and gets its name from the chandelier, which hangs from the highest point in the room. The Chandelier Exit uses a multiple of the Average True Range (ATR), subtracting it from the highest high since the trade was entered. It creates a new trade whenever the previous trade is stopped out. Ch

One of the key rules in trading is never move your stops in such a way that your risk increases. Our stop sequence shows the automatic tightening of stops. They appear as a series of decreasing risk points until the trade is eventually stopped out.
The problem is that if you enter a trade at any other point than the initial dot of the sequence, you may be placing the stop too close. Stop-entry plots show you the initial value for the stop for each bar. You can use them when you put on a trade,

The Chandelier Exit, introduced by Charles LeBeau, is described in "Come into My Trading Room" book. It calculates each stop on a short position in a downtrend from the lowest point reached during that decline. The Chandelier Exit uses a multiple of the Average True Range (ATR), adding it to the lowest low since the trade was entered. It creates a new trade whenever the previous trade is stopped out. Chandelier Stops differ from traditional stops by having the ability to move against you if the

One of the key rules in trading is never move your stops in such a way that your risk increases. Our stop sequence shows the automatic tightening of stops. They appear as a series of decreasing risk points until the trade is eventually stopped out.
The problem is that if you enter a trade at any other point than the initial dot of the sequence, you may be placing the stop too close. Stop-entry plots show you the initial value for the stop for each bar. You can use them when you put on a trade,

Elder-Ray is made of both Bulls Power and Bears Power as described in "Come into my Trading Room" book. It is tracking the relative power of bulls and bears by measuring how far the high and the low of each bar get away from the average price. Elder-ray is an indicator developed by Dr. Elder and named for its similarity to x-rays. It shows the structure of bullish and bearish power below the surface of the markets. Elder-ray combines a trendfollowing moving average with two oscillators to show w

The purpose of Impulse Release is to prevent trading in the wrong direction. While the Impulse System operates in a single timeframe, Impulse Release is based on two timeframes. It tracks both the longer and the shorter timeframes to find when the Impulse points in the same direction on both. Its color bar flashes several signals: If one timeframe is in a buy mode and the other in a sell mode, the signal is "No Trade Allowed", a black bar. If both are neutral, then any trades are allowed, showi

O Impulse System foi descrito pela primeira vez no livro "Come into my Trading Room". Ele usa a direção do histograma MACD e uma média móvel exponencial (MME) de preço para definir um impulso. A regra é nunca negociar contra o impulso.
Seu código de cores fornece vários sinais: Quando a MME e o histograma MACD estão subindo, as cores do sistema Impulse a cor da barra é verde (curto-circuito não é permitido). Quando a MME e o histograma MACD estão caindo, as cores do sistema Impulse a cor da b

The MACD XOver indicator was developed by John Bruns to predict the price point at which MACD Histogram will reverse the direction of its slope.
The indicator is plotted one day ahead into the future, allowing, if your strategy depends on MACD Histogram, to predict its reversal point for tomorrow (or the next bar in any timeframe). If the closing price tomorrow is above the value of this indicator, then MACD Histogram will tick up. If the closing price tomorrow is below the value of this indica

The Market Thermometer is described in "Come into my Trading Room" book. It measures the degree of volatility, as reflected in greater or smaller intraday ranges. When the Market Temperature spikes above its average or stays below its average for a number of days, it gives trading signals, as described in the book. Parameters: Thermometer_EMA_Length (22) – The length of the moving average of the Market Temperature. The default 22, the average number of trading days in a month. Spike_Alert_Facto

SafeZone is a method for setting stops on the basis of recent volatility, outside the level of market noise. It is described in "Come into my Trading Room" book. In an uptrend, SafeZone defines noise as that portion of the current bar that extends below the low of the previous bar, going against the prevailing trend. It averages the noise level over a period of time and multiplies it by a trader-selected factor.
For long trades, SafeZone subtracts the average noise level, multiplied by a facto

One of the key rules in trading is never move your stops in such a way that your risk increases. Our stop sequence shows the automatic tightening of stops. They appear as a series of decreasing risk points until the trade is eventually stopped out.
The problem is that if you enter a trade at any other point than the initial dot of the sequence, you may be placing the stop too close. Stop-entry plots show you the initial value for the stop for each bar. You can use them when you put on a trade,

SafeZone is a method for setting stops on the basis of recent volatility, outside the level of market noise. It is described in "Come into my Trading Room" book.
In a downtrend, SafeZone defines noise as the portion of the current bar that extends above the high of the previous bar, against the downtrend. It averages the noise level over a period of time and multiplies it by a trader-selected factor. For short trades, it adds the average noise level, multiplied by a factor, to the latest high

One of the key rules in trading is never move your stops in such a way that your risk increases. Our stop sequence shows the automatic tightening of stops. They appear as a series of decreasing risk points until the trade is eventually stopped out.
The problem is that if you enter a trade at any other point than the initial dot of the sequence, you may be placing the stop too close. Stop-entry plots show you the initial value for the stop for each bar. You can use them when you put on a trade,

The Smoothed ROC indicator, developed by Fred Schutzman, is described in "Trading for a Living" book. It is created by calculating the rate of change for an exponential moving average of closing prices. When it changes direction, it helps identify and confirm trend changes. Parameters Smoothing_EMA_Length (13) – The length of the EMA used for smoothing; ROC_Period (21) – The length of the rate of change calculation.

The Reverse Bar indicator paints the reversal bars according to trade strategy, described by Bill Williams in "Trading Chaos. Maximize Profits with Proven Technical Techniques" book. The bearish reversal bar has red or pink color (red-stronger signal) The bullish reversal bar has blue or light blue color(blue - stronger signal) It is recommended to use it on hourly timeframe (H1) and higher.
Este indicador scalper mostra os momentos, quando você pode ganhar com segurança 10 pontos de lucro e risco de apenas 2 pontos. Ele permite aumentar consideravelmente o depósito durante o dia, se a gestão do dinheiro for propriamente usada.
O indicador tem apenas um parâmetro de entrada - número de barras, utilizado para o cálculo da tendência. Quando o sinal aparecer, coloque a ordem pendente no preço, dois pontos a mais que o preço atual (para comprar) ou 2 pontos menor para o preço atual de

This is a trend indicator, as you can see here. When the white line is above the red, it means a bull market. Conversely, the white line below the red line is a bear market. This index is suitable for long - term trading and is suitable for most trading varieties. --------------------------------------------------------------------------------------------

This indicator let user clearly see Buy/Sell signals. When a bar is closed and conditions meet, arrow signal will come up at Close Price, up is Buy and down is Sell. It works on all Timeframes. And you can set sound alert when signals come up.

This indicator is based on a classic Moving Average indicator. Moving averages help us to first define the trend and second, to recognize changes in the trend. Multi TimeFrame indicator MTF-MA shows MA data from the 4 timeframes by your choice. By default this indicator has external parameters: TF1 = 1; TimeFrame2b = true; TF2 = 5; TimeFrame3b = true; TF3 = 15; TimeFrame4b = true; TF4 = 60; InpPSARStep = 0.02; InpPSARMaximum = 0.2; You can change TF1-TF4 in the next limits: TF1 from M1 (1) to H4

This indicator is based on a classic Commodity Channel Index (CCI) indicator. Multi TimeFrame indicator MTF-CCI shows CCI data from the 4 timeframes by your choice. By default this indicator has external parameters: TF1 = 1; TimeFrame2b = true; TF2 = 5; TimeFrame3b = true; TF3 = 15; TimeFrame4b = true; TF4 = 60; InpPeriod = 13; InpPRICE = 5; You can change TF1-TF4 in the next limits: TF1 from M1 (1) to H4 (240) TF2 from M5 (5) to D1 (1440) TF3 from M15 (15) to W1 (10080) TF4 from M30 (30) to MN1
This indicator is based on a classic Momentum indicator. Multi TimeFrame indicator MTF-Momentum shows data from the 4 timeframes by your choice. By default this indicator has external parameters: TF1 = 1; TimeFrame2b = true; TF2 = 5; TimeFrame3b = true; TF3 = 15; TimeFrame4b = true; TF4 = 60; InpPeriod = 14; InpappPRICE = 0; You can change TF1-TF4 in the next limits: TF1 from M1 (1) to H4 (240) TF2 from M5 (5) to D1 (1440) TF3 from M15 (15) to W1 (10080) TF4 from M30 (30) to MN1 (43200) All chos

This indicator is based on a classic DeMarker indicator. Multi TimeFrame indicator MTF-DeMarker shows data from the 4 timeframes by your choice. By default this indicator has external parameters: TF1 = 1; TimeFrame2b = true; TF2 = 5; TimeFrame3b = true; TF3 = 15; TimeFrame4b = true; TF4 = 60; InpPeriod = 14; You can change TF1-TF4 in the next limits: TF1 from M1 (1) to H4 (240) TF2 from M5 (5) to D1 (1440) TF3 from M15 (15) to W1 (10080) TF4 from M30 (30) to MN1 (43200) All chosen TFs should be

This indicator shows Pin Bar candlestick pattern on the chart.
The bearish pin bars have red color, the bullish pin bars have blue color. The indicator shows alert when Pin Bar candlestick pattern is formed. It's recommended to use it at timeframes H1 and higher. The best moment (strong signal) is when Pin Bar is formed close to the support/resistance level.
This version of Stochastic evaluates the probability of taking the specified profit in points. The appropriate value is set in the parameters, and the product automatically shows possible options for the market it is currently applied to. There are much more options and the information is more extensive compared to conventional Stochastic (see the screenshots). Signals: The yellow channel is absent (flat movement, market entry is not recommended). The yellow channel is narrowing (trend is formin

Spearman Rank Correlation indicator featuring enhanced entry and reverse signals Any overbought or oversold zone can be adjusted using Cross Buy or Cross Sell levels (Option 1 = true; Cross Buy and Cross Sell are set by user, if Option 1 = false, it means that this option of generating signals is not applicable). The signals can be generated by crossing over the 0 level, this is Option 2. Please note that there are no reverse levels attached to this option. This option is set up as supplementary
Média móvel ponderada por volume (VW-MA) é uma média móvel ponderada por volume.
As médias móveis padrão usam preços e simplesmente ignoram os volumes negociados. O indicador de média móvel ponderada por volume responde a isso.
Observe que, ao contrário do mercado de ações, o mercado de câmbio não é centralizado. Ordens e volumes não são compartilhados entre corretores. Como consequência, os volumes usados na Média Móvel Ponderada por Volume dependem do seu corretor. No entanto, as contas E

MACD ponderado por volume Volume Weighted MACD (VW-MACD) foi criado por Buff Dormeier e descrito em seu livro Investing With Volume Analysis. Representa a convergência e a divergência das tendências de preços ponderadas por volume.
A inclusão de volume permite que o VW-MACD seja geralmente mais responsivo e confiável do que o MACD tradicional.
O que é MACD (Moving Average Convergence Divergence)?
A divergência de convergência média móvel foi criada por Gerald Appel em 1979. O MACD pad

This indicator is used to compare the relative strength of the trade on the chart against the other several selected symbols.
By comparing the price movement of each traded variety based on the same base day, several trend lines of different directions can be seen, reflecting the strong and weak relationship between the several different traded varieties, so that we can have a clearer understanding of the market trend. For example, you can apply this indicator on a EurUSD chart and compare it
Tails is an indicator that predicts where the price will rebound and reach in a day candle. This indicator does not repaint and is to be used in time frames below D1. By default, the indicator will plot two support and two resistance lines. If needed, you can set the extended levels to "true" to show three support and three resistance lines. Input Parameters Extended_Levels - show extended levels in the chart; Clr_Support - color for the support lines; Clr_Resistance - color for the resistance

The indicator displays the "Three white soldiers and Three black crows" candlestick model on a chart. Three white soldiers are color in blue. Three black crows are colored in red. Input parameters: Max Bars - maximum number of bars calculated on the chart. Make Signal Alert - use alert. Type of pattern rules - use a strict model of determining the pattern (short lower shadows for the three soldiers, short upper shadows for the three crows), or a simplified model. Max Shadow Ratio - coefficient o
Только что открыли позицию, а цена резко пошла в другую сторону..Что делать? Просто потерпеть, усредниться или отстопиться (закрыться) и снова войти в сделку, но уже в противоположную сторону? Как поступить...а может просто снимать сливки и торговать по разворотным импульсам ….в этом Вам поможет и подскажет Индикатор тенденций и разворотов на базе коллекции паттернов советника ReversMartinTral https://www.mql5.com/ru/market/product/28761
который кроме рекомендаций и сигналов реверса вклю

Появилось желание торговать движение, пробой на самой высокой волатильности, или запустить советника-усреднителя торговать боковик в тихой низковолатильной гавани тогда этот продукт для Вас! Индикатор анализирует 28 валютных пар (основные и кроссы) и в зависимости от выбранных настроек покажет самые высоковолатильные (max) или наоборот (min). Как измерить волатильность? Существует 2 способа. Первый это измерить рендж заданного количества последних баров (bar). Второй замерить

The indicator displays the "Morning star" and "Evening star" patterns on a chart.
The Evening star is displayed in red or rose. The Morning star is displayed in blue or light blue.
Input Parameters: Max Bars – number of bars calculated on the chart. Make Signal Alert – use alerts. Send Push Notification - send notification to a mobile terminal Type of rules pattern – type of the model of pattern determination (Hard – with the control of length of shadows of the second bar). If Soft is select

The indicator displays the dynamics of forming the daily range in the form of a histogram, and the average daily range for a specified period. The indicator is a useful auxiliary tool for intraday trades.
Settings N Day - period for calculation of the daily range value. Level Indefinite - level of indefiniteness. Level Confidence - level of confidence. Level Alert - alert level. When it is crossed, the alert appears.

O principal objetivo do indicador é detectar e marcar sinais de negociação no histograma do Awesome Oscillator de acordo com as estratégias de "Trading Chaos, second edition" e "New Trading Dimensions". O indicador detecta e marca os seguintes sinais de negociação: "Two peaks" (dois topos) - divergência. O sinal do "Second wise-man" (Segundo homem sábio) - terceiro barra consequente do indicador Awesome Oscillator após a sua cor ter sido alterada. O histograma cruza a linha zero. O sinal "Saucer

O principal objetivo do indicador é determinar e marcar sinais de negociação no histograma do Accelerator Oscillator, que foram descritos por Bill Williams em seu livro "New Trading Dimensions". A lista de sinais: O sinal de compra quando o histograma do indicador está abaixo da linha zero. O sinal de venda quando o histograma do indicador está abaixo da linha zero. O sinal de venda quando o histograma do indicador está acima da linha de zero. O sinal de compra quando o histograma do indicador e
Twiggs Money Flow Index foi criado por Collin Twiggs. É derivado do Chaikin Money Flow Index, mas usa intervalos reais em vez de máximos menos mínimos para evitar picos devido a lacunas. Ele também está usando uma média móvel exponencial de suavização para evitar que picos de volumes alterem os resultados. A média móvel exponencial é aquela descrita por Welles Wilder para muitos de seus indicadores.
Quando o Twiggs Money Flow Index está acima de 0, os jogadores estão acumulando e, portanto, o
O Índice de Fluxo de Dinheiro é um indicador de múltiplos períodos de tempo que exibe o Índice de Fluxo de Dinheiro de qualquer período de tempo.
Isso ajuda você a se concentrar no fluxo de dinheiro de longo prazo antes de usar o fluxo de dinheiro do período atual.
Você pode adicionar tantos índices de fluxo de dinheiro - vários períodos de tempo quanto desejar. Consulte as capturas de tela para ver os índices de fluxo de dinheiro M30 / H1 / H4 na mesma janela, por exemplo.
O Mercado MetaTrader contém robôs de negociação e indicadores técnicos para traders, disponíveis diretamente no terminal.
O sistema de pagamento MQL5.community está disponível para todos os usuários registrados do site do MQL5.com para transações em todos os Serviços MetaTrader. Você pode depositar e sacar dinheiro usando WebMoney, PayPal ou um cartão de banco.
Você está perdendo oportunidades de negociação:
- Aplicativos de negociação gratuitos
- 8 000+ sinais para cópia
- Notícias econômicas para análise dos mercados financeiros
Registro
Login
Se você não tem uma conta, por favor registre-se
Para login e uso do site MQL5.com, você deve ativar o uso de cookies.
Ative esta opção no seu navegador, caso contrário você não poderá fazer login.