Articles with MQL5 programming examples
Access a huge collection of articles with code examples showing how to create indicators and trading robots for the MetaTrader platform in the MQL5 language. Source codes are attached to the articles, so you can open them in MetaEditor and run them to see how the applications work.
These articles will be useful both for those who have just started exploring automated trading and for professional traders with programming experience. They feature not only examples, but also contain new ideas.
Add a new article

You are missing trading opportunities:
- Free trading apps
- Over 8,000 signals for copying
- Economic news for exploring financial markets
Registration
Log in
You agree to website policy and terms of use
If you do not have an account, please register

Ready-made templates for including indicators to Expert Advisors (Part 2): Volume and Bill Williams indicators
In this article, we will look at standard indicators of the Volume and Bill Williams' indicators category. We will create ready-to-use templates for indicator use in EAs - declaring and setting parameters, indicator initialization and deinitialization, as well as receiving data and signals from indicator buffers in EAs.

ALGLIB numerical analysis library in MQL5
The article takes a quick look at the ALGLIB 3.19 numerical analysis library, its applications and new algorithms that can improve the efficiency of financial data analysis.

How to create a simple Multi-Currency Expert Advisor using MQL5 (Part 6): Two RSI indicators cross each other's lines
The multi-currency expert advisor in this article is an expert advisor or trading robot that uses two RSI indicators with crossing lines, the Fast RSI which crosses with the Slow RSI.

Data label for time series mining (Part 6):Apply and Test in EA Using ONNX
This series of articles introduces several time series labeling methods, which can create data that meets most artificial intelligence models, and targeted data labeling according to needs can make the trained artificial intelligence model more in line with the expected design, improve the accuracy of our model, and even help the model make a qualitative leap!

Ready-made templates for including indicators to Expert Advisors (Part 1): Oscillators
The article considers standard indicators from the oscillator category. We will create ready-to-use templates for their use in EAs - declaring and setting parameters, indicator initialization and deinitialization, as well as receiving data and signals from indicator buffers in EAs.

Introduction to MQL5 (Part 2): Navigating Predefined Variables, Common Functions, and Control Flow Statements
Embark on an illuminating journey with Part Two of our MQL5 series. These articles are not just tutorials, they're doorways to an enchanted realm where programming novices and wizards alike unite. What makes this journey truly magical? Part Two of our MQL5 series stands out with its refreshing simplicity, making complex concepts accessible to all. Engage with us interactively as we answer your questions, ensuring an enriching and personalized learning experience. Let's build a community where understanding MQL5 is an adventure for everyone. Welcome to the enchantment!

Implementation of the Augmented Dickey Fuller test in MQL5
In this article we demonstrate the implementation of the Augmented Dickey-Fuller test, and apply it to conduct cointegration tests using the Engle-Granger method.
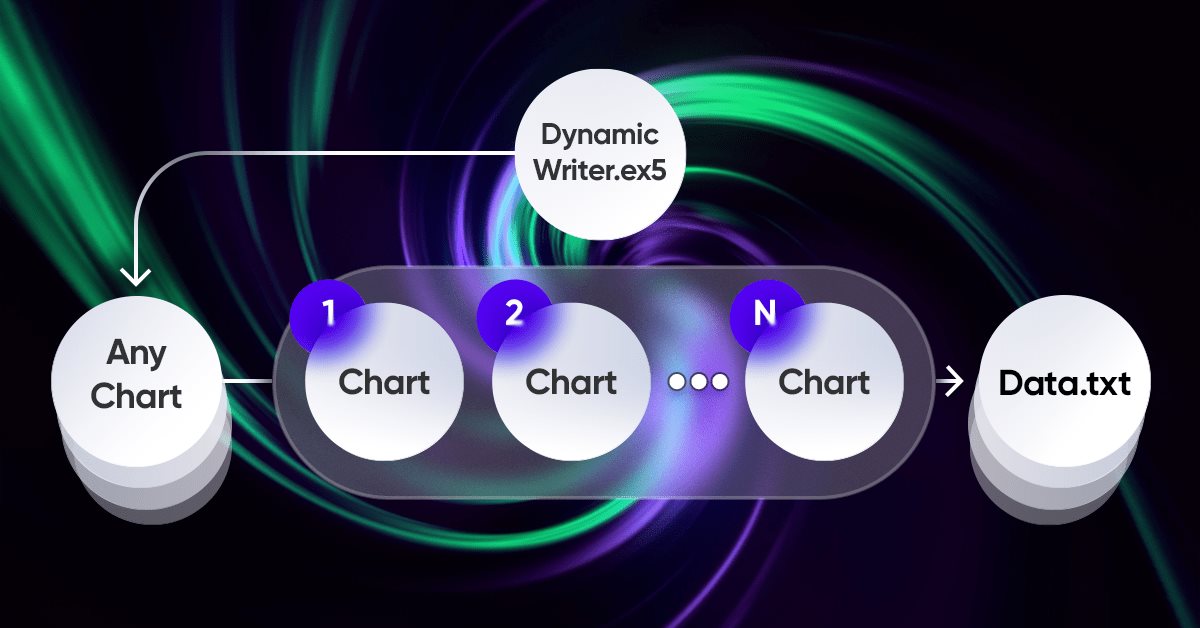
Making a dashboard to display data in indicators and EAs
In this article, we will create a dashboard class to be used in indicators and EAs. This is an introductory article in a small series of articles with templates for including and using standard indicators in Expert Advisors. I will start by creating a panel similar to the MetaTrader 5 data window.
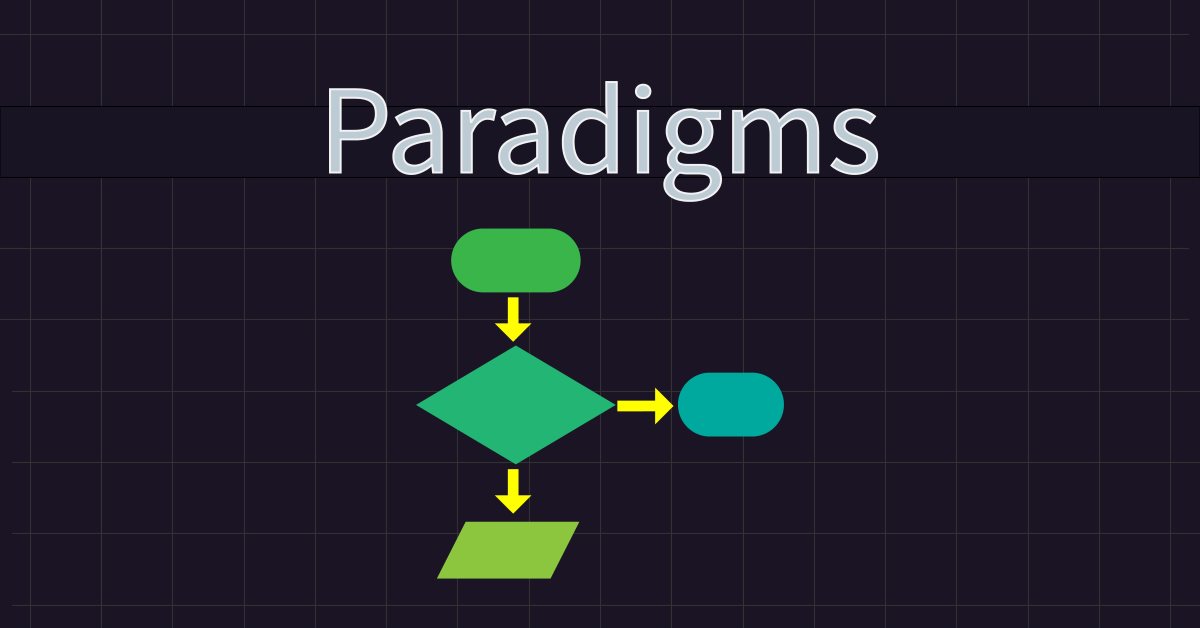
Understanding Programming Paradigms (Part 1): A Procedural Approach to Developing a Price Action Expert Advisor
Learn about programming paradigms and their application in MQL5 code. This article explores the specifics of procedural programming, offering hands-on experience through a practical example. You'll learn how to develop a price action expert advisor using the EMA indicator and candlestick price data. Additionally, the article introduces you to the functional programming paradigm.
Brute force approach to patterns search (Part VI): Cyclic optimization
In this article I will show the first part of the improvements that allowed me not only to close the entire automation chain for MetaTrader 4 and 5 trading, but also to do something much more interesting. From now on, this solution allows me to fully automate both creating EAs and optimization, as well as to minimize labor costs for finding effective trading configurations.

Filtering and feature extraction in the frequency domain
In this article we explore the application of digital filters on time series represented in the frequency domain so as to extract unique features that may be useful to prediction models.

Data label for time series mining (Part 4):Interpretability Decomposition Using Label Data
This series of articles introduces several time series labeling methods, which can create data that meets most artificial intelligence models, and targeted data labeling according to needs can make the trained artificial intelligence model more in line with the expected design, improve the accuracy of our model, and even help the model make a qualitative leap!

Developing a Replay System — Market simulation (Part 17): Ticks and more ticks (I)
Here we will see how to implement something really interesting, but at the same time very difficult due to certain points that can be very confusing. The worst thing that can happen is that some traders who consider themselves professionals do not know anything about the importance of these concepts in the capital market. Well, although we focus here on programming, understanding some of the issues involved in market trading is paramount to what we are going to implement.

Trade transactions. Request and response structures, description and logging
The article considers handling trade request structures, namely creating a request, its preliminary verification before sending it to the server, the server's response to a trade request and the structure of trade transactions. We will create simple and convenient functions for sending trading orders to the server and, based on everything discussed, create an EA informing of trade transactions.

Developing a quality factor for Expert Advisors
In this article, we will see how to develop a quality score that your Expert Advisor can display in the strategy tester. We will look at two well-known calculation methods – Van Tharp and Sunny Harris.

Developing a Replay System — Market simulation (Part 11): Birth of the SIMULATOR (I)
In order to use the data that forms the bars, we must abandon replay and start developing a simulator. We will use 1 minute bars because they offer the least amount of difficulty.


Developing a Replay System — Market simulation (Part 10): Using only real data for Replay
Here we will look at how we can use more reliable data (traded ticks) in the replay system without worrying about whether it is adjusted or not.

Developing a Replay System — Market simulation (Part 09): Custom events
Here we'll see how custom events are triggered and how the indicator reports the state of the replay/simulation service.

Permuting price bars in MQL5
In this article we present an algorithm for permuting price bars and detail how permutation tests can be used to recognize instances where strategy performance has been fabricated to deceive potential buyers of Expert Advisors.

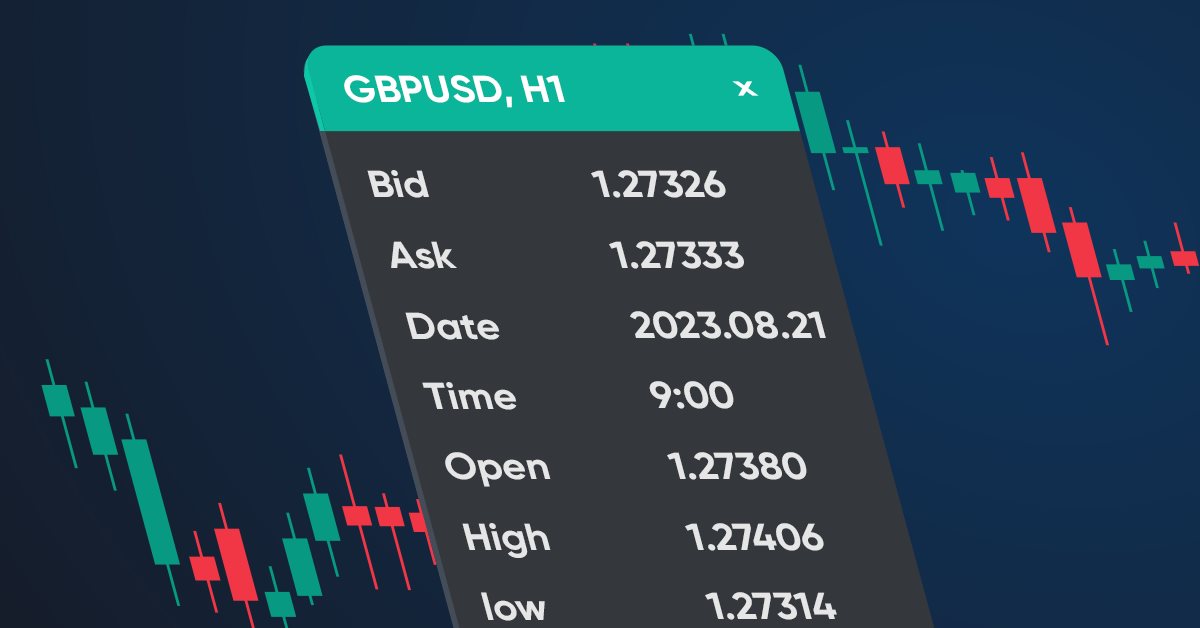
Structures in MQL5 and methods for printing their data
In this article we will look at the MqlDateTime, MqlTick, MqlRates and MqlBookInfo strutures, as well as methods for printing data from them. In order to print all the fields of a structure, there is a standard ArrayPrint() function, which displays the data contained in the array with the type of the handled structure in a convenient tabular format.

StringFormat(). Review and ready-made examples
The article continues the review of the PrintFormat() function. We will briefly look at formatting strings using StringFormat() and their further use in the program. We will also write templates to display symbol data in the terminal journal. The article will be useful for both beginners and experienced developers.

Alternative risk return metrics in MQL5
In this article we present the implementation of several risk return metrics billed as alternatives to the Sharpe ratio and examine hypothetical equity curves to analyze their characteristics.

Classification models in the Scikit-Learn library and their export to ONNX
In this article, we will explore the application of all classification models available in the Scikit-Learn library to solve the classification task of Fisher's Iris dataset. We will attempt to convert these models into ONNX format and utilize the resulting models in MQL5 programs. Additionally, we will compare the accuracy of the original models with their ONNX versions on the full Iris dataset.

Studying PrintFormat() and applying ready-made examples
The article will be useful for both beginners and experienced developers. We will look at the PrintFormat() function, analyze examples of string formatting and write templates for displaying various information in the terminal log.

How to create a simple Multi-Currency Expert Advisor using MQL5 (Part 2): Indicator Signals: Multi Timeframe Parabolic SAR Indicator
The Multi-Currency Expert Advisor in this article is Expert Advisor or trading robot that can trade (open orders, close orders and manage orders for example: Trailing Stop Loss and Trailing Profit) for more than 1 symbol pair only from one symbol chart. This time we will use only 1 indicator, namely Parabolic SAR or iSAR in multi-timeframes starting from PERIOD_M15 to PERIOD_D1.

GUI: Tips and Tricks for creating your own Graphic Library in MQL
We'll go through the basics of GUI libraries so that you can understand how they work or even start making your own.

Developing a Replay System — Market simulation (Part 08): Locking the indicator
In this article, we will look at how to lock the indicator while simply using the MQL5 language, and we will do it in a very interesting and amazing way.

Developing a Replay System — Market simulation (Part 07): First improvements (II)
In the previous article, we made some fixes and added tests to our replication system to ensure the best possible stability. We also started creating and using a configuration file for this system.
Evaluating ONNX models using regression metrics
Regression is a task of predicting a real value from an unlabeled example. The so-called regression metrics are used to assess the accuracy of regression model predictions.

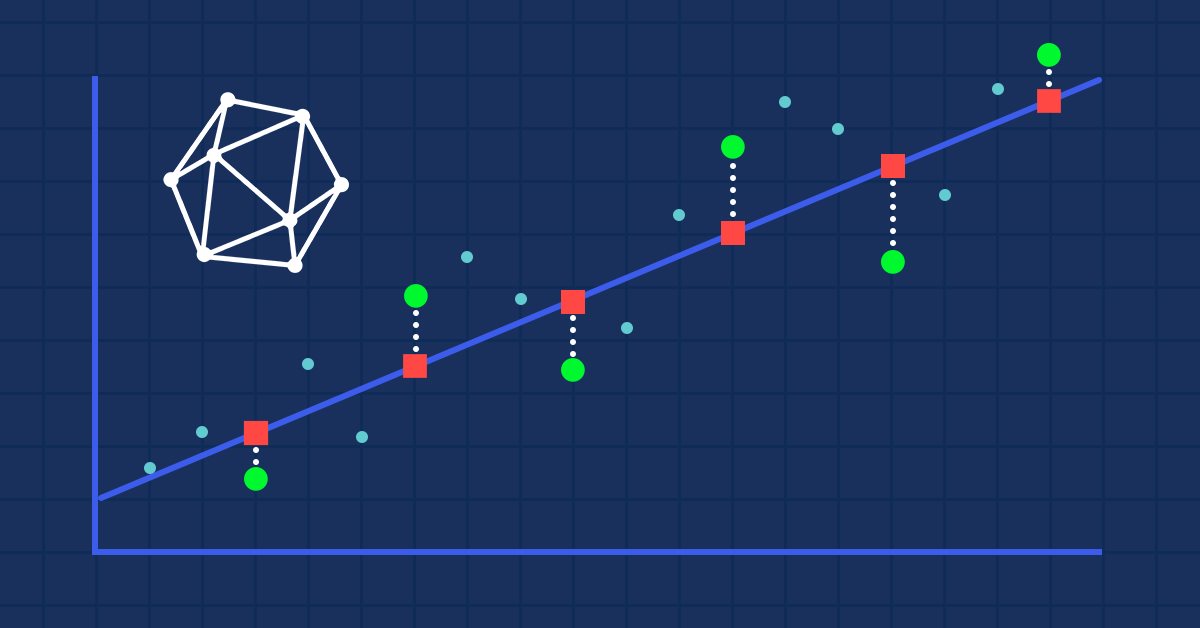
Elastic net regression using coordinate descent in MQL5
In this article we explore the practical implementation of elastic net regression to minimize overfitting and at the same time automatically separate useful predictors from those that have little prognostic power.

How to create a simple Multi-Currency Expert Advisor using MQL5 (Part 1): Indicator Signals based on ADX in combination with Parabolic SAR
The Multi-Currency Expert Advisor in this article is Expert Advisor or trading robot that can trade (open orders, close orders and manage orders an more) for more than 1 symbol pair only from one symbol chart.
DoEasy. Controls (Part 32): Horizontal ScrollBar, mouse wheel scrolling
In the article, we will complete the development of the horizontal scrollbar object functionality. We will also make it possible to scroll the contents of the container by moving the scrollbar slider and rotating the mouse wheel, as well as make additions to the library, taking into account the new order execution policy and new runtime error codes in MQL5.

Monte Carlo Permutation Tests in MetaTrader 5
In this article we take a look at how we can conduct permutation tests based on shuffled tick data on any expert advisor using only Metatrader 5.

Developing a Replay System — Market simulation (Part 05): Adding Previews
We have managed to develop a way to implement the market replay system in a realistic and accessible way. Now let's continue our project and add data to improve the replay behavior.

Wrapping ONNX models in classes
Object-oriented programming enables creation of a more compact code that is easy to read and modify. Here we will have a look at the example for three ONNX models.

Developing a Replay System — Market simulation (Part 04): adjusting the settings (II)
Let's continue creating the system and controls. Without the ability to control the service, it is difficult to move forward and improve the system.

Developing a Replay System — Market simulation (Part 03): Adjusting the settings (I)
Let's start by clarifying the current situation, because we didn't start in the best way. If we don't do it now, we'll be in trouble soon.

MQL5 — You too can become a master of this language
This article will be a kind of interview with myself, in which I will tell you how I took my first steps in the MQL5 language. I will show you how you can become a great MQL5 programmer. I will explain the necessary bases for you to achieve this feat. The only prerequisite is a willingness to learn.

Category Theory in MQL5 (Part 11): Graphs
This article is a continuation in a series that look at Category Theory implementation in MQL5. In here we examine how Graph-Theory could be integrated with monoids and other data structures when developing a close-out strategy to a trading system.

Creating an EA that works automatically (Part 15): Automation (VII)
To complete this series of articles on automation, we will continue discussing the topic of the previous article. We will see how everything will fit together, making the EA run like clockwork.