
Developing a Replay System — Market simulation (Part 05): Adding Previews

Introduction
In the earlier article entitled "Developing a Replay System - — Market simulation (Part 02): First experiments (II)", we managed to develop a way to implement the market replay system in a realistic and accessible way. In this method, each 1-minute bar is created within one minute. We still need to make some minor adjustments, but more on that later. This step is very important to consider the system capable of simulating the market replay.
Although we managed to do this, it seems our replay system is not adequate enough to explore and practice for a certain operation system. This way we cannot have a pre-analysis of the previous data (be it minutes, hours or days), which is why we cannot actually have something viable.
When we mention pre-analysis, we mean the possibility of having bars that preceded the moment when the system creates bars from a certain point. Without these earlier bars, it is impossible to get reliable information from any indicator.
You can think of it this way: we have a file with all trading ticks executed on a certain day. However, using only the contents of this file, we will not be able to get really useful information from any indicator. Even if we use, for example, a 3-period moving average, which is exactly what is used in the JOE DI NAPOLI system, the signal will not be generated until at least 3 bars are created. Only after that, the moving average will be displayed on the chart. From the point of view of practical application, until today, this system is completely useless and inoperable.
Let's imagine a situation in which we want to conduct research in a 5-minute time frame. We will need to wait 15 minutes for the 3-period moving average to appear on the chart. It will take a few more minutes before any useful signals appear. That is, the system needs to be updated, and the purpose of this article is to discuss how to do this update.
Understanding some details
The implementation part is quite simple and can be done relatively quickly. But before writing even one line of code, we need to consider one more thing.
The question that needs to be considered, oddly enough, is: What chart period are we going to use in the replay and what is the minimum period required for each indicator to generate useful information? These questions are very important and require competent answers. There is no standard model, it all depends on how we are going to conduct our analysis with the market replay.
But if we correctly answer these questions, then we won't be limited just to replay. We can also create a market simulator, which is much more interesting. However, it follows the same operating principles as the replay. The only real difference between the replay and the simulator is the data source (TICKS or BARS) used to create the study.
In the case of the replay, the data is real, while in the case of a simulator, the data is synthesized in some way, either based on a mathematical model, or purely arbitrary. In the case of the simulator, something very interesting arises. Many companies and even experienced traders use mathematical methods to create a special type of study called a stress test, in which they simulate market movements in order to predict possible extreme movements under various scenarios. However, we will consider this question later since it involves aspects that have not yet been explained.
But don't worry, in the future, when this replay system is at a more advanced stage, I will explain how you can "create" such data. But right now, we are going to focus on how to use real market data, i.e. the replay.
To determine the number of previous bars needed in our replay, we need to perform a fairly simple calculation:
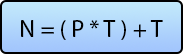
where N is the required number of bars, P is the largest period we will use or need for the average or indicator to start providing useful information, and T is the number of minutes in the chart period. To make it clearer, let's see the examples below:
Example 1
Suppose we are going to use a 200-period moving average and a 5-minute time frame on the chart. What is the minimum bar value required on the chart?
n = ( 200 * 5 ) + 5
This is equal to 1005, i.e. before the replay starts, you need to have at least 1005 1-minute bars in order to be able to build an average of 200. This refers to using a chart timeframe equal to or less than 5 minutes. Thus, the average value will appear at the very beginning of replay.
Example 2
For research, we want to use a 21-period moving average, a 50-period moving average, an RSI set to 14 periods, and an intraday VWAP. We will be doing research on 5 and 15 minute timeframes. However, from time to time we will check the 30-minute timeframe to confirm entry or exit trades. What is the minimum number of bars we need to have before we start replay?
For an inexperienced person, this situation may seem complicated, but in fact it is quite simple, but it requires attention to detail. Let's figure out how to calculate the minimum number of bars. First, we need to find the largest period that will be used in moving averages or indicators. In this case the value is 50 because VWAP is a time independent indicator and we don't need to worry about it. This is the first point. Now let's check the timeframe. In this case, we should use 30 as it is the longest of the three that can be used. Even if the 30-minute chart is used only once, it should be considered as the minimum value. Then the calculation will look like this:
n = ( 50 * 30 ) + 30
This is equal to 1530, i.e. you need to have at least 1530 1-minute bars before starting actual replay
Although this seems like a lot, in fact this value is still far from what may be required in more extreme cases. However, the idea is that we should always have a much larger amount of data than many consider necessary for research or analysis.
Now there is another question. Usually on the B3 (Brazilian Stock Exchange), the trading session (trading period) takes place in several stages and with different time windows for some asset classes. Futures markets usually start trading at 9:00 am and end at 6:00 pm, but at certain times of the year this period is extended to 6:30 pm, while the stock market is open from 10:00 am to 6:00 pm. Other markets and assets have their own specific opening hours. Therefore, before bidding, it is necessary to check these parameters. Here is why. Due to the fact that B3 has a trading window, you will often need to upload several days of data to get the calculated minimum number of bars.
Important note: Although we are counting the number of bars, do not forget that the bars are generated by trading ticks, i.e. the amount of data required will be much larger. To avoid confusion, I prefer to use the number of bars to simplify the explanation.
Therefore, we need a different kind of calculation. It will determine the minimum number of days to capture. We useu the following formula:
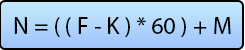
where N is the number of days, F is the full hour when the trading window closes, K is the full hour of when the trading window begins, and M is the number of fractional minutes in this window. For clarity, let's consider the following example:
Dollar futures started trading at 9:00 am and ended at 6:30 pm. How many 1-minute bars did we have that day?
n = (( 18 - 9 ) * 60 ) + 30
This is equal to 570 1 minute bars.
Usually this value is around 540 1-minute bars because the market usually closes the trading window at 6:00 pm. However, this number is not accurate, because during the day, trading can stop due to auctions, which may take place intraday. This makes things a little more complicated. But one way or another, you will have a maximum of 570 1-minute bars per trading day as futures have the biggest trading window.
Knowing this, you can divide the required number of bars by the number of daily bars that the asset will use in replication. This daily amount is an average. It will give you the minimum number of days you need to purchase for the moving averages and indicators to display correctly on the chart.
Implementation
My intention here is to motivate you to learn to build your own solutions. Maybe I came to sound repetitive, but small changes to a system can make a lot of difference. Since we will have to use a coding model, try to keep the code as fast as possible. Below is the first change:
#property service
#property copyright "Daniel Jose"
#property version   "1.00"
//+------------------------------------------------------------------+
#include <Market Replay\C_Replay.mqh>
//+------------------------------------------------------------------+
input string    user00 = "WIN$N_M1_202108030900_202108051754";  //File with bars ( Prev. )
input string    user01 = "WINQ21_202108060900_202108061759";    //File with ticks ( Replay )
//+------------------------------------------------------------------+
C_Replay        Replay;
We've added a line that will be responsible for specifying which file contains the previous data to use. We will change this in the future, but for now it stays that way. I don't want you to get confused in the coding process. The code will be changed gradually, so that you can learn from it.
The fact that we can only specify one file means that if we need to use multiple days, we will have to force MetaTrader 5 to generate a file with multiple days built in. This sounds complicated, but it's much simpler and easier than it seems.
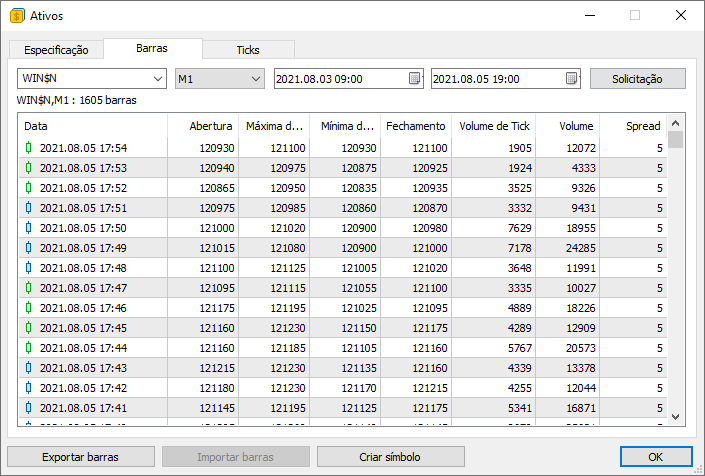
Please note in the picture above: the dates are different. Thus, we will fix all the bars we need. Don't forget that we have a total of 1605 1-minute bars captured, which gives us a wide operating range. In examples with calculations, there were less of them.
But why should we use 1 minute bars? Why can't we use 5 or 15 minute bars?
This is because when we have 1-minute bars, we can use any timeframe. The MetaTrader 5 platform will create different timeframe bars, which is very convenient as we don't have to worry about making any adjustments. Now if we use a database with 15 minute time bars for example, we won't be able to use other timeframes in a simple way. This is because we will not be able to rely on the support that the MetaTrader 5 platform provides when using 1 minute bars. For this reason, we should always preferably use 1-minute bars.
Well, it is possible to use another timeframe. But we will not discuss it here. We will see this when dealing with issues involving simulation.
But even if you don't want to capture multiple days, you can capture days separately land then merge the file together. But don't despair yet. There is another solution so you don't have to do things like this. But I will not talk about it here, in this article. The next steps in the code can be seen below:
void OnStart()
{
        ulong t1;
        int delay = 3;
        long id;
        u_Interprocess Info;
        bool bTest = false;

        Replay.InitSymbolReplay();
        Replay.LoadPrevBars(user00);
        if (!Replay.LoadTicksReplay(user01)) return;
        Print("Aguardando permissão para iniciar replay ...");
We declare some variables that the service will use. After that, we create a call to determine the symbol to be used in the replay. It is important that this call is really the first one, since everything else will be done directly inside the created symbol.
Now we are loading the previous bars. Note that there is a logical sequence here, but this feature of loading previous bars has some interesting details which we have note explored yet. For now, let's continue and see how the system boots.
After loading the previous values, if they exist, we load the traded ticks. This is the moment when we are really getting ready to replay. If everything is in order, then a message should be printed in the terminal stating that the system is in a standby state.
        id = Replay.ViewReplay();
        while (!GlobalVariableCheck(def_GlobalVariableReplay)) Sleep(750);
        Print("Permission granted. Replay service can now be used...");
        t1 = GetTickCount64();
The system will now be in this state, waiting for the replay TEMPLATE to load. The replay asset chart should also be opened and displayed. When this happens, the waiting loop will end,
because in this case, a global terminal variable will be created, providing a link between the terminal service and the control indicator. We created and discussed this indicator earlier. So. you can study it in the articles "Developing a Replay System — Market simulation (Part 03): adjusting the settings (I)" and "Developing a Replay System — Market simulation (Part 04): adjusting the settings (II)".
As soon as the control indicator loads, a message will be displayed. The user will now be able to press 'play' in the system. Finally, we capture the number of machine ticks to create a way to check how much time has passed.
After that, we enter the loop which has already been described in detail in previous articles. However, this was only the first part of the implementation. We still have other details that deserve special attention.
New class C_Replay
Oddly enough, I had to make some internal changes to the class responsible for maintaining the replay. I will gradually detail the new changes so you can understand what they are and why they were made. Let's start with variables. They are different now.
int      m_ReplayCount;
datetime m_dtPrevLoading;
long     m_IdReplay;
struct st00
{
        MqlTick Info[];
        int     nTicks;
}m_Ticks;
This new set of variables will be sufficient for our work. If you look at the above code, you will notice that the set is different now. As a result, other components have also changed. We now have a new replay symbol initialization function.
void InitSymbolReplay(void)
{
        SymbolSelect(def_SymbolReplay, false);
        CustomSymbolDelete(def_SymbolReplay);
        CustomSymbolCreate(def_SymbolReplay, StringFormat("Custom\\%s", def_SymbolReplay), _Symbol);
        SymbolSelect(def_SymbolReplay, true);
}
Let's start by removing the replay symbol from the market watch window, if present. This will only happen if this is not the symbol of the open chart.
We then delete it and create it as a custom symbol. But why do all this work? Later you will understand the reason. After creating a custom symbol, place it in the market watch window so that we can control it and place it on the chart. This initialization function will change in the future, but for now it is enough for our needs. Remember that you must first make the system work before making any changes.
The next function that has undergone changes is the loading of traded ticks.
#define macroRemoveSec(A) (A - (A % 60))
                bool LoadTicksReplay(const string szFileNameCSV)
                        {
                                int     file,
                                        old;
                                string  szInfo;
                                MqlTick tick;

                                if ((file = FileOpen("Market Replay\\Ticks\\" + szFileNameCSV + ".csv", FILE_CSV | FILE_READ | FILE_ANSI)) != INVALID_HANDLE)
                                {
                                        Print("Loading replay ticks. Wait...");
                                        ArrayResize(m_Ticks.Info, def_MaxSizeArray);
                                        old = m_Ticks.nTicks = 0;
                                        for (int c0 = 0; c0 < 7; c0++) FileReadString(file);
                                        while ((!FileIsEnding(file)) && (m_Ticks.nTicks < def_MaxSizeArray))
                                        {
                                                szInfo = FileReadString(file) + " " + FileReadString(file);
                                                tick.time = macroRemoveSec(StringToTime(StringSubstr(szInfo, 0, 19)));
                                                tick.time_msc = (int)StringToInteger(StringSubstr(szInfo, 20, 3));
                                                tick.bid = StringToDouble(FileReadString(file));
                                                tick.ask = StringToDouble(FileReadString(file));
                                                tick.last = StringToDouble(FileReadString(file));
                                                tick.volume_real = StringToDouble(FileReadString(file));
                                                tick.flags = (uchar)StringToInteger(FileReadString(file));
                                                if ((m_Ticks.Info[old].last == tick.last) && (m_Ticks.Info[old].time == tick.time) && (m_Ticks.Info[old].time_msc == tick.time_msc))
                                                        m_Ticks.Info[old].volume_real += tick.volume_real;
                                                else
                                                {
                                                        m_Ticks.Info[m_Ticks.nTicks] = tick;
                                                        m_Ticks.nTicks += (tick.volume_real > 0.0 ? 1 : 0);
                                                        old = (m_Ticks.nTicks > 0 ? m_Ticks.nTicks - 1 : old);
                                                }
                                        }
                                }else
                                {
                                        Print("Tick file ", szFileNameCSV,".csv not found...");
                                        return false;
                                }
                                return true;
                        };
#undef macroRemoveSec
First we try to open a file that should contain the ticks of completed trades. Pay attention to this stage, here we do not have any checks yet. Therefore, be careful when specifying the correct file.
The file must be located in the specified folder in the MQL5 directory. However, you don't have to specify the file extension as the default is CSV. If the file is found, we will proceed with the loading. If the file is not found, the replay service will not start and a message will appear in the message box indicating the reason for the failure.
Let's see what happens if the traded tick file is found. In this case, the first thing we will do is skip the contents of the first line of the file, which is not needed now. After that, we enter the loop to read the information. The first thing we do is capture the date and time when the tick was traded, and then save the data into a temporary location. We then capture each of the values in the correct order. Please note that we do not need to specify anything, it is enough to have the CSV file format — and MQL5 should perform reading correctly.
Now we check the following condition: if the price and time of the last trade are equal to those of the current trade, then the current volume is added to the previous one. So, for this to happen, both checks must be true.
If you notice, I don't care about the flag issue, meaning it doesn't matter if it was a buy or a sell. Other things being equal, this will not affect the replay, at least for now since the price hadn't moved. Now, if the check condition fails, we will have an indication that we are reading a different tick. In this case, we will add it to our tick matrix. One important detail: if a tick is a BID or ASK adjustment, there will be no volume in it. Therefore, we will not add a new position, and this position will be overwritten when a new tick is read. But if there is some volume, the position will be increased.
We continue this loop until the file ends or the tick limit is reached. But be careful because we don't run any tests yet. Since the system is still quite simple and the amount of data used is not big, some minor flaws can be ignored. But over time, the amount of checks in this function will increase in order to avoid problems that so far do not cost us very much.
The code for the next function is shown below.
bool LoadPrevBars(const string szFileNameCSV)
{
        int     file,
                iAdjust = 0;
        datetime dt = 0;
        MqlRates Rate[1];

        if ((file = FileOpen("Market Replay\\Bars\\" + szFileNameCSV + ".csv", FILE_CSV | FILE_READ | FILE_ANSI)) != INVALID_HANDLE)
        {
                for (int c0 = 0; c0 < 9; c0++) FileReadString(file);
                Print("Loading preview bars to Replay. Wait ....");
                while (!FileIsEnding(file))
                {
                        Rate[0].time = StringToTime(FileReadString(file) + " " + FileReadString(file));
                        Rate[0].open = StringToDouble(FileReadString(file));
                        Rate[0].high = StringToDouble(FileReadString(file));
                        Rate[0].low = StringToDouble(FileReadString(file));
                        Rate[0].close = StringToDouble(FileReadString(file));
                        Rate[0].tick_volume = StringToInteger(FileReadString(file));
                        Rate[0].real_volume = StringToInteger(FileReadString(file));
                        Rate[0].spread = (int) StringToInteger(FileReadString(file));
                        iAdjust = ((dt != 0) && (iAdjust == 0) ? (int)(Rate[0].time - dt) : iAdjust);
                        dt = (dt == 0 ? Rate[0].time : dt);
                        CustomRatesUpdate(def_SymbolReplay, Rate, 1);
                }
                m_dtPrevLoading = Rate[0].time + iAdjust;
                FileClose(file);
        }else
        {
                Print("Failed to access the previous bars data file.");
                m_dtPrevLoading = 0;
                return false;
        }
        return true;
}
The above code uploads all previous bars needed or owned by the given file into the replay. However, unlike the previous function, where it was necessary to save information for later use, here we will do it differently. We read information and immediately add it to the symbol. Follow the explanations to understand how it works.
First we will try to open a file with bars. Note that we have the same command which we used with ticks. However, the location is different and the content of the file is also different, but the way to access the information will be exactly the same. If we successfully open the file, we'll skip the first line first, since it doesn't interest us at the moment.
This time we enter the loop that will only end at the last line of the file. There is no limit to the size or amount of data in this file. As a result, all data will be read. The read data follows the OHCL model so we place it in a temporary structure. Now, pay attention to the following: how can we know at which point the replay start and where the previous bars end?
Outside of this function, it would be complicated. But here we have an exact indication of where the previous bars end and the replay begins. Precisely at this point we store this temporary position for later use. Now, notice that with each row of bars we read, we immediately update the bars contained in the replay symbol. This way we won't have any extra work later. Thus, when the previous bars have been read, we will be able to add our indicators.
Let's move on to the next function, which is pretty simple yet very important.
long ViewReplay(void)
{
        m_IdReplay = ChartOpen(def_SymbolReplay, PERIOD_M1);
        ChartApplyTemplate(m_IdReplay, "Market Replay.tpl");
        ChartRedraw(m_IdReplay);
        return m_IdReplay;
}
It opens the chart of the replay symbol in the standard 1-minute timeframe. You can use a different standard timeframe to avoid having to constantly change it.
After that, we load the template, which should contain the replay indicator. If the indicator is not in the template, we will not be able to play the service. Well, it is possible to use a different template, but in this case, we will have to manually add the replay indicator to the symbol chart to start the replay. If it suits you to do this manually, then that's fine, you are free to do so. However, by using a template with the indicator, we will have immediate access to the system, as we will force a chart update and return the chart index to check if it is available or not.
Since we are starting the system, we will also need to turn it off, and for this we have another function.
void CloseReplay(void)
{
        ChartClose(m_IdReplay);
        SymbolSelect(def_SymbolReplay, false);
        CustomSymbolDelete(def_SymbolReplay);
        GlobalVariableDel(def_GlobalVariableReplay);
}
The key point here is that the order in which actions are performed is very important. If we change the order, things might not go as expected. Therefore, we first close the symbol chart, remove it from the market watch window, remove it from the list of custom symbols, and finally remove the global variable from the terminal. After that, the replay service will close.
The following function has also undergone some changes.
inline int Event_OnTime(void)
{
        bool    bNew;
        int     mili, iPos;
        u_Interprocess Info;
        static MqlRates Rate[1];
        static datetime _dt = 0;

        if (m_ReplayCount >= m_Ticks.nTicks) return -1;
        if (bNew = (_dt != m_Ticks.Info[m_ReplayCount].time))
        {
                _dt = m_Ticks.Info[m_ReplayCount].time;
                Rate[0].real_volume = 0;
                Rate[0].tick_volume = 0;
        }
        mili = (int) m_Ticks.Info[m_ReplayCount].time_msc;
        do
        {
                while (mili == m_Ticks.Info[m_ReplayCount].time_msc)
                {
                        Rate[0].close = m_Ticks.Info[m_ReplayCount].last;
                        Rate[0].open = (bNew ? Rate[0].close : Rate[0].open);
                        Rate[0].high = (bNew || (Rate[0].close > Rate[0].high) ? Rate[0].close : Rate[0].high);
                        Rate[0].low = (bNew || (Rate[0].close < Rate[0].low) ? Rate[0].close : Rate[0].low);
                        Rate[0].real_volume += (long) m_Ticks.Info[m_ReplayCount].volume_real;
                        bNew = false;
                        m_ReplayCount++;
                }
                mili++;
        }while (mili == m_Ticks.Info[m_ReplayCount].time_msc);
        Rate[0].time = m_Ticks.Info[m_ReplayCount].time;
        CustomRatesUpdate(def_SymbolReplay, Rate, 1);
        iPos = (int)((m_ReplayCount * def_MaxPosSlider) / m_Ticks.nTicks);
        GlobalVariableGet(def_GlobalVariableReplay, Info.Value);
        if (Info.s_Infos.iPosShift != iPos)
        {
                Info.s_Infos.iPosShift = iPos;
                GlobalVariableSet(def_GlobalVariableReplay, Info.Value);
        }
        return (int)(m_Ticks.Info[m_ReplayCount].time_msc < mili ? m_Ticks.Info[m_ReplayCount].time_msc + (1000 - mili) : m_Ticks.Info[m_ReplayCount].time_msc - mili);
}
The above function creates a 1 minute bar and adds it to the replay symbol. But here we have something which we should pay attention to: Why does the replay show some things and not others?
You may have noticed that the tick volume is always zero. Why? To understand this, you need to check the documentation of "Real and generated ticks". If you read and did not understand the description or did not understand why the volume of ticks is always zero, you are ignoring an important fact. So let's try to understand why this value will always be zero.
When we read data on traded ticks, we read real ticks, i.e. the volume shown there is the real one. For example, if the order has a volume equal to 10, then this means that a trade was made with a real volume of 10 minimum required lots and not that 10 ticks were used. It is impossible to generate a volume of 1 traded tick. However, there is one situation where we do have tick volume, and that is when an order is opened and closed resulting in a volume of 2 ticks. In practice, however, our minimum tick volume is 3. Since we are using real trading ticks, we need to make an adjustment to the value presented. By this moment, I have not yet added this calculation to the replay system, so only the real value traded will actually be displayed.
It is important to be careful with this because although it seems to be the same, the real volume shows how many trades actually happened, while the tick volume shows how many moves happened.
I understand that this seems very confusing and difficult to understand right now, but in the following articles, when we get into the Forex market and discuss how to do replay and simulation in this market, everything will become clearer. Therefore, you should not try to fully understand everything now – over time you will understand this.
The last function that will be discussed in this article is shown below:
int AdjustPositionReplay()
{
        u_Interprocess Info;
        MqlRates Rate[1];
        int iPos = (int)((m_ReplayCount * def_MaxPosSlider * 1.0) / m_Ticks.nTicks);

        Info.Value = GlobalVariableGet(def_GlobalVariableReplay);
        if (Info.s_Infos.iPosShift == iPos) return 0;
        iPos = (int)(m_Ticks.nTicks * ((Info.s_Infos.iPosShift * 1.0) / def_MaxPosSlider));
        if (iPos < m_ReplayCount)
        {
                CustomRatesDelete(def_SymbolReplay, m_dtPrevLoading, LONG_MAX);
                m_ReplayCount = 0;
                if (m_dtPrevLoading == 0)
                {
                        Rate[0].close = Rate[0].open = Rate[0].high = Rate[0].low = m_Ticks.Info[m_ReplayCount].last;
                        Rate[0].tick_volume = 0;
                        Rate[0].time = m_Ticks.Info[m_ReplayCount].time - 60;
                        CustomRatesUpdate(def_SymbolReplay, Rate, 1);
                }
        };
        for (iPos = (iPos > 0 ? iPos - 1 : 0); m_ReplayCount < iPos; m_ReplayCount++) Event_OnTime();
        return Event_OnTime();
}
In this function, only one thing differs from the previous ones, and this thing will enable us to start inserting traded ticks. Thus, everything above this point is considered as a replay of real trading ticks, and below this point are values from previous bars. If we only inform a value equal to zero at this point, all the information recorded in the replay symbol would be deleted and we would have to re-read the 1-minute data bars to get the values of the previous bars. It would be redundant and much more difficult work. Therefore, all we need to do is indicate the point of the threshold, and MetaTrader 5 will remove the bars that were created by real ticks, making our life a lot easier.
Conclusion
Everything else in the function has already been described in the article Developing a Replay System — Market simulation (Part 04): adjusting the settings (II) so we won't go into this in detail here.
You can see the system in action in the video below. It demonstrates how different indicators can be added to a replay system.
Translated from Portuguese by MetaQuotes Ltd.
Original article: https://www.mql5.com/pt/articles/10704
- Free trading apps
- Over 8,000 signals for copying
- Economic news for exploring financial markets
You agree to website policy and terms of use
Dear Daniel
Thank you for your valuable and admirable work and also for sharing it with us.
Kind regards.