YouTube'dan Mağaza ile ilgili eğitici videoları izleyin
Bir ticaret robotu veya gösterge nasıl satın alınır?
Uzman Danışmanınızı
sanal sunucuda çalıştırın
sanal sunucuda çalıştırın
Satın almadan önce göstergeyi/ticaret robotunu test edin
Mağazada kazanç sağlamak ister misiniz?
Satış için bir ürün nasıl sunulur?
MetaTrader 5 için teknik göstergeler - 79

Introduction
The "Smart Money Concept" transcends mere technical trading strategies; it embodies a comprehensive philosophy elucidating market dynamics. Central to this concept is the acknowledgment that influential market participants manipulate price actions, presenting challenges for retail traders.
As a "retail trader", aligning your strategy with the behavior of "Smart Money," primarily market makers, is paramount. Understanding their trading patterns, which revolve around supply
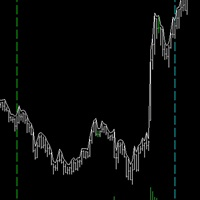
This is one of my most important indicators. Did you ever miss the session open/close? I did, which is why I made this indicator. It took a long time to get this right, since depending on your platform and timezone, it can be incorrect. It should be accurate for everyone now. It takes into account Daylight savings for NY and EU timezones, and should just work like magic on your charts.
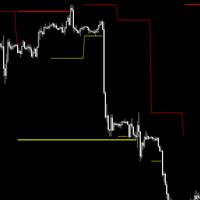
## Check screenshots to see proof that this indictor is a must! ##
Do you hate having to have a Monthly, Weekly, Daily chart when looking at your lower timeframes? I hated it too, so I made this. It will show you the High and Low of other timeframes on your chart, so you will always be aware where some support/resistance may be! Even on the 1 minute chart!
I recommend you use it 3 times, one with Day, Week and Month selected with different line widths.
I use this on every chart I look at

PMax, KivancOzbilgic tarafından 2020'nin başlarında geliştirilen yepyeni bir göstergedir. PMax, iki takip eden stoploss göstergesinin kombinasyonudur; Birincisi Anıl Özekşi'nin MOST (Hareketli Zarar Durdurma) Göstergesi Diğeri ise bilinen ATR tabanlı SuperTrend göstergesidir.
MOST ve SuperTrend Göstergeleri, trend takip sistemlerinde çok iyi olsalar da, diğer göstergeler gibi yatay piyasa koşullarında parlak performans sergilemezler. Kar Maksimizörü - PMax bu sorunu çözmeyi amaçlar. PMax, MOST

The Fat and Slim indicator tracks strong and weak money in the market. It is derived from RSI, MFI and many similar indicators. Input values are closing prices and volumes. The RSI (yellow curve) is in the range -100 ... 100. It is additionally multiplied by a coefficient so that the curve is not compressed to the middle values at higher periods (a problem with the classic RSI with different periods). Strong/Fat red curve is RSI weighted by higher volumes. Weak/Slim blue curve is calculated so t
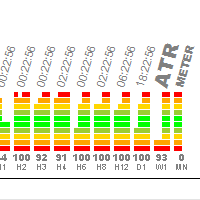
Gösterge, cihazdaki oynaklığı hızlı bir şekilde belirlemek için tasarlanmıştır. Programları değiştirirken, hangi araçların ve zaman dilimlerinin canlı ticaret olduğunu ve durgunluğun nerede gerçekleştiğini hemen anlamak çok uygundur. Gösterge, yüzdeye çevrilen ATR göstergesinin verilerini kullanır. Atr'yi grafiğe çizerseniz, ekranda yaklaşık 100-300 çubuk görünür olacak, bu değerin ortalamasını aldım ve varsayılan olarak 150'ye ayarladım (tercihlerinize bağlı olarak ayarlarda değiştirebilirsini

Go with the trend. Yes, wait for an entry signal, whether buy or sell, and enter with the price, and the profit is taken when the drawing line changes, the profit is booked, or when an opposite signal appears. It is very simple and works on all currencies, metals, indices, and on all frames. How to enter? Wait for a buy or sell signal and enter with it. You can take or reserve profit after a change appears in the drawing line or the appearance of an opposite signal.
>>> BIG SALE PROMOTION: 50% OFF + GIFT EA! - Promo price: $64 / Regular price $129 <<< - The promotion will end soon!
The Forex Trend Tracker is an advanced tool designed to enhance the trading capabilities of forex traders. This sophisticated indicator uses complex mathematical formulas alongside the Average True Range (ATR) to detect the beginnings of new upward and downward trends in the forex market. It offers visual cues and real-time alerts to give traders a competitive advantage in th

Volume plays a crucial role in trading, serving as a key indicator of market activity and investor sentiment. Here are some important roles of volume in trading:
Confirming trends: Dow Theory emphasizes the importance of volume in determining market trends. Larger volume usually indicates greater disagreement between bulls and bears, while smaller volume may indicate higher market agreement with the current price. Capturing institutional moves: By analyzing volume over a period of time, one c

Overview
In the evolving landscape of trading and investment, the demand for sophisticated and reliable tools is ever-growing. The AI Trend Navigator is an indicator designed to meet this demand, providing valuable insights into market trends and potential future price movements. The AI Trend Navigator indicator is designed to predict market trends using the k-Nearest Neighbors (KNN) classifier.
By intelligently analyzing recent price actions and emphasizing similar values, it help

The Boom300 Spike Indicator is a powerful tool designed to identify significant price spikes in the market.
Key Features: Real-time Spike Detection: The indicator continuously scans the market for sudden spikes in price action, providing timely alerts when significant spikes occur. Customizable Alerts: Traders can customize alerts to suit their preferences, including audible alerts, email notifications, and push notifications to mobile devices. User-Friendly Interface: The indicator offers a

Description: The Spike Sniper Crash Market Indicator is a sophisticated tool designed to identify and navigate volatile market conditions, often associated with sudden price spikes and market crashes. Leveraging advanced algorithms and technical analysis, this indicator serves as a vigilant guardian, alerting traders to potential market disruptions and providing actionable insights to mitigate risks and capitalize on opportunities. Key Features: Precision Spike Detection: The indicator employs c

The indicator determines the ATR value (points) in a classic way (taking into calculation paranormal bars/candles) and more correctly - ignoring paranormal movements of the Instrument. Correctly it is excluding paranormal bars from the calculation, extremely small bars (less than 5%( customizable ) of the standard ATR) and extremely large bars (more than 150% ( customizable ) of the standard ATR) are ignored. This is a Extended version - allows you to set calculation parameters a
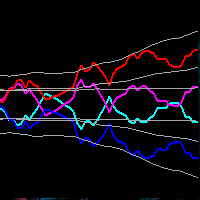
This indicator obeys the popular maxim that: "THE TREND IS YOUR FRIEND" Channel indicators incorporate volatility to capture price action. The Bollinger Bands is widely used, however, there are other options to capture swing action opportunities. Each study you will find here is unique, and reveals different types of price action.
https://www.mql5.com/en/market/product/116256
https://www.mql5.com/en/market/product/115553

MultiFractal Levels MultiFractal Levels – bu, seviyelerin eklenmesiyle değiştirilmiş bir Bill Williams fraktal göstergesidir. Fraktallar, ayarlarda izin verilen tüm TF'lerden oluşturulmuştur.
Seviyeler yalnızca henüz fiyata göre test edilmemiş en son fraktallara dayanarak oluşturulmuştur. Orijinal terminal göstergesine göre avantajları: Kolaylık Görünürlük bilgilendiricilik En son seviyeler Özelleştirilebilir fraktal Özelleştirilebilir seviyeler Gösterge kullanışlıdır çünkü çalışırken farklı z

This is the MT5 version of Ku-Chart.
This is an indicator devised by Ku-chan, a famous Japanese trader, based on the dealings of Lehman Brothers' discretionary traders. Unify the measuring stick of currencies to display the true value of currencies.
Although it is an indicator, it does not use a buffer and is displayed using objects such as trend lines. Also, instead of drawing on the subchart, it is drawn in an area far above the current price of the main chart, so you can switch from the
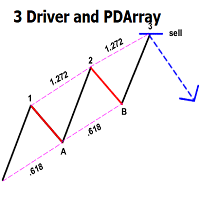
This indicator automatically identifies the SMC 3-Drive pattern and sends notifications to users when the pattern is detected. Additionally, the indicator identifies PDArray (including FVG and OB) and offers an option to combine the 3-Drive pattern with PDArray. This combination provides users with more reliable signals. What is the 3-Drive Pattern? This pattern is formed by three price pushes in one direction, providing a strong reversal signal (Figure 3). The key to identifying this pattern is

Introduction
The "Smart Money Concept" transcends the realm of mere technical trading strategies to embody a comprehensive philosophy on the dynamics of market operations. It posits that key market participants engage in price manipulation, thereby complicating the trading landscape for smaller, retail traders.
Under this doctrine, retail traders are advised to tailor their strategies in alignment with the maneuvers of "Smart Money" - essentially, the capital operated by market makers

Introducing our state-of-the-art Wave Indicator, meticulously designed for the discerning traders of the MQL5 community! At the core of this innovative tool lies an unmatched sensitivity to capture even the slightest market movements. Our Wave Indicator serves as the foundational element for constructing comprehensive trading strategies, providing you with an unwavering edge in the dynamic world of finance. Whether you're aiming to refine short-term tactics or develop long-term systems, this ind

TMA CG FAST MT4 REPLICADO PARA MT5 Cuenta con todas las caracteristicas del original con la funcion adicional de tener señal al fallo que consiste en que despues de una cantidad de velas establecida por el usuario emita una preseñal para una potencial entrada tiene alerta sonora para la posible entrada y la entrada definitiva tiene la posibilidad de repintar o no , queda a eleccion de usuario

Contact me for instruction, any questions! Introduction A flag can be used as an entry pattern for the continuation of an established trend. The formation usually occurs after a strong trending move. The pattern usually forms at the midpoint of a full swing and shows the start of moving. Bullish flags can form after an uptrend, bearish flags can form after a downtrend.
Flag Pattern Scanner Indicator It is usually difficult for a trader to recognize classic patterns on a chart, as well as sear

Contact me for instruction, any questions! Introduction V Bottoms and Tops are popular chart patterns among traders due to their potential for identifying trend reversals. These patterns are characterized by sharp and sudden price movements, creating a V-shaped or inverted V-shaped formation on the chart . By recognizing these patterns, traders can anticipate potential shifts in market direction and position themselves accordingly. V pattern is a powerful bullish/bearish reversal pattern
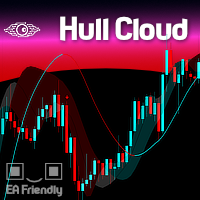
The Hull Moving Average is known for its ability to reduce lag and provide a clearer, more accurate depiction of market trends. By smoothing price data more effectively than traditional moving averages, it helps traders identify trend directions and reversals with greater precision. The Hull Cloud indicator elevates this by using four Hull Moving Averages working together like an orchestra. This combination creates a dynamic system that highlights short, medium, and long-term trends, giving trad
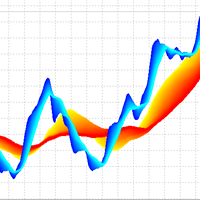
3D Trend Indicator is a non-repaint indicator using multiple moving averages with a 3D surface view. By using this indicator, you can remove uncertainties that can happen using a single and fixed moving average period. You can use a cloud area using a range of moving average periods. Also a wide range of visual settings are added to this indicator to have a better view from the cloud area. Alert and notification system added to the indicator to inform the trader about the action of candles on t
Apresentamos o Indicador de novo grafico - uma ferramenta poderosa para traders que buscam uma análise de preço suave e clara. Este indicador inovador calcula a média simples dos preços, oferecendo uma visão precisa e ajustada dos movimentos do mercado. Como Funciona : O Indicador de Média de Preços Simples (SMA) utiliza uma fórmula simples e eficaz: Ele soma o valor do último preço com o preço anterior. Em seguida, divide essa soma por 2 para obter a média. Fórmula : SMA = U ˊ ltimo Pre c ¸ o +

MinMax Levels MinMax Levels – önemli işlem dönemleri (gün, hafta ve ay) için maksimum, minimum ve açılış fiyat seviyelerinin göstergesidir.
Her Forex piyasası katılımcısı kendi ticaret sistemindeki seviyeleri kullanır. İşlem yapmak için ana sinyal veya analitik bir araç görevi gören ek bir sinyal olabilirler. Bu göstergede günler, haftalar ve aylar büyük piyasa katılımcılarının kilit işlem dönemleri olduğundan önemli dönemler olarak seçilmiştir. Bildiğiniz gibi fiyatlar seviyeden seviyeye
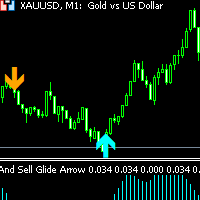
Buy and Sell Glide Arrow non-repaint and arrow appears on current candlestick orange arrow is a sell signal blue arrow is a buy signal Buy and Sell Glide Arrow works on 1 minute, 5 minutes and 15 minutes timeframes only as it is a scalping indicator. Pairs to trade: Forex pairs such as EURUSD,GBPUSD and other METALS: XAUUSD(GOLD) and other INDICES: Boom and crash 1000, Volatility Pairs such as VIX 10 - VIX 100 and other Lastly BTC AND LTC and other

If you need an indicator that shows market entry points, then this is your indicator.
The indicator is not redrawn. Shows buy and sell points for any TF (time frame) and any currency pair. Settings are adjustable for all instruments. You can configure each parameter for any broker, for any account.
This is a PILLOW that is comfortable :)) Just check it out.....

Conquistador is a fundamental technical indicator designed to assess the current market situation and determine the optimal entry and exit points in the currency pairs market with minimal risk. This indicator was created on the basis of original indicators for searching for extremes and is excellent for determining a reversal or sharp movement of the market. Thanks to Conquistador, you can recognize such moments in a timely manner and receive notifications in the form of colored dots on the cha

Description of the Indicator The indicator "BullsBearsPulse" is designed for MetaTrader 5 and provides a visual representation of the Bulls Power and Bears Power indicators. These indicators are useful tools for technical analysis, particularly for the EUR/USD currency pair, to help traders identify potential trading opportunities. Functionality Bulls Power : This indicator measures the strength of the bulls (buyers) in the market. It calculates the difference between the highest price and a 20

The Engulf Seeker indicator is a powerful tool designed to detect engulfing candlestick patterns with precision and reliability. Built on advanced logic and customizable parameters, it offers traders valuable insights into market trends and potential reversal points.
Key Features and Benefits: Utilizes revised logic to analyze previous candles and identify strong bullish and bearish engulfing patterns. Convenient arrow-based alert system notifies traders of pattern occurrences on specific symb

This spread indicator displays the actual spread of each candle. It highlights the maximum spread and the minimum spread of the chosen symbol. This indicator is very helpful to see in real time the spread evolution helping to avoid taking a trade when the spread is too high.
Inputs:
Print value in Points: if true displays the spread as a whole number
D isplay minimum and maximum spread of the past N days: select the number of days to consider the maximum and minimum spread
Automatically
=== > Bu gösterge ne işe yarar? Geçici bir zaman diliminde SMA solo ortamını izleyin
Bu gösterge, satıldığınızda öncelikle grafiklerinizi gösterir.
Bu ayarlar ve bebeğinizin özellikleri hepsi!!! **** 01'den 02'ye kadar Vedi ekran görüntüsü
Zengin veri söz konusu olduğunda kodlanacak, diğer göstergeler veya EA
Seçmek Hedef zamansal korniş Dönemin adı Bu dekalkomanya Dell'OHLC'yi tasarlarım Della tendenza'yı renklendiriyor "William210" konuşmacısı olmayan kişi başına.
=== > Bazı örnekle
=== > Bu gösterge ne işe yarar?
Zaman dilimi seçimiyle tek bir ortalama EMA çizer Bu göstergeyi çizelgelerinize ortalama EMA'ya ihtiyaç duyduğunuz sayıda bırakırsınız. Ortalamanızın parametrelerini ve özelliklerini seçin, işte bu kadar!!!
Bu ortalamayı kendi kodlarınıza kolayca entegre etmek için benden iCustom kodunu istemekten çekinmeyin
Seçmek Hedef zaman dilimi Dönem sayısı Vardiya İstenilen OHLC
Tüm yayınlarımı Codebase'de ve artık Marketplace'te "William210" adı altında bulabilirs
=== > Bu gösterge ne işe yarar? Geçici bir zaman diliminde SMMA solo ortamını izleyin
Bu gösterge, satıldığınızda öncelikle grafiklerinizi gösterir.
Bu ayarlar ve bebeğinizin özellikleri hepsi!!! **** 01'den 02'ye kadar Vedi ekran görüntüsü
Zengin veri söz konusu olduğunda kodlanacak, diğer göstergeler veya EA
Seçmek Hedef zamansal korniş Dönemin adı Bu dekalkomanya Dell'OHLC'yi tasarlarım Della tendenza'yı renklendiriyor "William210" konuşmacısı olmayan kişi başına.
=== > Bazı örnekl
=== > Bu gösterge ne işe yarar? Geçici bir zaman diliminde LWMA'nın solo ortamını izleyin
Bu gösterge, satıldığınızda öncelikle grafiklerinizi gösterir.
Bu ayarlar ve bebeğinizin özellikleri hepsi!!! **** 01'den 02'ye kadar Vedi ekran görüntüsü
Zengin veri söz konusu olduğunda kodlanacak, diğer göstergeler veya EA
Seçmek Hedef zamansal korniş Dönemin adı Bu dekalkomanya Dell'OHLC'yi tasarlarım Della tendenza'yı renklendiriyor "William210" konuşmacısı olmayan kişi başına.
=== > Bazı ör

KMeans Price Zones Detector ile ticaretin geleceğine hoş geldiniz. Bu yenilikçi MetaTrader göstergesi, makine öğreniminin gücünü kullanarak önemli fiyat bölgelerini belirler. Bu araç, fiyat verilerinde dinamik olarak merkez noktaları tespit etmek için KMeans kümeleme algoritmasını kullanır ve fiyatların destek, direnç veya konsolidasyonla karşılaşma olasılığının yüksek olduğu alanları vurgular. Yenilikçi KMeans Algoritması KMeans Price Zones Detector, desen tanımada verimliliği ve doğruluğuyla b

RAR (Relative Adaptive RSI) göstergesi ile ticaret stratejilerinizi optimize edin! Bu gelişmiş teknik analiz göstergesi, Göreceli Güç Endeksi (RSI) gücünü adaptif tekniklerle birleştirerek, yaygın bir osilatörden daha hassas ve güvenilir sinyaller sağlar. RAR Göstergesi Nedir? RAR, MetaTrader 5 için tasarlanmış bir göstergedir ve RSI'yı yumuşatmak ve dinamik olarak piyasa koşullarına uyarlamak için Üssel Hareketli Ortalamalar (EMA) ve Adaptif Hareketli Ortalamalar (AMA) kullanır. Bu yenilikçi ko
=== > Bu gösterge ne işe yarar? ATR'ye dayalı olarak Supertrend'i temsil eden bir çizgi çizer.
Seçmek ATR çoklu ATR dönemi ve hepsi bu !!! **** 01'den 2'ye kadar olan ekran görüntülerine bakın
Bu SuperTrend'i kendi kodlarınıza kolayca entegre etmek için benden iCustom kodunu istemekten çekinmeyin
=== > Bitcoin Örneği **** Ekran görüntüsü 03'e bakın
=== > Kimin için? İster isteğe bağlı bir tüccar, ister algoritmik tüccar veya geliştirici olun, gösterge ihtiyaçlarınızı karşılayacak şekild

PyNinjaTrader - NinjaTrader 8 için Sürükle ve Bırak Python API Bağlayıcısı
PyNinjaTrader, basit bir sürükle ve bırak stratejisi kullanarak Python komut dosyalarınızı NinjaTrader 8'e sorunsuz bir şekilde bağlar. Tamamen test edilmiş, hızlı ve etkili bu çözüm, stratejinin sunucu, Python betiğinin ise istemci görevi üstlendiği iletişim için websocket'leri kullanır.
Özellikler: - NinjaTrader 8 Terminaline Python girişi - Sürekli bağlantı için canlı tutma işlevi - NinjaTrader 8 hesap bilgilerini
=== > Bu gösterge ne işe yarar? Hacimce ağırlıklandırılmış hareketli bir ortalamadır, değiş tokuş edilen hacimlere göre hassas bir yumuşatmadır.
Zaman dilimi seçimiyle tek bir WWMA ortalamasını çizer
Bu göstergeyi çizelgelerinize ortalamaya ihtiyacınız olduğu kadar bırakırsınız.
Ortalamanızın parametrelerini ve özelliklerini seçin, işte bu kadar!!! **** 01'den 02'ye kadar Vedi ekran görüntüsü
Zengin veri söz konusu olduğunda kodlanacak, diğer göstergeler veya EA
Seçmek Hedef zamansal
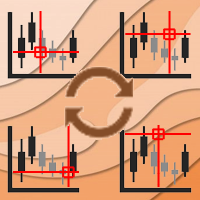
Async Charts is an indicator to synchronize charts and display a customized crosshair (cursor) on all selected charts. This is a useful utility for traders using multiple timeframes of analyzing multiple symbols for trade entry or exit.
Main Features : Real time Crosshair Synchronization on All Selected Charts
Supports Multiple Timeframes and Multiple Symbols at the same time
Auto Scroll Option
Graphical Adjustment of Color, Font, Size, ...
Locking All or Locking Specific Charts
More and

MSnR Lines , bir grafikte destek ve direnç seviyelerini göstermek için tasarlanmış özel bir göstergedir. Bu seviyeler, Malezya Destek ve Direnç teorisine dayanarak, alanlar olarak değil, belirli fiyat seviyeleri olarak tanımlanan zirve ve vadilerden türetilmiştir. Özellikler: Üç tür seviye: A-Level, V-Level ve Boşluk Seviyesi. Seviyeler için tazelik göstergesi: Taze seviyeler taze olmayan seviyelerden daha önemlidir. Taze ve taze olmayan seviyeler için özelleştirilebilir renk ve stil. Yalnızca t

Индикатор тиковых объемов представляет собой инструмент технического анализа, используемый для оценки активности трейдеров на рынке. Этот индикатор отображает количество тиков (изменений цен) за определенный временной период и показывает преобладание тиков, направленных на покупку или продажу.
Основные характеристики и функции индикатора тиковых объемов: Гистограмма объемов:
Белый цвет: Означает преобладание тиков, направленных на покупку. Когда количество покупок превышает количество прода
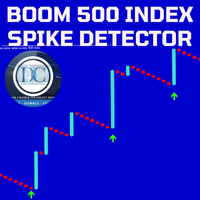
Our Spike Detector is specifically engineered to cater to the unique needs of traders in the Boom and Crash indices markets. This tool is optimized for M1 (1-minute) and M5 (5-minute) timeframes, ensuring you receive timely and actionable insights.
Key Features:
1. Non-Repainting**: Our detector guarantees accuracy with non-repainting signals, ensuring your data remains consistent and reliable. 2. Push Notifications**: Stay updated with real-time push notifications, so you never miss a cr
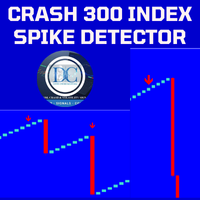
Spike Detector for Boom and Crash Indices
The Spike Detector is specifically designed to cater to the unique needs of traders in the Boom and Crash indices markets. Optimized for M1 (1-minute) and M5 (5-minute) timeframes, this tool ensures you receive timely and actionable insights. Below, you'll find a comprehensive guide on its key features, advantages, installation process, and how to use it effectively.
Key Features and Advantages
1. Non-Repainting: The Spike Detector guarantees accu

** Attention! This indicator is a market tool that can lead to substantial losses; use it at your own risk ** Operation: Histograms with positive or negative values, where positive means possible strength of the current movement, and negative means possible weakness. Colors: red indicates relative strength to the downside, green indicates an upward movement, and yellow indicates an alert state! The calculation period can be adjusted to your liking! I recommend using it on a demo account before u
The Interactive RSI indicator can generate RSI divergence with the availability of user defined filters. It can generate voice alerts for RSI oversold and RSI Overbought situations. Moreover it can also generate voice alerts for RSI Divergneces as well as when price breaks above or breaks below the support and resistances created upon divergence ouccurence. The voice alerts are generated in a way that you will know which market has reached the oversold and overbought conditions as well as the r
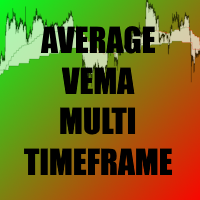
=== > Bu gösterge ne işe yarar? Zaman dilimi seçimiyle tek bir VEMA ortalamasını çizer.
Hacim ağırlıklı üstel hareketli ortalama (VEMA), son verilere ve yüksek hacimli çubuklara daha fazla ağırlık veren hareketli bir ortalamadır.
Bu, yüksek hacimli çubuklardaki fiyat dalgalanmalarının VEMA üzerinde daha büyük bir etkiye sahip olacağı anlamına geliyor.
Zaman dilimi seçimiyle tek bir WWMA ortalamasını çizer
Bu göstergeyi çizelgelerinize ortalamaya ihtiyacınız olduğu kadar bırakırsınız.

AI Moving Average göstergesi ile ticaretin yeni çağına hoş geldiniz. Bu gelişmiş MetaTrader 5 göstergesi, traderlara piyasa hareketlerine dair öngörüler sağlamak için tasarlanmıştır. Bu araç, AI'nın gücünü gecikmesiz bir üssel hareketli ortalamanın güvenilirliği ile birleştirerek gelecekteki fiyat trendlerinin doğru ve zamanında tahminlerini sunar. Yenilikçi Doğrusal Regresyon Modeli AI Moving Average, geçmiş fiyat verilerini analiz etmek için bir doğrusal regresyon makine öğrenimi modeli kullan

Trend reversal identification: The K-line countdown indicator helps traders capture trend reversal signals by identifying excessive buying and selling behavior in the market. This indicator is particularly effective when the market is in extreme states. Risk management: This indicator can help traders identify potential risks in the market before the trend reverses and adjust positions in time to avoid losses. For example, you might consider reducing your long position when a bullish countdown c

Introducing Smart Gold Pro, a versatile trading indicator suitable for all experience levels. It provides precise buy and sell signals for the gold market, adaptable to any timeframe. Powered by advanced algorithms, Smart Gold Pro accurately analyzes price movements and volume dynamics. What sets Smart Gold Pro apart is its reliability—it doesn't repaint past signals, ensuring dependable insights into potential market reversals. Its user-friendly visual interface on the chart, along with audible

Price update indicator — can issue any type of alert when the price reaches certain levels set by a trader. There are three types of price levels: the first one is used when the price rises above certain level (displayed with the green line on the chart), the second one is used when the price falls below certain level (displayed with the red line on the chart), and the third one is used when the price reaches the certain level exactly (displayed with the yellow line). Three alert types include

The "Channel Craft" indicator is a classic tool from the family of channel indicators, allowing traders to react promptly to price movement beyond the established channel boundaries. This channel is formed based on the analysis of several candles, starting from the last one, which helps identify the extremes within the studied range and construct channel lines. Trading within the channel is one of the most popular strategies in the forex market, and its simplicity makes it accessible even to no

The entry points provided by the Olo May indicator should be considered as potential points of change in market direction. This indicator is based on the use of a cyclic wave relationship, which makes each entry point optimal for identifying changes in movement.
The simplest way to use this indicator is to open a position in the direction of the current trend. However, the best results are achieved when combining it with fundamental news, as it can be used as a tool to filter news events, sho

This technical analysis indicator allows you to determine with high probability whether a trend or a flat pattern prevails in the market. It can be used both for trading within a channel and for breakout trading, provided that stop losses are used to protect against false signals.
The indicator displays the channel in the form of lines located above and below the price, like other similar indicators. The upper and lower lines can also act as resistance and support levels.
It quite accuratel

Determining the current market trend is a key task for successful trading. It is for this purpose that the Book Scheme indicator was developed, which is an advanced algorithm for visually displaying a trend on a chart.
Many traders dreamed of having reliable moving averages that kept up with the market. It was this dream that I turned into reality with the help of my indicator. Book Scheme allows you to predict future values and create accurate signals for entering and exiting the market.

Descubra o poder do nosso indicador de alta precisão, projetado para identificar as regiões de alvo e exaustão de qualquer ativo. Testado e validado por mais de 3 anos nos mercados de mini dólar e mini índice, ele oferece confiabilidade e eficácia incomparáveis. Transforme sua estratégia de trading e alcance novos patamares de sucesso com nossa ferramenta inovadora.

Evaluate operational viability in each timeframe and in any instrument, according to their respective spread and percentage volatility, which are essential for correct risk management in your trades.
This indicator is essential for both Day Traders and Swing Traders, as in addition to evaluating operational viability in each timeframe, it is also possible to identify the fair minimum stop for each period and instrument.
Example in Swing Trade: your broker charges a spread equivalent to 0.05
The Oriole indicator is designed to identify price trends and allows you to quickly determine not only the direction of the trend, but also the levels of interaction between buyers and sellers. It works on all timeframes and currency pairs.
The Oriole indicator provides fairly accurate signals and can be used in both trending and flat markets. It is recommended to use it in combination with other tools to get more reliable signals and make informed decisions.
The indicator does not redraw,

The Market Matrix indicator is an effective tool for identifying trends in the Forex market. It serves as a reliable assistant for traders, helping to identify trend and flat zones. Below are the main characteristics and advantages of this indicator:
Features of the Market Matrix indicator: Reliability and stability: The indicator does not redraw previous values, which ensures the stability of signals. Quick reaction to trend changes: The indicator algorithm allows you to quickly respond to t

Swing Sentry is an advanced technical indicator specifically created for Forex traders. It works based on a unique algorithm that allows you to predict future prices by analyzing historical data for a user-specified period.
The indicator provides traders with valuable information about possible changes in the direction of price movement. The special formula behind Swing Sentry accurately calculates signals, effectively identifying moments of reversal or sharp price movements in one direction.
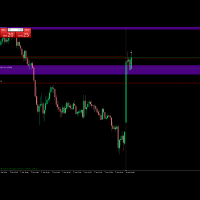
Your average price indicator for the position you were looking for. This indicator inserts a horizontal line on your chart when you are positioned, long or sold, after completing the partial. After completing the partial, it inserts the horizontal line on the graph visually showing where the true BreakEven of the operation is. Take a look the line of point 0 of operation.
OBS: This indicator only works in Netting Account.
Seu indicador de preço médio da posição que estava procurando. Este i


StochastiX is an extension of a well-known indicator.
1) StochastiX is displayed in the range of -100 to 100.
2) A histogram is calculated from the difference of the main and signal curves - again as a stochastic, but without smoothing.
The histogram gives the user a hint about the dynamics of oscillator changes. Patterns need to be studied from real graphs.
I wish you successful trading.

Why the RSI Alert Indicator is Essential for Your Trading Toolkit
In the fast-paced world of trading, timely and accurate information is crucial. The RSI Alert Indicator is a powerful tool designed to help you stay ahead of the market by providing real-time alerts when the Relative Strength Index (RSI) reaches critical levels. Whether you're a novice trader or a seasoned professional, this indicator can significantly enhance your trading strategy by pinpointing potential market reversals with

This is the test product. Please, DO NOT BUY IT! This is the test product. Please, DO NOT BUY IT! This is the test product. Please, DO NOT BUY IT! This is the test product. Please, DO NOT BUY IT! This is the test product. Please, DO NOT BUY IT! This is the test product. Please, DO NOT BUY IT! This is the test product. Please, DO NOT BUY IT! This is the test product. Please, DO NOT BUY IT!
MetaTrader Mağaza, MetaTrader platformu için uygulama satın almak adına rahat ve güvenli bir ortam sunar. Strateji Sınayıcıda test etmek için Uzman Danışmanların ve göstergelerin ücretsiz demo sürümlerini doğrudan terminalinizden indirin.
Performanslarını izlemek için uygulamaları farklı modlarda test edin ve MQL5.community ödeme sistemini kullanarak istediğiniz ürün için ödeme yapın.
Ticaret fırsatlarını kaçırıyorsunuz:
- Ücretsiz ticaret uygulamaları
- İşlem kopyalama için 8.000'den fazla sinyal
- Finansal piyasaları keşfetmek için ekonomik haberler
Kayıt
Giriş yap
Gizlilik ve Veri Koruma Politikasını ve MQL5.com Kullanım Şartlarını kabul edersiniz
Hesabınız yoksa, lütfen kaydolun
MQL5.com web sitesine giriş yapmak için çerezlerin kullanımına izin vermelisiniz.
Lütfen tarayıcınızda gerekli ayarı etkinleştirin, aksi takdirde giriş yapamazsınız.