YouTube'dan Mağaza ile ilgili eğitici videoları izleyin
Bir ticaret robotu veya gösterge nasıl satın alınır?
Uzman Danışmanınızı
sanal sunucuda çalıştırın
sanal sunucuda çalıştırın
Satın almadan önce göstergeyi/ticaret robotunu test edin
Mağazada kazanç sağlamak ister misiniz?
Satış için bir ürün nasıl sunulur?
MetaTrader 5 için teknik göstergeler - 75

Daily supply and demand levels for breakouts or reversals. Use on 1 Hour charts No nonsense, for the confident trader who trades price action supply and demand levels with daily projections without the fluff using 1 Hour charts. MT4 Version: https://www.mql5.com/en/market/product/108234 The Bank Trader Indicator is a sophisticated tool employed by institutional traders, particularly those in banking institutions, to navigate the complex world of forex markets. Rooted in the principles of daily

Introducing our innovative SMC Liquidity Zone Scanner indicator that revolutionizes the way traders identify crucial market patterns and make informed investment decisions - the SMC Liquidity Zone Scanner.
Our SMC Liquidity Zone Scanner is designed to provide traders with a comprehensive analysis of market liquidity, break of structure, support, and resistance levels, all within seconds. Powered by advanced algorithms and cutting-edge technology, this indicator is a game-changer for both expe

Make your decisions easier when rolling Covered Call. This robot provides you with information that aids in decision on how and when to roll your structure. It works for any asset in the spot market that has authorized options series on B3 (Brazilian stock exchange). Associate the robot with the asset you want to use for the Covered Call. How to use the robot: Set parameters for your current structure: Purchase price of the base asset in your structure. Code of the Call you used to build your st

"BigPlayerRange" göstergeye hoş geldiniz, finansal kurumların piyasalardaki önemli ilgi alanlarını belirlemek için geliştirilmiş bir teknik analiz aracı. Bu gösterge, ana pazar katılımcılarının önemli bir aktivite ve ilgi gösterdiği fiyat aralıklarının kesin analizini sunar.
Temel Özellikler:
1. Kurumsal İlgi Alanlarının Haritalanması: "BigPlayerRange", finansal kurumların güçlü aktivite gösterdiği grafik alanlarını kesin olarak vurgular. Bu noktalar stratejik olarak önemlidir ve olası piy
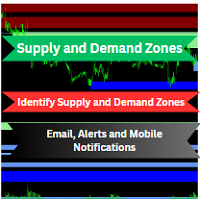
This powerful Indicator can automatically identify supply and demand zones and send you alerts, email and push notification on mobile whenever a new zone is created or when the price enters a specific zone.
This indicator integrates with any timeframe and chart or currency pair, ensuring its versatility across your trading endeavors. Supply & Demand Zones Finder(SDZF) indicator seamlessly identifies proven supply and demand zones, areas where price has consistently found support or resistanc

ParabolicSAR is a multi-currency professional Expert Advisor that uses a variety of trading strategies in the foreign exchange market. Each of the individual strategies has gone through many years of development and testing on quotes with 100% simulation. Thanks to the use of several strategies for each currency pair, the Expert Advisor is successfully tested with 100% simulation of quotes over a long period of time. IMPORTANT! After the purchase please send me a private message to receive

Her 5 kopya satıldıktan sonra fiyat 30 dolar artacak. Ana gösterge genel piyasa eğilimini belirlemeyi amaçlar. Parlak ve koyu renklerin kullanıldığı renk sistemiyse güçlü ve zayıf piyasa koşullarını belirlemeye çalışır.
Bana göre, bu gösterge eşsizdir; piyasa hareketlenmeye başladığında olağanüstü iyi çalışır.
Daha iyi sonuçlar için göstergeyi 1 saat, 4 saat veya günlük gibi daha uzun bir zaman diliminde kullanmayı tercih ediyorsanız, lütfen öyle yapın.
Renk yeşile döndüğünde alım fırsatı

An Implied Fair Value Gap (IFVG) is a three candles imbalance formation conceptualized by ICT that is based on detecting a larger candle body & then measuring the average between the two adjacent candle shadows.
This indicator automatically detects this imbalance formation on your charts and can be extended by a user set number of bars.
The IFVG average can also be extended until a new respective IFVG is detected, serving as a support/resistance line.
Alerts for the detection of bull

It is 1 Minute Strategy. When Indicator Gives Signal Then Put on Buy. It's Best Work on Crash 300 & Crash 500. If you want to know anything details please Contact Me on Telegram In this Link: https://t.me/+mi_52VwFp3E4MGNl It is very nice for scalping & for who not gives enough time on market.
N/B: Please be carefully it's only for scalping & not trade all the day. It's only 10 or maximum 15 trade per day.
Thanks everyone.

简介: 六彩神龙指标【MCD Hot Money】进是一种常用的技术指标,被广泛应用于股票交易中。它由六人不同的指标组成,包括均线、相对强弱指标井、移动平均收盘线等。这人指标可以有效地帮助投资者确定股票的买入和卖出时机。 六彩神龙用来看筹码了解庄家动向。看个股买卖少踩炕,少被套;跟庄吃肉,用于判断个股趋势!
指标设置 : hot_money_sensitivity = 0.7; // Hot Money Sensitivity hot_money_period = 40; // Hot Money Period hot_money_base = 30; // Hot Money Base banker_sensitivity = 1.5; // Banker Sensitivity banker_period = 50; // Banker Period banker_base = 50;

Note: If you want to apply this indicators on indicators which are shown in a sub-window, then consider using this indicator instead: https://www.mql5.com/en/market/product/109066.  ; AIntel Predict - Your Gateway to Future Trading Success! Unlock the power of predictive analytics with AIntel Predict. Say goodbye to the guesswork and hello to improved forecasting, as AIntel Predict leverages historical data to unveil the future of your trades like never before. Whether you're a seasoned tra
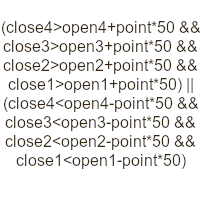
Indicator for research and finding candle bars patterns real time. Options: Alerts - Enabling alerts Push - Enable push notifications BarInd - On which bar to look for patterns for notifications (1 - formed, 0 - forming) ID - Identifier. Appended to the names of graphic objects and to the message Formula - Formula. In the bar price formula: open1, high1, low1, close1, etc. (open0, high25... any number, 0 is also possible - low0, open0...). Counting bars from right to left from zero. You can use

Yüksek Güç göstericisi akıllı Para Konfigurasyonu (SMC) teorisine dayanılır ve sıra akış analizi temel. Giriş ve çıkış alanlarının analizi için kullanılır. Gösterici referans: HUB 3. 0 satış ICT (İçindeki Çirket Trader) kendine geliştirdiği strateji için bir isim vermediğine rağmen, seyircileri bu strateji çok isim verdiler ve onların çoğunu öğrettiği kelimelerden alındı. Örneğin, ICT sık sık akıllı para söylüyor, bu yüzden SMC (Akıllı Para Konfigurası) oluşturdu. ICT'deki pazar yöntemlerini an
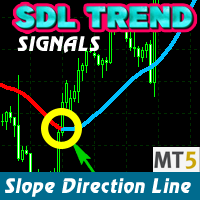
The SDL Trend Signals MT5 indicator shows the market direction with a colored moving average line. It has three inputs: Period (calculation period), Method (calculation method), and Applied price (price used for calculations).
The indicator has three buffers: Uptrend, Downtrend, and ExtMapBuffer (for indicator values). The Bullish slope is in BLUE, and the Bearish slope is in RED. For example, an upward slope indicates a Bullish market (Blue), and a downward slope indicates a Bearish market (

Note: This indicator is for sub-window use and not for the main chart. If you need to apply it for the indicators in the main chart, then use this indicator instead: https://www.mql5.com/en/market/product/108876 AIntel Predict - Your Gateway to Future Trading Success! Unlock the power of predictive analytics with AIntel Predict. Say goodbye to the guesswork and hello to improved forecasting, as AIntel Predict leverages historical data to unveil the future of your trades like never before. Whe

Bu gösterge bir önceki günün, haftanın ve ayın maksimum ve minimum fiyatlarını gösterir. Aşırı noktaların kırılmalarını tespit etmek ve bir ticarete giriş yönünü belirlemek için tasarlanmıştır. Geri dönüş seviyelerini daha doğru belirlemek için Fibonacci seviyelerini görüntüleyebilirsiniz. Önceki fatura dönemindeki fiyat hareketini daha net göstermek için yüksek ve düşük fiyatlar arasındaki alanda da çizilebilir. Mevcut mumun (çubuğun) kapanmasına kadar geçen süreyi gösterir.
Sürüm 2.0, 3 yen
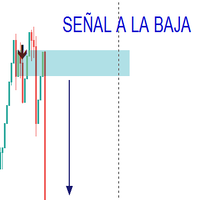
El indicador trabaja con patrones funcionales y divergentes obteniendo del mercado las mejores señales para compra y venta, ha sido testeado por 2 años mediante la estrategias personalizada. El indicador envia la señal para la compra y venta de acuerdo al analisis desarrollado en el mercado. Solo ha sido comprobado en el mercado de indice sintetico (CRASH, BOOM VOLATILITY, STEP)
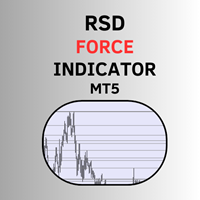
DIRENÇLERIN VE DESTEKLERIN GÜCÜNÜ ÖLÇER RSD göstergesi - Direnç, Destekler ve Yön - uzman tüccarın operasyonel aracıdır. Gerçekten fark yaratan göstergedir.
Her tür ticaret için vazgeçilmez bir göstergedir her zaman diliminde mükemmel çalışır dirençlerin ve desteklerin hesaplanacağı mum sayısını girdi olarak alır dirençler ve destekler çizer: çizgiler ne kadar yakın ve kalınsa, dirençler ve destekler o kadar güçlüdür "merkez" çizgisini, en yüks

In the dynamic world of financial markets, staying ahead of the curve is paramount. Traders and investors require sophisticated tools to analyze market trends, make informed decisions, and optimize their strategies. Introducing the Moving Average of Accumulation/Distribution (MAAD) Indicator – a powerful tool designed to provide insightful signals for navigating the complexities of the financial landscape. Key Features: Precision in Trend Analysis: The MAAD Indicator employs a moving average met

Bu gösterge, aynı grafikte izlemek istediğiniz diğer zaman dilimi mum çubuklarını verimli bir şekilde izler
1. Aynı grafikteki çubukları yüklemek için daha yüksek bir zaman dilimini seçin
2. Şamdanların renklerini ve stilini özelleştirin
3. Şamdanları çizmek için çubuk sayısını seçin
4. Daha yüksek zaman dilimindeki komple mumları fitil ve gövdeyle birlikte takip edin
5. Grafiği değiştirmek istemeyenler için kolay ve kullanışlı.
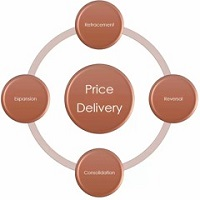
Consolidation is when price is moving inside a clear trading range. When prices are consolidated it shows the market maker placing orders on both sides of the market. This is mainly due to manipulate the un informed money. This indicator automatically identifies consolidation zones and plots them on the chart. The method of determining consolidation zones is based on pivot points and ATR, ensuring precise identification. The indicator also sends alert notifications to users when a new consolida

注意️测试模式并不能完全正常运行 所以那个免费模拟是个摆设 和实际效果相差甚远 实际效果比GIF图片里面要流畅不存在卡顿和性能问题 十年前的i3都没有任何压力
____ 由于MT5的画线功能比较基础,迈达克官方也无意改进升级,但是后起之秀TradingView的出现极大拓展了画线分析部分的功能 (当然TV的优势远不止于此),甚至国内的很多看盘软件的画线功能也比MT4原生的画线功能要强大。当然市面上传播的画线工具肯定也是有很多的包括五年前我写的一些相对简单的工具。 但是现存的所有加起来也无法和便捷画线工具第三版相提并论,这是MT史上最强的画线工具没有之一,这是使用画线工具的朋友给出的评价。 本工具初版5-6千行代码,经过一年的升级优化写到第三版已经超过2万行代码(当然空行大括号和注释的占比也不会很低估计在10-20%左右我的代码很规范 每一个变量都不会瞎命名也不会对只用得到一两次的功能单独写一个函数当然也不会在需要反复调用的时候一遍遍复制雷同代码),最终功能呈现就是本文档所见这样几十个功能改进当然有些细节本文档也没有具体讲需要用户观看讲解视频学习使用。
____ 本工具细

The Hurst Exponent gauges a time series' long-term memory and is named after Harold Edwin Hurst. The MetaTrader's Hurst Exponent Indicator analyzes an asset's price memory, helping predict future trends. It's valuable for traders of all levels, suitable for various styles like scalping or swing trading.
In Forex terms, the Hurst Exponent measures a series' dependence, indicating whether it regresses to the mean or clusters in a direction. H values between 0.5-1 suggest positive autocorrelatio

MT5 RSI Experiment: This indicator leverages the Relative Strength Index (RSI) and floating levels to pinpoint potential buy and sell signals.
The code uses enums for prices and RSI calculation methods. These enums define indicator parameters.
Input variables include RSI period, price type for RSI calculation, smoothing method, and look-back period with levels for floating levels.
Index buffers store RSI fill, RSI up line, RSI middle line, RSI down line, and trend line data.
For each ba
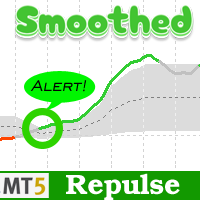
Smoothed Repulse Alert MT5 Indicator
The Smoothed Repulse Alert for MT5 is a powerful tool that visualizes market pressure through a filled area chart and two lines in a separate window. This indicator is based on the repulse indicator, assessing buying and selling pressure using high, low, open, and close prices over a specified period.
Key Features: - Customizable parameters include repulse period, moving average type, moving average multiplier, level period, upper and lower levels. - Col

Elliott Wave Principle, developed by Ralph Nelson Elliott , proposes that the seemingly chaotic behaviour of the different financial markets isn’t actually chaotic. In fact the markets moves in predictable, repetitive cycles or waves and can be measured and forecast using Fibonacci numbers. These waves are a result of influence on investors from outside sources...

The indicator enables very quick orientation in the market phase (re/accumulation, re/distribution, up/down trend). It is counted only
from price data (without volume).
It is based on the assumptions of Wyckoff's law of Causa and Effect. Oscillations are an expression of the level of market uncertainty and point to the presence of Big Money. Such a "storm" is followed by a calmer trend that needs to be exited. You need to use other tools or shorter period of the same indicator for that.
I kee

Forex traders often observe increased market activity near Supply and Demand zones, which are levels formed based on zones where strong price movements have previously occurred.
The Supply Demand Strong Weak Confirm Indicator utilizes fractals and the ATR indicator to identify and plot support and resistance zones on the price chart. These zones are categorized as follows:
- Weak: significant high and low points in the trend. - Untested: crucial turning points in the price chart that the pr

Scalper Pivot Grid indicator reveals five distinct scalping zones strategically positioned to capture numerous reversal entry opportunities centered within each area. Initially designed for timeframes ranging from M15 to H1, this indicator allows manual adjustment of the area height. This feature enables users to customize the distance between lines, promoting enhanced equity resilience. Originally made for M1 timeframe.
Setup/Inputs: Recommended Height value is 1. Increasing/decreasing the H

Indicator Statistics MultiPairs 1. Current Openning Ords - Symbols Openning + Buy Orders + Buy Volume + Sell Orders +Sell Volume - DrawDown by Symbols - Floating by Symbols 2. Closed Orders - Statistics by Today, Week, Month, YTD and Volume - Sum of Closed Orders by Symbol 3. Statistics by Day - Statistics by Say and Volume 4. DrawDown by Day - Each day DrawDown in Week - Percent of DrawDown Contact me at Telegram @MaiMew68
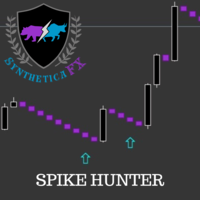
SyntheticaFX Spike Hunter Indicator is a powerful tool that helps you identify potential spikes in the market. It works on the 1-minute timeframe and shows arrows on the chart when a spike is likely to happen. It is designed for Crash and Boom markets, such as Crash 300, 500 and 1000, and Boom 300, 500 and 1000. It is non-repainting and only indicates spikes when Crash markets are in downtrend and Boom markets are in uptrend. However, no indicator can always be 100% accurate as the market can c
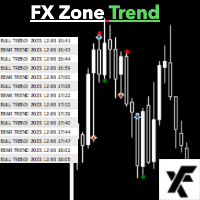
FX Zone Trend ile Ticaret Potansiyelinizi Açığa Çıkarın - Karlılık İçin Basit Bir Yol! Temiz Sinyaller ve Sonsuz Olanaklarla Ticaretinizi Yükseltin! Karmaşık göstergelerden bıktınız mı, sizi bilgilendirmekten çok daha fazla karmaşıklık bırakanlar mı? FX Zone Trend'i tanıtmaktan gurur duyuyoruz - basit ancak güçlü bir MT5 göstergesi, ticaret başarınız için size dizginleri verir. Neden FX Zone Trend'i Seçmelisiniz? Basitleştirilmiş Ticaret: Karmaşık grafikler veya kafa karıştırıcı göste
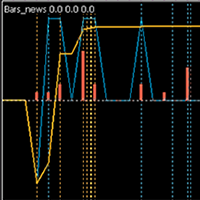
Indicator of news linked to a bar. The published current value of the news has a characteristic impact on the currency it relates to: positive, negative, neutral . The indicator summarizes all these values for the selected period, taking into account the importance of the news: high, medium, low . As a result, a percentage is calculated for the currency pair, which shows the news of which currency is dominant. If the value is positive, then the pair has news pressure towards BUY, if negative - S

Smart Engulfing MT5'e Hoş Geldiniz:
Smart Engulfing MT5 ile sofistike bir ticaretin dünyasına adım atın - en üst düzey engulf desenlerini tanımlamak için profesyonel bir gösterge. Hassasiyet ve kullanım kolaylığı göz önünde bulundurularak tasarlanan bu araç, sadece MetaTrader 5 kullanıcıları için özel olarak hazırlanmıştır. Smart Engulfing MT5 size uyarılar, oklar ve üç farklı kar alma seviyesi ile rehberlik ederek karlı ticaret fırsatlarını kolayca keşfetmenizi sağlar, bu da basitlik ve etki

This is my trusted friend of trading.
So... I musted re-write this in MQL5 to use in brokers where there is only MT5.
The indicator is like a mother-in-law, who talks often, talks a lot and often inappropriately.
The indicator, in addition to giving us an entry signal on parameters which I will then list, monitors the trend of the hourly timeframe, OSMA to understand the entry direction, RSI to sense any overbought or oversold conditions from which to abstain, ATR for the volatility and ADX
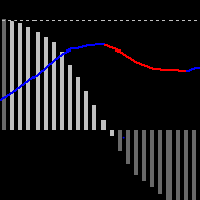
This indicator shows the MACD line and the difference WMACD - MACD to it. that is, the divergence between price and weighted acceleration. Divergence is shown with a histogram. It took a bit of math to get a readable result.
What does the histogram say?
If the course is consistent with the price movement, then the price is driven by volumes. It is passing through an area of higher liquidity, the market is being manipulated by strong money. Within Wyckoff's theory, these are typically climax an

Introducing FX Zone Custom Time OHLC Candle - Your Effortless Solution for 1-Minute Chart Analysis! Unleash the Power of Precision with Simplicity! Are you tired of complex indicators that clutter your charts? Meet FX Zone Custom Time OHLC Candle, a user-friendly tool designed for traders who value simplicity and precision in their 1-minute chart analysis. Key Features: Easy and Intuitive: Navigate effortlessly with a clean interface, making chart analysis a breeze. Custom Time OHLC

Introducing the Ultimate Custom Time Range Indicator: Unlock Precision in Your Trading Strategies! Versatile Applications: Ideal for kill zones, trading sessions, and time macro analysis, silver bullet timings. You can have as many time ranges as you need to help identify the highest to lowest range within the specified start to end broker time. Note: most brokers operate in GMT +3 - so please convert and use your own broker time.

The Price Spectrum indicator reveals opportunities for detailed market analysis. Advantages: Market Volume Profile Creation : The indicator assists in analyzing the dynamics of trading volumes in the market. This allows traders to identify crucial support and resistance levels, as well as determine market structure. Filtering Insignificant Volumes : Using the indicator helps filter out insignificant volumes, enabling traders to focus on more significant market movements. Flexible Configuration S

Fibonacci Master Pro is an advanced Fibonacci projection indicator designed to optimize your trading strategies. It incorporates the principles of Fibonacci technical analysis, providing precise projections and entry and exit opportunities in the market.
Fibonacci Master Pro draws upward and downward Fibonnaci Projections based on the maximum and minimum value of the candle you specify.
Key Features :
**Accurate Projections:** Using sophisticated algorithms, Fibonacci Master Pro calc
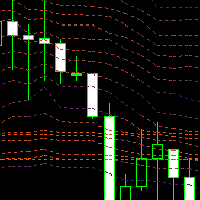
Market Profile, Volume Profile? Extra paid in TradingView, displayed for the last moment in time or discreetly, e.g. after 24 hours. Counting super-accurate values from a histogram...?
None of these ways suited me. I was looking for an expression of the dynamics of the market, its liquidity, I just wanted to clearly see where the money was flowing. I thought I would calculate the volume weighted price percentiles for a certain period.
To make the calculation more accurate, I calculate from a l

Merhabalar Bu İndikatörde basit bir hareketli ortalama çakışması algoritması ile yola çıktım. Ancak daha başarılı sonuçlar almak için hareketli ortalamaların çakışmalarını ve optimize değerlerini açılış kapanış yükseklik ve en düşük değerlerini baz alarak farklı senaryolar kurarak öyle her ortamda ulaşabileceğiniz hareketli ortalamaların muhtemelen görmüş olduğunuz en istikrarlı çalışan versiyonunu sizlere sunmuş bulunuyorum. İşin içine biraz hacim koyduk bu indikatörü çalıştırırken bana ka

An extended version of the indicator for visualizing the time ranges of key trading sessions: Asian, European and American. The main advantage of this indicator is the automatic construction of a price profile for a trading session. The indicator has the functionality to set the start and end time of each trading session, as well as automatically determine the time zone of the trading server. The indicators include the ability to work with minimal CPU usage and save RAM. In addition, the option

Description: Unlock the power of precise trading with our Dynamic Support and Resistance Indicator for MetaTrader 5. Designed for both novice and experienced traders, this sophisticated tool offers an unparalleled edge in identifying key price levels in the market. Key Features: Customizable Lines : Easily set up to 5 support and 5 resistance lines. Customize them according to your trading strategy, whether for short-term scalping or long-term trend following. User-Friendly Inputs : Adjust the p

All about time and price by ICT. This indicator provides a comprehensive view of ICT killzones, Silver Bullet times, and ICT Macros, enhancing your trading experience. In those time windows price either seeks liquidity or imbalances and you often find the most energetic price moves and turning points. Features: Automatic Adaptation: The ICT killzones intelligently adapt to the specific chart you are using. For Forex charts, it follows the ICT Forex times: In EST timezone: Session: Asia: 20h00-0

Cobra Pivot Noktaları, DEMO'yu indirerek kendinizi test edebileceğiniz en iyi optimize edilmiş pivot noktalarını çizmeye yönelik bir göstergedir.
1. En İyi İki Pivot Modunu Seçin: Cobra Pivots veya Camrilla Pivots
2. D1 ile sınırlı olmamak üzere istediğiniz zaman dilimini kullanabilirsiniz.
3. Shift parametresi ile Önceki gün Yüksek Düşük Kapanış değeri ile oynayabilirsiniz. 1 = Önceki Çubuk, 2 = Önceki çubuktan önceki Çubuk vb.. Bu parametreler pivotlar üzerinde araştırma ve geliştirme
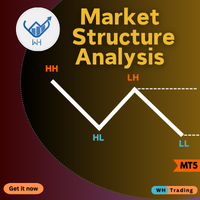
Are you tired of missing crucial market movements? Do you wish for a tool that not only identifies swing points but also provides insights into price action movements?
Look no further – our Market Structure Analysis indicator is here to revolutionize the way you analyze markets on MQL5! MT4 Version : WH Market Structure Analysis MT4 Key Features:
Swing Point Detection: Our indicator excels at identifying significant swing points in the market, helping you understand key turning points with

Many people trade through hedging methods, such as long EURUSD and short GBPUSD, but many people lack professional quantitative indicators to accurately calculate the real price difference between the two related varieties. The Wind Hedge indicator provides the perfect solution to see the true spread change of two related varieties over several decades.
This is an unprecedented approach, completely original and innovative.
Allows you to call any two related varieties and calculate their tru
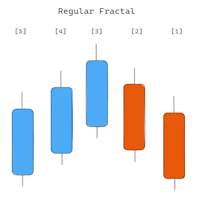
Gösterge daha yüksek zaman dilimindeki Fraktalları gösterir. İki tür Fraktal görüntülemek mümkündür: 'Normal Fraktal' ve 'BW Fraktal'. Fraktal 'UP' oluşumunu düşünün. 'Düzenli Fraktal', her bir sonraki 'yüksek' fiyatın (orta çubuğun solunda ve sağında) daha küçük olduğu çok katı bir Fraktaldır. Oysa 'BW Fractal'da tek bir koşul vardır: Merkezi çubuğun (fiyatı 'yüksek') en yüksek olması gerekir. Görsel olarak bu iki mod arasındaki fark diyagram 1'de görülebilir. 'Daha Yüksek Zaman Çerçevesi' par

Right hand очень точно воспроизводит колебания цены. Когда рынок растет, кривая Right hand идет вверх. Хотя иногда бывает так, что кривая идет вверх, в то время как цена консолидируется и нет тренда вверх. Аналогично, когда рынок падает, кривая тоже убивает, исключения возникают так же в зоне консолидация рынка. Анализ большого количества графиков Индекса Направленнрго Тренда ( DTI )позволяет выявить его специальные характеристики, полезные при отслеживании тренда. В положительной области т.е

移動平均線の傾斜角度をラベルに表示するだけのシンプルなインジケーターです。ラベルのフォントサイズ、色の調整、移動平均線の設定など全て行えます。また、移動平均線の傾斜角度というものは、MT5のウインドウサイズを変更すると、移動平均線自体の傾斜角度も変更されてしまうことをご了承ください。これは、インジケーターの仕様ではなく、移動平均線の傾斜角度というもの自体の仕様です。
また、MT5には、OnCalculateから値を取得してしまうと、インジケーターを削除する際にオブジェクトが残ってしまうという公式のバグが存在します。その為、当インジケーターでは、OnCalculateから移動平均線の傾斜角度の値を取得し、それを、OnTimer関数で1秒毎に評価し、オブジェクトに傾斜角度を出力しております。なので、傾斜角度の出力レベルはほぼティック毎と変わりませんことをご理解下さい。
また、今後のアップデートで、時間足毎に移動平均線の傾斜角度を評価できるようアップデートして参ります。

The "ZScore Quantum Edge" is based on an advanced algorithm that combines volume analysis and price movement, providing a clear and accurate representation of market trends. Key Features: In-Depth Trend Analysis : The indicator uses a configurable period for trend analysis, allowing traders to adjust the indicator's sensitivity according to their trading strategies. Data Smoothing : With an adjustable range for data smoothing, the "ZScore Quantum Edge" offers a clearer view of the market, minimi

Operating Principle: The "RSDForce" merges trading volume analysis and price movements to provide valuable market insights. Here's how it works: Volume and Price Analysis : The indicator examines the trading volume (quantity of traded assets) and price variations over time. Market Force Calculation : It calculates a value that reflects the market's 'force', indicating whether the price trend is strong and based on substantial trading volume. Simple Visualization : The result is displayed as a li

"Introducing Dynamic Supply and demand Pro – Your Ultimate Supply and Demand Trading Companion! Unleash the power of precision with this advanced indicator designed for traders seeking unparalleled market insights. Dynamic Supply and demand Pro dynamically identifies key reversal zones, showcasing the delicate dance between supply and demand forces.
This cutting-edge tool provides a comprehensive view of the market, highlighting potential turning points with pinpoint accuracy. Witness the ebb
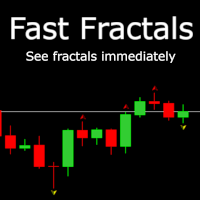
Info: It's like built in Fractals indicator but faster. Usually it shows the signal after 2 bars but FastFractals indicator shows signals immediately and that's is incredible. You can create scalp strategies with it or trade yourself. This indicator uses neural network to analyze price graph and predict. It was trained on 4 hours interval on EURUSD pair, but you can use it with different periods and instruments. There is only one minus in this indicator, it hasn't got 100% accuracy. See pictures

Tatino Super Signals is Non Repaint Indicator for Binary Option trading and Forex trading. Recommendations:
Timeframe: All timeframes. For best results we recommend using it on M1, M5 and M15 timeframes. Currency pairs: All Pairs Account type: All Type Broker time: Any Brokers : Alls Binary Trading : Expired 1 Candle Buffer Buy=1, Sell=0, Entry Next Candle Recommended Forex trading stop loss : 15 pips Recommended Forex tradingTake profit levels : 15 pips
Specifications:
Does not repaint

RFX5 Bull Bear Powers indicator shows the absolute power of bulls and bears controlling the market. Both powers are shown simultaneously with red and green colors for bear and bull powers respectively. When red line goes over the green line it means that bears are controlling the market. When green line goes over the red line it means that bulls are controlling the market. The green/red horizontal symbol line at the bottom of the indicators shows which party has more strength. Time Frame: M3
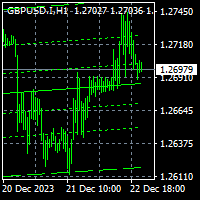
To get access to MT4 version click here . This is the exact conversion from TradingView: "Linear Regression Channel" by "LonesomeTheBlue". This is a repaint indicator. Buffers are not available for processing. You need to parse objects on chart. All input fields are available. You can message in private chat for further changes you need. Thanks for downloading
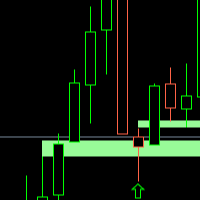
FVG WATCHER is an indicator that helps traders identify fair value gaps in the market. The indicator draws fair value gaps and alerts the user when the fair value gap has been swept. It allows users to specify how it should be swept, what time range to alert, and the size of the fair value gap to alert. It also allows the user to apply a moving average trend filter for better choice of alerts. The indicator also allows push mobile notifications. What makes FVG Watcher special is that it can be

The PUA MultiType Pivot indicator is built on the daily chart of the previous day. The PUA MultiType Pivot indicator is one of the most popular tools in technical analysis, used by traders to identify potential reversal points in financial markets. This indicator constructs three types of Pivot points: Classic, Fibonacci, and Camarilla, each offering its unique approach to market analysis. The advantages of this indicator include: Simplicity and Clarity PUA MultiType Pivot provides clearly defi
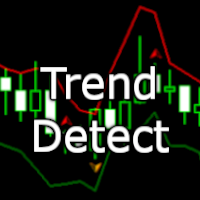
Trend change detector is an indicator for Metatrader 5.It can help you determine the change in a local trend to open a correct position. It has 2 parameters. Period and mistake offset percent. You can change the period parameter to capture little changes in trend. There are two lines: the red one and the green one. You can use them as a local support and resistance level. Arrows show the change in a trend. Up arrow the price will go down and Down arrow the price will go up. Also, by changing m
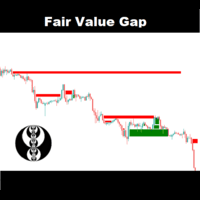
The FairValueGap indicator finds market imbalances which suggest that buying and selling are not equal. Fair value gaps are a very useful concept in price action trading, as they provide a trader with information about where a lot of volatility is in the market which makes having the FairValueGap indicator a must
Check out: Break of structure Features Has a filter for filtering out FVG zones with less volatility Multiple currency pairs supported Very easy to use and very customizable Inpu

Created by imjesstwoone and mickey1984, this trade model attempts to capture the expansion from the 10:00-14:00 EST 4h candle using just 3 simple steps. All of the information presented in this description has been outlined by its creators, all I did was translate it to MQL5. All core settings of the trade model may be edited so that users can test several variations, however this description will cover its default, intended behavior using NQ 5m as an example. Step 1 is to identify our Price Ra

Yapay Zeka Desteği Direnci Bu, “Destek” ve “Direnç” satırlarını arayan bir göstergedir. Arama, sayısal analiz ve veri işlemeye yönelik bir algoritma kullanılarak gerçekleştirilir. Üç arama seçeneği mevcuttur (“mod #1”, “mod #2” ve “mod #3”). Bu seçeneklerin her biri kendi dahili algoritmasında farklılık gösterir (şu anda bunlar tamamen dahili ayarlardır, kullanıcı tarafından kullanılamaz). Bu seçeneklerin aramanın ciddiyetine göre farklılık gösterdiğini söyleyebiliriz. Sınırlama: Şu anda gösterg

Liquidity Pro The Liquidity Pro pin points liquidity zones in any financial instrument, including currency pairs, cryptocurrencies, commodities, equities and indices. The Liquidity Pro shows previous and current liquidity zones, down to the present minute, providing essential information about your chosen trading pair, when conducting chart analysis or initiating trades. The Liquidity Pro allows you to observe where price consolidates, retraces, resists, or settles within support areas. It pinp
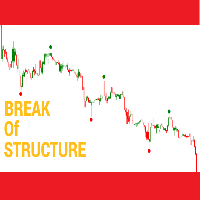
The indicator simplifies the hustle of trying to find market highs and lows. The indicator uses a method called break of structure - a break of structure is simply the process of forming a higher high on an uptrend without first creating a lower low and a lower low on a downtrend without first developing a higher high in other words a break of structure is a change in price behavior and signals a shift in market momentum. That being said the indicator is the ace card every trader should have.

Overview:
The Custom_Timeframe_MAs indicator for MetaTrader 5 lets you study different timeframes using M1 candles. It offers 12 moving average methods for analyzing trends. Why It's Useful: Versatile Timeframes: Even though MetaTrader has fewer timeframes, this indicator expands options by using M1 candles. Various Moving Averages: Choose from 12 moving average types: SMA, EMA, DEMA,TEMA,WMA, VWMA,SMMA, HullMA, LSMA, ALMA, SSMA, TMA, to understand price movements better. For Automated Tradi

El indicador Global Average es una media móvil que difiere significativamente de las medias móviles tradicionales. Su función principal es proporcionar un precio objetivo de take profit que sirve como referencia para la estrategia de regresión a la media. Este manual detallará la estrategia de Venta/Compra basada en este indicador, que implica medir el primer impulso del precio despues de romper la media del indicador, luego avanzar con el nivel de Global Average , y vender/comprar cuando el pre

The BS Vwap 5 Bands indicator is an advanced tool that integrates price and volume data, providing a comprehensive view of market dynamics. Designed with a focus on performance and tested under real trading conditions, this indicator aims to deliver valuable insights to traders. Its innovative approach combines VWAP with five distinct bands, revealing whether the price is aligned with the "fair price" and indicating overbought or oversold conditions. Additionally, the indicator offers visual cus
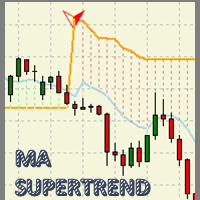
MA Super Trend MT5 An indicator based on the average maximum and minimum of a candle period, and next to the average true range (ATR) result in a powerful visual work tool to optimize the trend zones and potential areas of market entry. With great adaptability in any type of financial asset and with a potential for visual simplification in the graph, which will make the graph a simple work table. An indicator created to measure: - For MT5 desktop platform. - Great for Day trading, Swing Trading
MetaTrader Mağaza, geliştiricilerin ticaret uygulamalarını satabilecekleri basit ve kullanışlı bir sitedir.
Ürününüzü yayınlamanıza yardımcı olacağız ve size Mağaza için ürününüzün açıklamasını nasıl hazırlayacağınızı anlatacağız. Mağazadaki tüm uygulamalar şifreleme korumalıdır ve yalnızca alıcının bilgisayarında çalıştırılabilir. İllegal kopyalama yapılamaz.
Ticaret fırsatlarını kaçırıyorsunuz:
- Ücretsiz ticaret uygulamaları
- İşlem kopyalama için 8.000'den fazla sinyal
- Finansal piyasaları keşfetmek için ekonomik haberler
Kayıt
Giriş yap
Gizlilik ve Veri Koruma Politikasını ve MQL5.com Kullanım Şartlarını kabul edersiniz
Hesabınız yoksa, lütfen kaydolun
MQL5.com web sitesine giriş yapmak için çerezlerin kullanımına izin vermelisiniz.
Lütfen tarayıcınızda gerekli ayarı etkinleştirin, aksi takdirde giriş yapamazsınız.