• Тип индикатора
  • Цена
     - 
  • Сбросить
Смотри обучающее видео по маркету на YouTube
Как купить торгового робота или индикатор
Запусти робота на
виртуальном хостинге
Протестируй индикатор/робота перед покупкой
Хочешь зарабатывать в Маркете?
Как подать продукт, чтобы его покупали

Технические индикаторы для MetaTrader 5 - 79

icon На основании сигналов технических индикаторов принимаются решения относительно открытия или закрытия сделки на фондовом и форекс-рынках. Суть индикаторов заключается в математическом преобразовании цены и/или объемов финансового инструмента для прогнозирования изменений цен в будущем. Протестируйте технические индикаторы, чтобы лучше предсказывать поведение рынка и зарабатывать на этом.
Следуйте тренду.  Да, дождитесь сигнала на вход, будь то покупка или продажа, и входите по цене, а прибыль берется при изменении линии рисования, фиксации прибыли или при появлении противоположного сигнала. Это очень просто и работает на всех. валюты, металлы, индексы и на всех кадрах.   Как войти?  Дождитесь сигнала на покупку или продажу и входите по нему. Зафиксировать или зарезервировать прибыль можно после изменения линии рисунка или появления противоположного сигнала.
>>> BIG SALE PROMOTION: 50% OFF + GIFT EA!  - Promo price: $64 / Regular price $129 <<< - The promotion will end soon! The Forex Trend Tracker is an advanced tool designed to enhance the trading capabilities of forex traders. This sophisticated indicator uses complex mathematical formulas alongside the Average True Range (ATR) to detect the beginnings of new upward and downward trends in the forex market. It offers visual cues and real-time alerts to give traders a competitive advantage in th
Volume plays a crucial role in trading, serving as a key indicator of market activity and investor sentiment. Here are some important roles of volume in trading: Confirming trends: Dow Theory emphasizes the importance of volume in determining market trends. Larger volume usually indicates greater disagreement between bulls and bears, while smaller volume may indicate higher market agreement with the current price. Capturing institutional moves: By analyzing volume over a period of time, one c
Overview In the evolving landscape of trading and investment, the demand for sophisticated and reliable tools is ever-growing. The AI Trend Navigator is an indicator designed to meet this demand, providing valuable insights into market trends and potential future price movements. The   AI Trend Navigator   indicator is designed to predict market trends using the k-Nearest Neighbors (KNN) classifier. By intelligently analyzing recent price actions and emphasizing similar values, it help
The Boom300 Spike Indicator is a powerful tool designed to identify significant price spikes in the market. Key Features: Real-time Spike Detection: The indicator continuously scans the market for sudden spikes in price action, providing timely alerts when significant spikes occur. Customizable Alerts: Traders can customize alerts to suit their preferences, including audible alerts, email notifications, and push notifications to mobile devices. User-Friendly Interface: The indicator offers a
Description: The Spike Sniper Crash Market Indicator is a sophisticated tool designed to identify and navigate volatile market conditions, often associated with sudden price spikes and market crashes. Leveraging advanced algorithms and technical analysis, this indicator serves as a vigilant guardian, alerting traders to potential market disruptions and providing actionable insights to mitigate risks and capitalize on opportunities. Key Features: Precision Spike Detection: The indicator employs c
Индикатор определяет значение ATR (пунктов)  классическим   способом (с учетом паранормальных баров/свеч) и более корректно - игнорируя паранормальные движения инструмента. Правильно применять Индикатор это исключать из расчета паранормальные бары, игнорируя как чрезвычайно маленькие бары (менее 5%( можно изменить ) стандартного ATR) так и чрезвычайно большие бары (более 150% ( можно изменить )   стандартного ATR). Эта Расширенная  версия - позволяет задавать параметры расчета и множество други
This indicator obeys the popular maxim that: "THE TREND IS YOUR FRIEND" Channel indicators incorporate volatility to capture price action. The Bollinger Bands is widely used, however, there are other options to capture swing action opportunities. Each study you will find here is unique, and reveals different types of price action. https://www.mql5.com/en/market/product/116256 https://www.mql5.com/en/market/product/115553
MultiFractal Levels MultiFractal Levels  –  это модифицироанный индикатор фракталов Била Вильямса с добавлением уровней.  Фракталы строятся со всех ТФ, разрешённых в настройках. Уровни строятся только по самым последним фракталам, которые ещё не были протестированы ценой.  Преимущества перед оригинальным терминальным индикатором: Удобство Наглядность Информативность  Самые свежие уровни  Настраиваемый фрактал Настраиваемые уровни Индикатор удобен, поскольку не нужно переключаться на разны
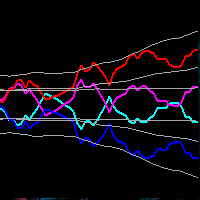
This is the MT5 version of Ku-Chart. This is an indicator devised by Ku-chan, a famous Japanese trader, based on the dealings of Lehman Brothers' discretionary traders. Unify the measuring stick of currencies to display the true value of currencies. Although it is an indicator, it does not use a buffer and is displayed using objects such as trend lines. Also, instead of drawing on the subchart, it is drawn in an area far above the current price of the main chart, so you can switch from the
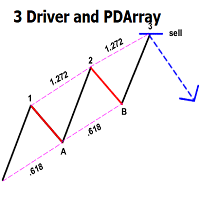
This indicator automatically identifies the SMC 3-Drive pattern and sends notifications to users when the pattern is detected. Additionally, the indicator identifies PDArray (including FVG and OB) and offers an option to combine the 3-Drive pattern with PDArray. This combination provides users with more reliable signals. What is the 3-Drive Pattern? This pattern is formed by three price pushes in one direction, providing a strong reversal signal (Figure 3). The key to identifying this pattern is
Introduction The "Smart Money Concept" transcends the realm of mere technical trading strategies to embody a comprehensive philosophy on the dynamics of market operations. It posits that key market participants engage in price manipulation, thereby complicating the trading landscape for smaller, retail traders. Under this doctrine, retail traders are advised to tailor their strategies in alignment with the maneuvers of "Smart Money" - essentially, the capital operated by market makers
Introducing our state-of-the-art Wave Indicator, meticulously designed for the discerning traders of the MQL5 community! At the core of this innovative tool lies an unmatched sensitivity to capture even the slightest market movements. Our Wave Indicator serves as the foundational element for constructing comprehensive trading strategies, providing you with an unwavering edge in the dynamic world of finance. Whether you're aiming to refine short-term tactics or develop long-term systems, this ind
TMA CG FAST MT4 REPLICADO PARA MT5 Cuenta con todas las caracteristicas del original con la funcion adicional de tener señal al fallo que consiste en que despues de una cantidad de velas establecida por el usuario emita una preseñal para una potencial entrada  tiene alerta sonora para la posible entrada y la entrada definitiva tiene la posibilidad de repintar o no , queda a eleccion de usuario
Contact me for instruction, any questions! Introduction A flag can be used as an entry pattern for the continuation of an established trend. The formation usually occurs after a strong trending move. The pattern usually forms at the midpoint of a full swing and shows the start of moving. Bullish flags can form after an uptrend, bearish flags can form after a downtrend. Flag Pattern Scanner Indicator It is usually difficult for a trader to recognize classic patterns on a chart, as well as sear
Contact me for instruction, any questions! Introduction V Bottoms and Tops are popular   chart patterns   among traders due to their potential for identifying trend reversals. These patterns are characterized by sharp and sudden price movements, creating a V-shaped or inverted V-shaped formation on the   chart . By recognizing these patterns, traders can anticipate potential shifts in market direction and position themselves accordingly.  V pattern is a powerful bullish/bearish reversal pattern
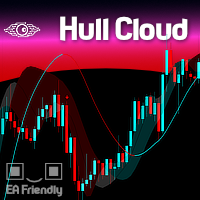
Hull Cloud
Flavio Javier Jarabeck
The Hull Moving Average is known for its ability to reduce lag and provide a clearer, more accurate depiction of market trends. By smoothing price data more effectively than traditional moving averages, it helps traders identify trend directions and reversals with greater precision. The Hull Cloud indicator elevates this by using four Hull Moving Averages working together like an orchestra. This combination creates a dynamic system that highlights short, medium, and long-term trends, giving trad
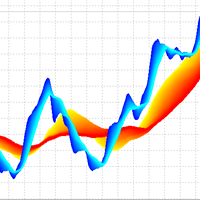
ThreeD Trend MT5
Kyra Nickaline Watson-gordon
3D Trend Indicator is a non-repaint indicator using multiple moving averages with a 3D surface view. By using this indicator, you can remove uncertainties that can happen using a single and fixed moving average period. You  can use a cloud area using a range of moving average periods. Also a wide range of visual settings are added to this indicator to have a better view from the cloud area. Alert and notification system added to the indicator to inform the trader about the action of candles on t
Apresentamos o Indicador de novo grafico - uma ferramenta poderosa para traders que buscam uma análise de preço suave e clara. Este indicador inovador calcula a média simples dos preços, oferecendo uma visão precisa e ajustada dos movimentos do mercado. Como Funciona : O Indicador de Média de Preços Simples (SMA) utiliza uma fórmula simples e eficaz: Ele soma o valor do último preço com o preço anterior. Em seguida, divide essa soma por 2 para obter a média. Fórmula : SMA = U ˊ ltimo Pre c ¸ o +
MinMax Levels MinMax Levels  –  это индикатор уровней максимальной, минимальной и цены открытия за важные торговые периоды: дня, недели и месяца. Каждый участник рынка форекс испольует уровни в своей торговой системе. Они могут быть как основным сигналом к совершению сделок, так и дополнительным, выступая в качестве аналитического инструмента.  В данном индикаторе в качестве важных периодов были выбраны дни, недели и месяцы, поскольку они являются кючевыми периодами торговли крупных участников
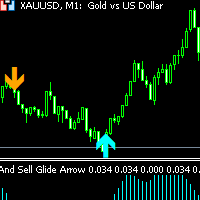
Buy and Sell Glide Arrow  non-repaint and arrow appears on current candlestick orange arrow is a sell signal blue arrow is a buy signal Buy and Sell Glide Arrow works on 1 minute, 5 minutes and 15 minutes timeframes only as it is a scalping indicator. Pairs to trade: Forex pairs such as EURUSD,GBPUSD and other METALS: XAUUSD(GOLD) and other INDICES: Boom and crash 1000, Volatility Pairs such as VIX 10 - VIX 100 and other Lastly BTC AND LTC and other
Если вам нужен индикатор, который показывает точки входа в рынок, то это ваш индикатор.  Индикатор не перерисовывается. Показывает точки покупки и продажи для любого ТФ (таймфрейма) и любой валютной пары. Настройки регулируются для всех инструментов. Каждый параметр вы можете настроить для любого брокера, для любого счёта. Это ПОДУШКА, на которой удобно:)) Просто проверьте это.....
Conquistador — это фундаментальный технический индикатор, предназначенный для оценки текущей рыночной ситуации и определения оптимальных точек входа и выхода на рынке валютных пар с минимальным риском. Данный индикатор создан на основе оригинальных индикаторов поиска экстремумов и отлично подходит для определения разворота или резкого движения рынка. Благодаря Conquistador вы сможете своевременно распознавать такие моменты и получать уведомления в виде цветных точек на графике: синяя точка сигн
Description of the Indicator The indicator "BullsBearsPulse" is designed for MetaTrader 5 and provides a visual representation of the Bulls Power and Bears Power indicators. These indicators are useful tools for technical analysis, particularly for the EUR/USD currency pair, to help traders identify potential trading opportunities. Functionality Bulls Power : This indicator measures the strength of the bulls (buyers) in the market. It calculates the difference between the highest price and a 20
The Engulf Seeker indicator is a powerful tool designed to detect engulfing candlestick patterns with precision and reliability. Built on advanced logic and customizable parameters, it offers traders valuable insights into market trends and potential reversal points. Key Features and Benefits: Utilizes revised logic to analyze previous candles and identify strong bullish and bearish engulfing patterns. Convenient arrow-based alert system notifies traders of pattern occurrences on specific symb
This spread indicator displays the actual spread of each candle. It highlights the maximum spread and the minimum spread of the chosen symbol. This indicator is very helpful to see in real time the spread evolution helping to avoid taking a trade when the spread is too high. Inputs: Print value in Points: if true displays the spread as a whole number D isplay minimum and maximum spread of the past N days: select the number of days to consider the maximum and minimum spread Automatically
===> Что делает этот индикатор? Он рисует только один средний SMA с выбором сроков Вы помещаете этот индикатор на свою графику столько раз, сколько вам нужно в среднем. Выберите параметры и характеристики вашего среднего значения, и все !!! **** См. Скриншот от 01 до 02 Не стесняйтесь просить меня, чтобы код iCustom легко интегрировал это среднее в свои собственные коды, другой индикатор или EA Выбирать Целевой срок Количество периодов Отставание Желаемый OHLC Модный цвет Вы можете на
===> Что делает этот индикатор? Он рисует только один средний EMA с выбором сроков Вы помещаете этот индикатор на свою графику столько раз, сколько вам нужно в среднем. Выберите параметры и характеристики вашего среднего значения, и все !!! **** См. Скриншот от 01 до 02 Не стесняйтесь просить меня, чтобы код iCustom легко интегрировал это среднее в свои собственные коды, другой индикатор или EA Выбирать Целевой срок Количество периодов Отставание Желаемый OHLC Модный цвет Вы можете на
===> Что делает этот индикатор? Он рисует только один средний SMMA с выбором сроков Вы помещаете этот индикатор на свою графику столько раз, сколько вам нужно в среднем. Выберите параметры и характеристики вашего среднего значения, и все !!! **** См. Скриншот от 01 до 02 Не стесняйтесь просить меня, чтобы код iCustom легко интегрировал это среднее в свои собственные коды, другой индикатор или EA Выбирать Целевой срок Количество периодов Отставание Желаемый OHLC Модный цвет Вы можете н
===> Что делает этот индикатор? Он рисует только один средний LWMA с выбором сроков Вы помещаете этот индикатор на свою графику столько раз, сколько вам нужно в среднем. Выберите параметры и характеристики вашего среднего значения, и все !!! **** См. Скриншот от 01 до 02 Не стесняйтесь просить меня, чтобы код iCustom легко интегрировал это среднее в свои собственные коды, другой индикатор или EA Выбирать Целевой срок Количество периодов Отставание Желаемый OHLC Модный цвет Вы можете н
Relative Adaptive RSI
German David Nino Cifuentes
Оптимизируйте свои торговые стратегии с индикатором RAR (Relative Adaptive RSI)! Этот продвинутый индикатор технического анализа сочетает в себе мощь индекса относительной силы (RSI) с адаптивными технологиями, предоставляя более точные и надежные сигналы по сравнению с обычным осциллятором. Что такое индикатор RAR? RAR - это индикатор, разработанный для MetaTrader 5, который использует экспоненциальные скользящие средние (EMA) и адаптивные скользящие средние (AMA) для сглаживания RSI и динамиче
Тестовый продукт. Пожалуйста, НЕ ПОКУПАЙТЕ! Тестовый продукт. Пожалуйста, НЕ ПОКУПАЙТЕ! Тестовый продукт. Пожалуйста, НЕ ПОКУПАЙТЕ! Тестовый продукт. Пожалуйста, НЕ ПОКУПАЙТЕ! Тестовый продукт. Пожалуйста, НЕ ПОКУПАЙТЕ! Тестовый продукт. Пожалуйста, НЕ ПОКУПАЙТЕ! Тестовый продукт. Пожалуйста, НЕ ПОКУПАЙТЕ! Тестовый продукт. Пожалуйста, НЕ ПОКУПАЙТЕ!

MetaTrader Маркет позволяет максимально безопасно покупать программы для платформы MetaTrader. Вы можете скачать демо-версии понравившихся роботов и индикаторов прямо из терминала и проверить их в тестере стратегий.

Протестируйте программы в различных режимах перед покупкой для получения максимального представления о продукте и оплатите понравившийся продукт через платежную систему MQL5.community.

Платежная система MQL5.community обеспечивает оплату продавцам, а возможность тестирования программ в различных режимах позволяет покупателям получить максимальное представление о продукте.