Mirza Baig
Mirza Baig
  • Information
10+ years
experience
0
products
0
demo versions
0
jobs
0
signals
0
subscribers
::: You must expect to be stung by bees when in search of honey :::
::: He who is not courageous enough to take risks will accomplish nothing in life :::
shared author's Sergey Golubev post
SOMETHING TO READ - Market Wizards by Jack Schwager - a collection of interviews of a group of successful traders in the 1970s/80s.

This is a classic to read and enjoy. How do the world's most successful traders amass tens, hundreds of millions of dollars a year? Are they masters of an occult knowledge, lucky winners in a random
shared author's Roberto Jacobs code
 AutoTStop EA
AutoTStop EA does not work to open the orders, but only helps trader to use Trailing Stop.
shared author's Roberto Jacobs code
 The SmartAssTrade-V2 Forex Expert Advisor
The SmartAssTrade-V2 Forex Expert Advisor is a new update for SmartAssTrade EA Version 1.
Roberto Jacobs
Roberto Jacobs
1
Sergey Golubev
Sergey Golubev
The Ascending Triangle: The ascending triangle is formed when the market makes higher lows and the same level highs. These patterns are normally seen in an uptrend and viewed as a continuation pattern as the bulls gain more and more control running up to the top resistance line of the pattern...
1
Sergey Golubev
Sergey Golubev
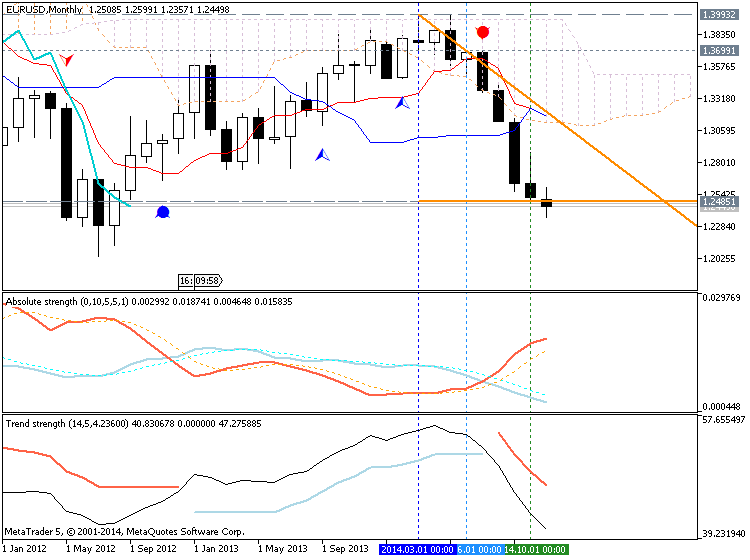
EURUSD Technical Analysis 2014, 30.11 - 07.12: Ranging Bearish With 1.2360 Support
D1 price is on primary bullish market condition with ranging between 1.2599 resistance and 1.2360 support levels: The price is located below Ichimoku cloud/kumo with Sinkou Span A line as the nearest kumo border The price is moving along trendline
EURUSD Technical Analysis 2014, 30.11 - 07.12: Ranging Bearish With 1.2360 Support
Roberto Jacobs
Roberto Jacobs
1
Sergey Golubev
Sergey Golubev
US Dollar Forecast - Dollar Ready to Take Advantage of Market Unease But Rates at Risk Until the market can close its disparate view for the timing and pace of rate hikes to that of the Fed or the Primary Dealers, premium will start to waver...
1
Sergey Golubev
Sergey Golubev
There are hundreds and hundreds traders if not thousands of traders trade...
1
Sergey Golubev
Sergey Golubev
US DOLLAR TECHNICAL ANALYSIS Buyers are back on the offensive, with prices pushing to a new five-year high. A daily close above the 23.6% Fibonacci expansion at 11391 exposes the 38.2% level at 11457...
1
Sergey Golubev
Sergey Golubev
In today's lesson we are going to talk about one of the most basic anti martingale strategies, which is discussed in Dr. Van K. Tharp's book Trade Your Way to Financial Freedom, the Percent Risk Model...
shared author's Sergey Golubev post
TRADING MANUAL - How to Use Heiken-Ashi

Candlesticks are a great tool to help you see sentiment in real-time. However, there is something deeper than what the candlestick is showing you. That something deeper is your fear of being on the
Sergey Golubev
Sergey Golubev
Developed by Alexander Elder Bulls Power is used to estimate power of the Bulls (Buyers). Bulls Power estimates the balance of power between the bulls and bears. This indicator aims at identifying if a bullish trend will continue or if the price has reached a point where it might reverse...
shared author's EmmeMe post
TRADING MANUAL - Trendline Breakout and Trend Reversal

Technicians exercise variety of time and price filter in order to identify valid trendline penetration and avoid bad signals or "whipsaws". Depending on the type of financail market, some use 1% while

Sergey Golubev
Sergey Golubev
Developed by Alexander Elder. Bears Power is used to estimate power of the Bears (Sellers). Bears Power estimates the balance of power between the bulls and bears. This indicator aims at identifying if a bearish trend will continue or if the price has reached a point where it might reverse...
shared author's Dmitriy Zabudskiy article
Indicator for Constructing a Three Line Break Chart

This article is dedicated to the Three Line Break chart, suggested by Steve Nison in his book "Beyond Candlesticks". The greatest advantage of this chart is that it allows filtering minor fluctuations of a price in relation to the previous movement. We are going to discuss the principle of the chart construction, the code of the indicator and some examples of trading strategies based on it.

shared author's Peter Gervas post
Trading Tools Explained: Full Metatrader 5 Overview

Name of this video is Full Metatrader 5 Overview. Some MT5 features were not explained there but, anyway - it is interesting to watch about Depth of Market feature and about other features of

shared author's Daniel Stein post
How to select the right News events for trading

Dear customers, friends and interested traders, the results of our fully automated EA based on the Blueball Trading System made clear how important the selection of the right news events is. We

shared author's Sergey Golubev post
TUTORIAL DIGEST - All about Calendar tab and Macro Economic Events

This summary was created by Alain Verleyen For traders New Video : How to delete Calendar Events from charts ? New Video : How to disable Calendar Events from charts ? New Video : How to export
Sergey Golubev
Sergey Golubev
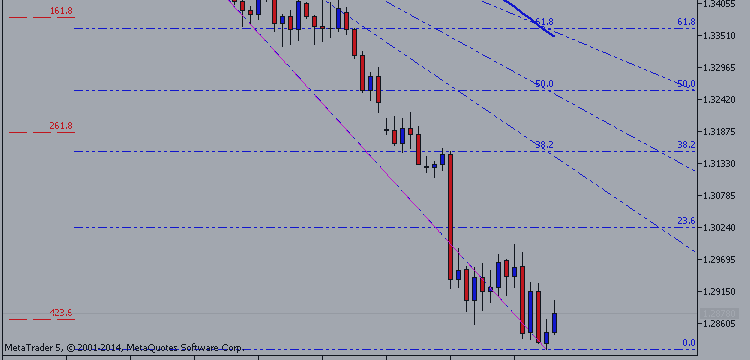
EUR/USD continues to show secondary flat movement this week, and this pair was trading in the mid-1.28 range in European session. Taking a look at today's key events: French Manufacturing PMI improved to 48.8 points, German Manufacturing PMI dipped to 50.3 points...